


Introduction1
This brief report continues our series investigating the extent of restrictive and exclusionary zoning in regions across the state of California. Previous reports include municipal, county and regional zoning maps, and features findings connecting key community characteristics (like rents, housing costs, and educational attainment) with the degree of restrictive zoning. We are particularly interested in how exclusionary zoning results in racial and economic segregation within regions. These regional reports and the accompanying maps (and data) will ultimately become part of a statewide California Zoning Atlas, which itself will be part of a national zoning atlas.
The first report in this series (both the initial and more extensive follow-up) covered the nine-county San Francisco Bay Area. We found profound and disturbing relationships between restrictive zoning and racial composition, housing costs, educational outcomes, economic mobility, environmental conditions, and much more. We also produced simplified and easy-to-read zoning maps for every municipality and county in the region, as well as created an interactive drop-down menu map of the region. And our data and shapefiles were made available to researchers.
The second report in this series focused on the Greater Los Angeles region, also known as the SCAG region, by its metropolitan planning area organization (MPO) acronym. In that report, we described the extent of single-family zoning in the region, the relationship between such zoning and racial composition, and the characteristics of communities based on their degree of single-family-only zoning. As with the Bay Area, we found striking and disturbing patterns of racial and economic exclusion associated with communities with a greater degree of single-family-only zoning. Supplemental research also found significant disparities in revenues and expenditures across the Los Angeles region in relation to the degree of single-family-only zoning. Also accompanying that report was a series of static municipal, county and regional zoning maps, and an open source dataset of shapefiles.
Our third report in this series examined the Sacramento region, also known as SACOG, by its MPO acronym. Once again, we found profound relationships between restrictive zoning and racial and economic exclusion and other community characteristics. We also produced static municipal, county, and unincorporated area maps for the entire region, along with an interactive drop-down map and open-source data and shapefiles.
This (fourth) regional report continues that research, but with a focus on the San Diego region and a narrower scope. This regional report only encompasses San Diego County, but it includes 18 incorporated municipalities and unincorporated areas. With over 3 million residents, it is California’s second most populous county, and the fifth largest in the United States.2 It includes small affluent suburbs, diverse beachside communities, cozy exurban communities, several military communities, including a major naval base, and a large major urban city. Ten out of the 18 jurisdictions within the county are beachside communities, and more are adjacent.
Nonetheless, because there are so few jurisdictions in the region compared to our previous regional analyses, and because of the highly unique and unusual characteristics of the jurisdictions here relative to other regions, we are truncating our analysis to summary descriptive statistics of restrictive zoning in the region. We will describe our main findings, and then compare our top-line findings for this region to those in our previous three regional reports. Only in our recommendations section, in which we identify the jurisdictions most in need of reform, will we delve into the harmful exclusionary effects (by race and class) of restrictive zoning.
As before, for this report, we have produced 21 static zoning maps: one map for each of the 18 municipalities, a county map compiling the incorporated areas, an unincorporated county map, and a combined county map of the region. We have also created an interactive map with a drop-down menu containing each municipality.
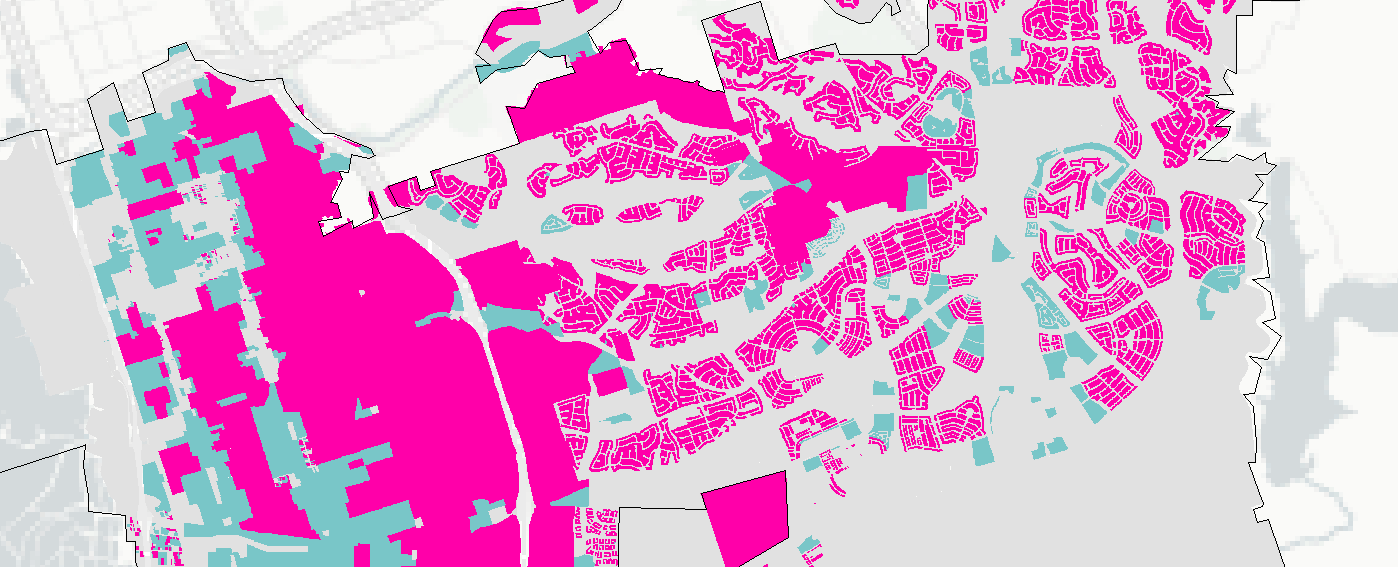
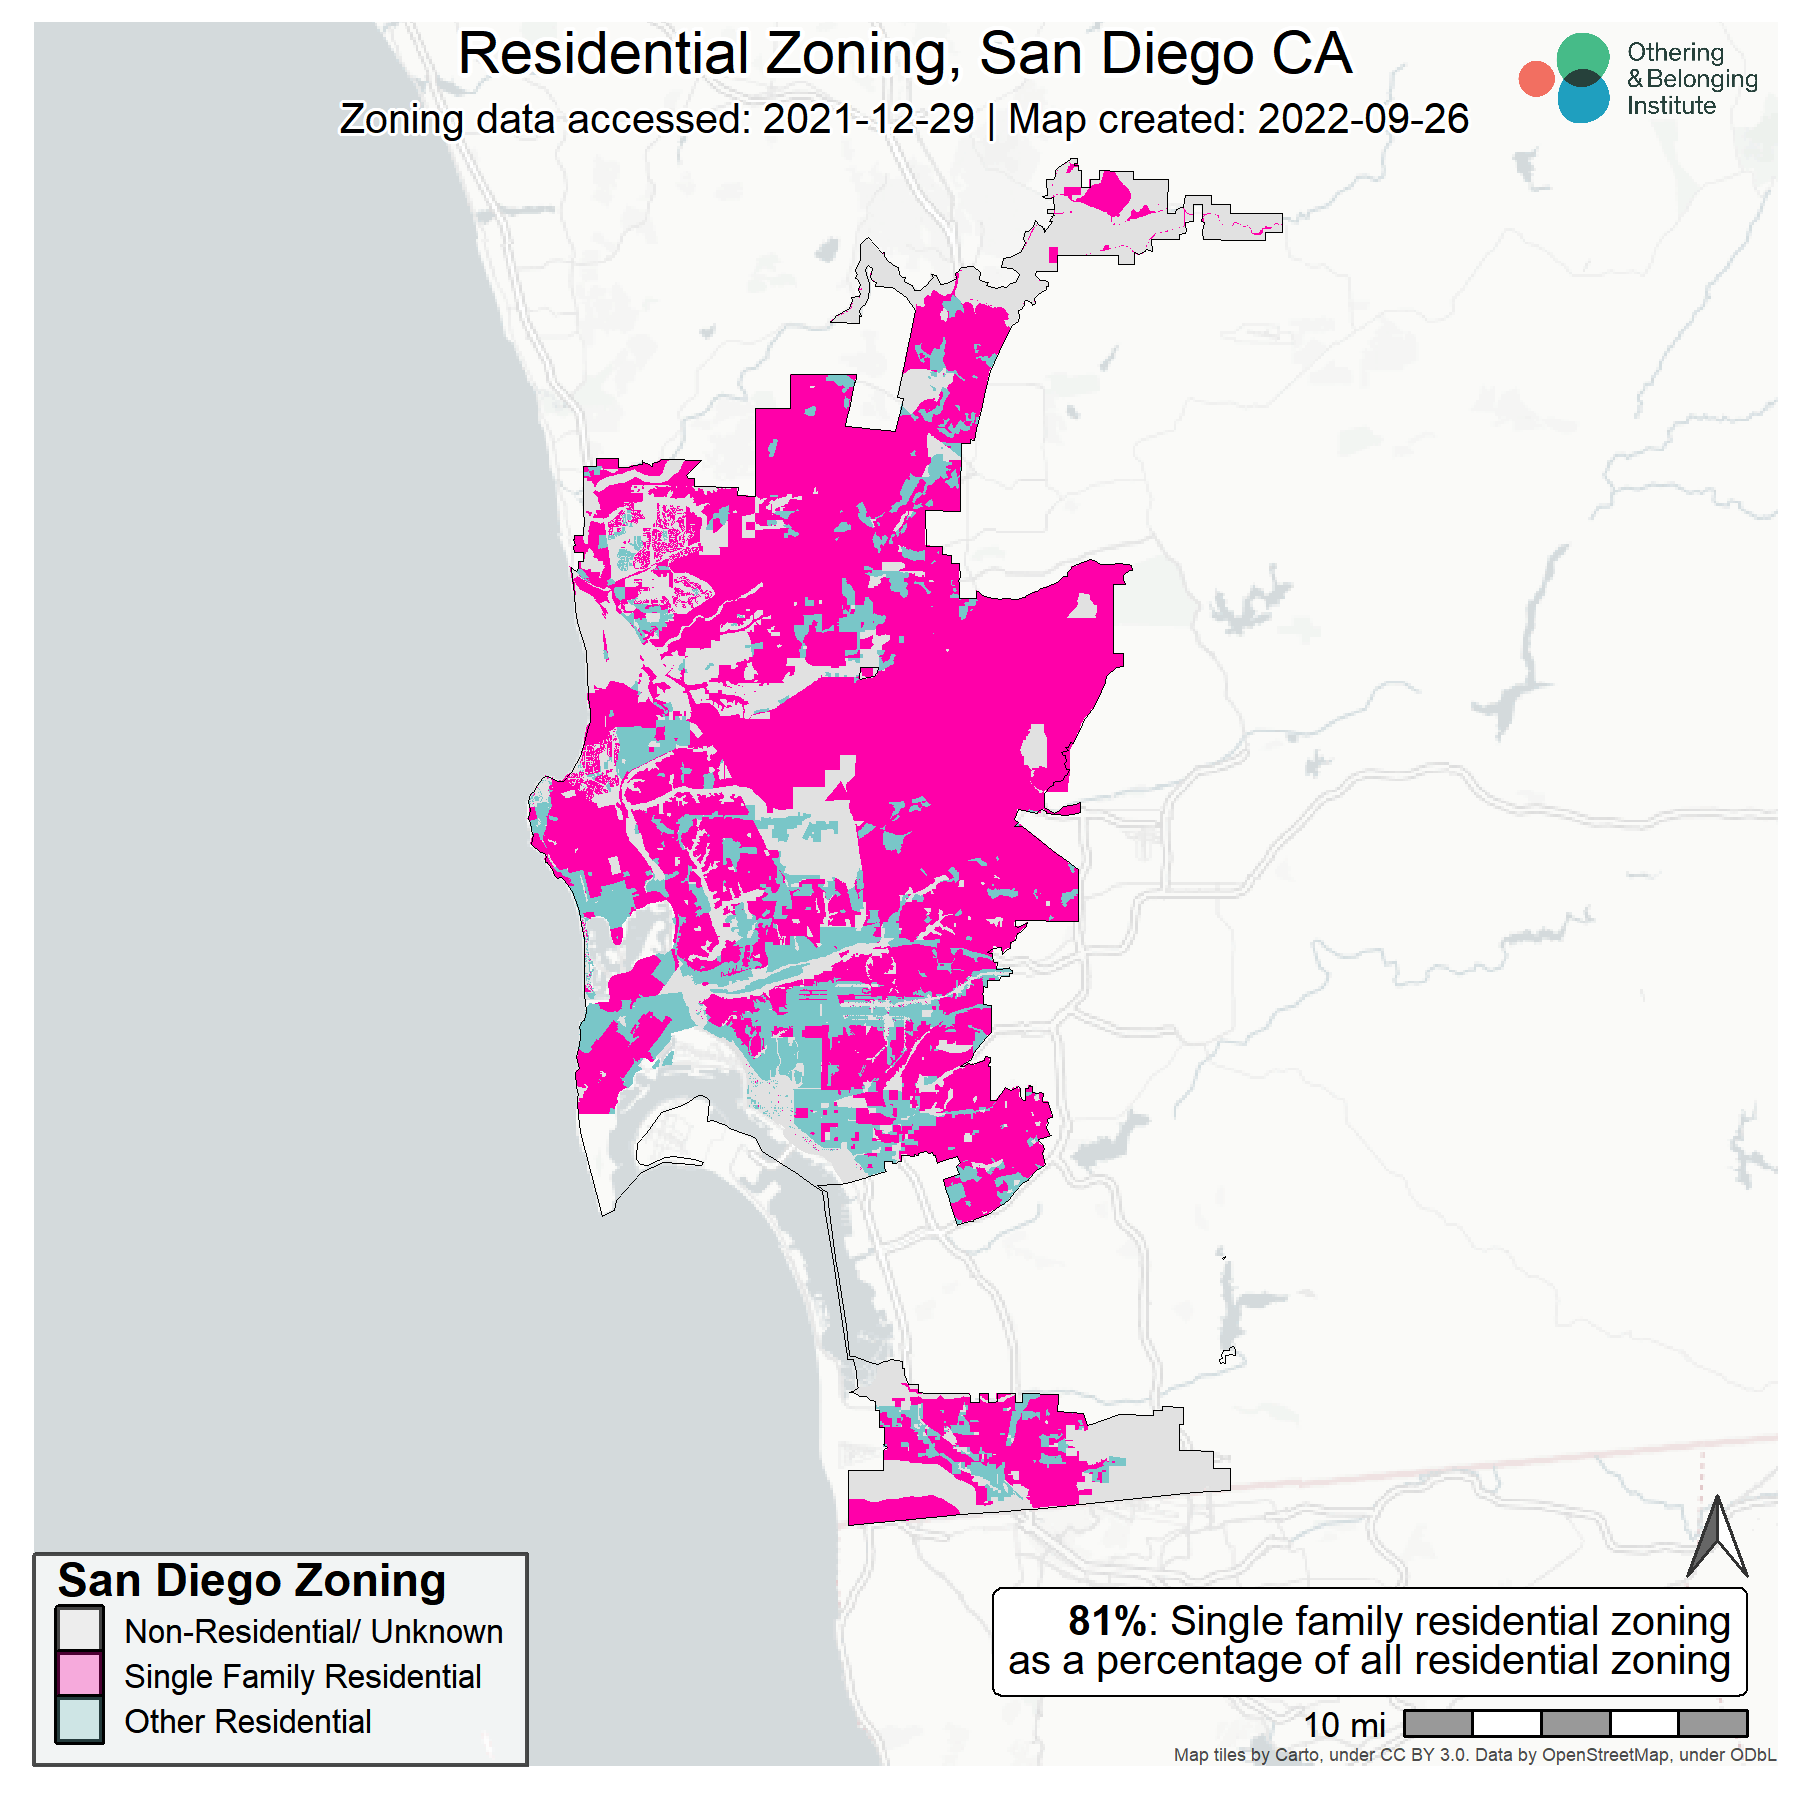
Each map illustrates the extent of single-family-only residential zoning, multi-family and mixed-use residential zoning, and non-residential zoning by area. It also indicates the percentage of single-family zoning relative to all residentially zoned areas, as well as the date in which the underlying zoning ordinance was accessed and the date the map was created. See Figure 1 below, as an example, of the city of San Diego.
Figure 1: Zoning in San Diego County
Our construction of the maps and analysis follows a similar methodology to that of our prior regional reports. Rather than reiterate the numerous challenges to creating zoning maps and our methodological approach, we direct your attention to the appendix to this report, where we summarize both. We have also shared a Github repository that contains all the parcel-level data for each city which includes the original zoning code as well as OBI’s simplified zoning categories for review and analysis.
An Overview of Single-Family Zoning in the San Diego Region
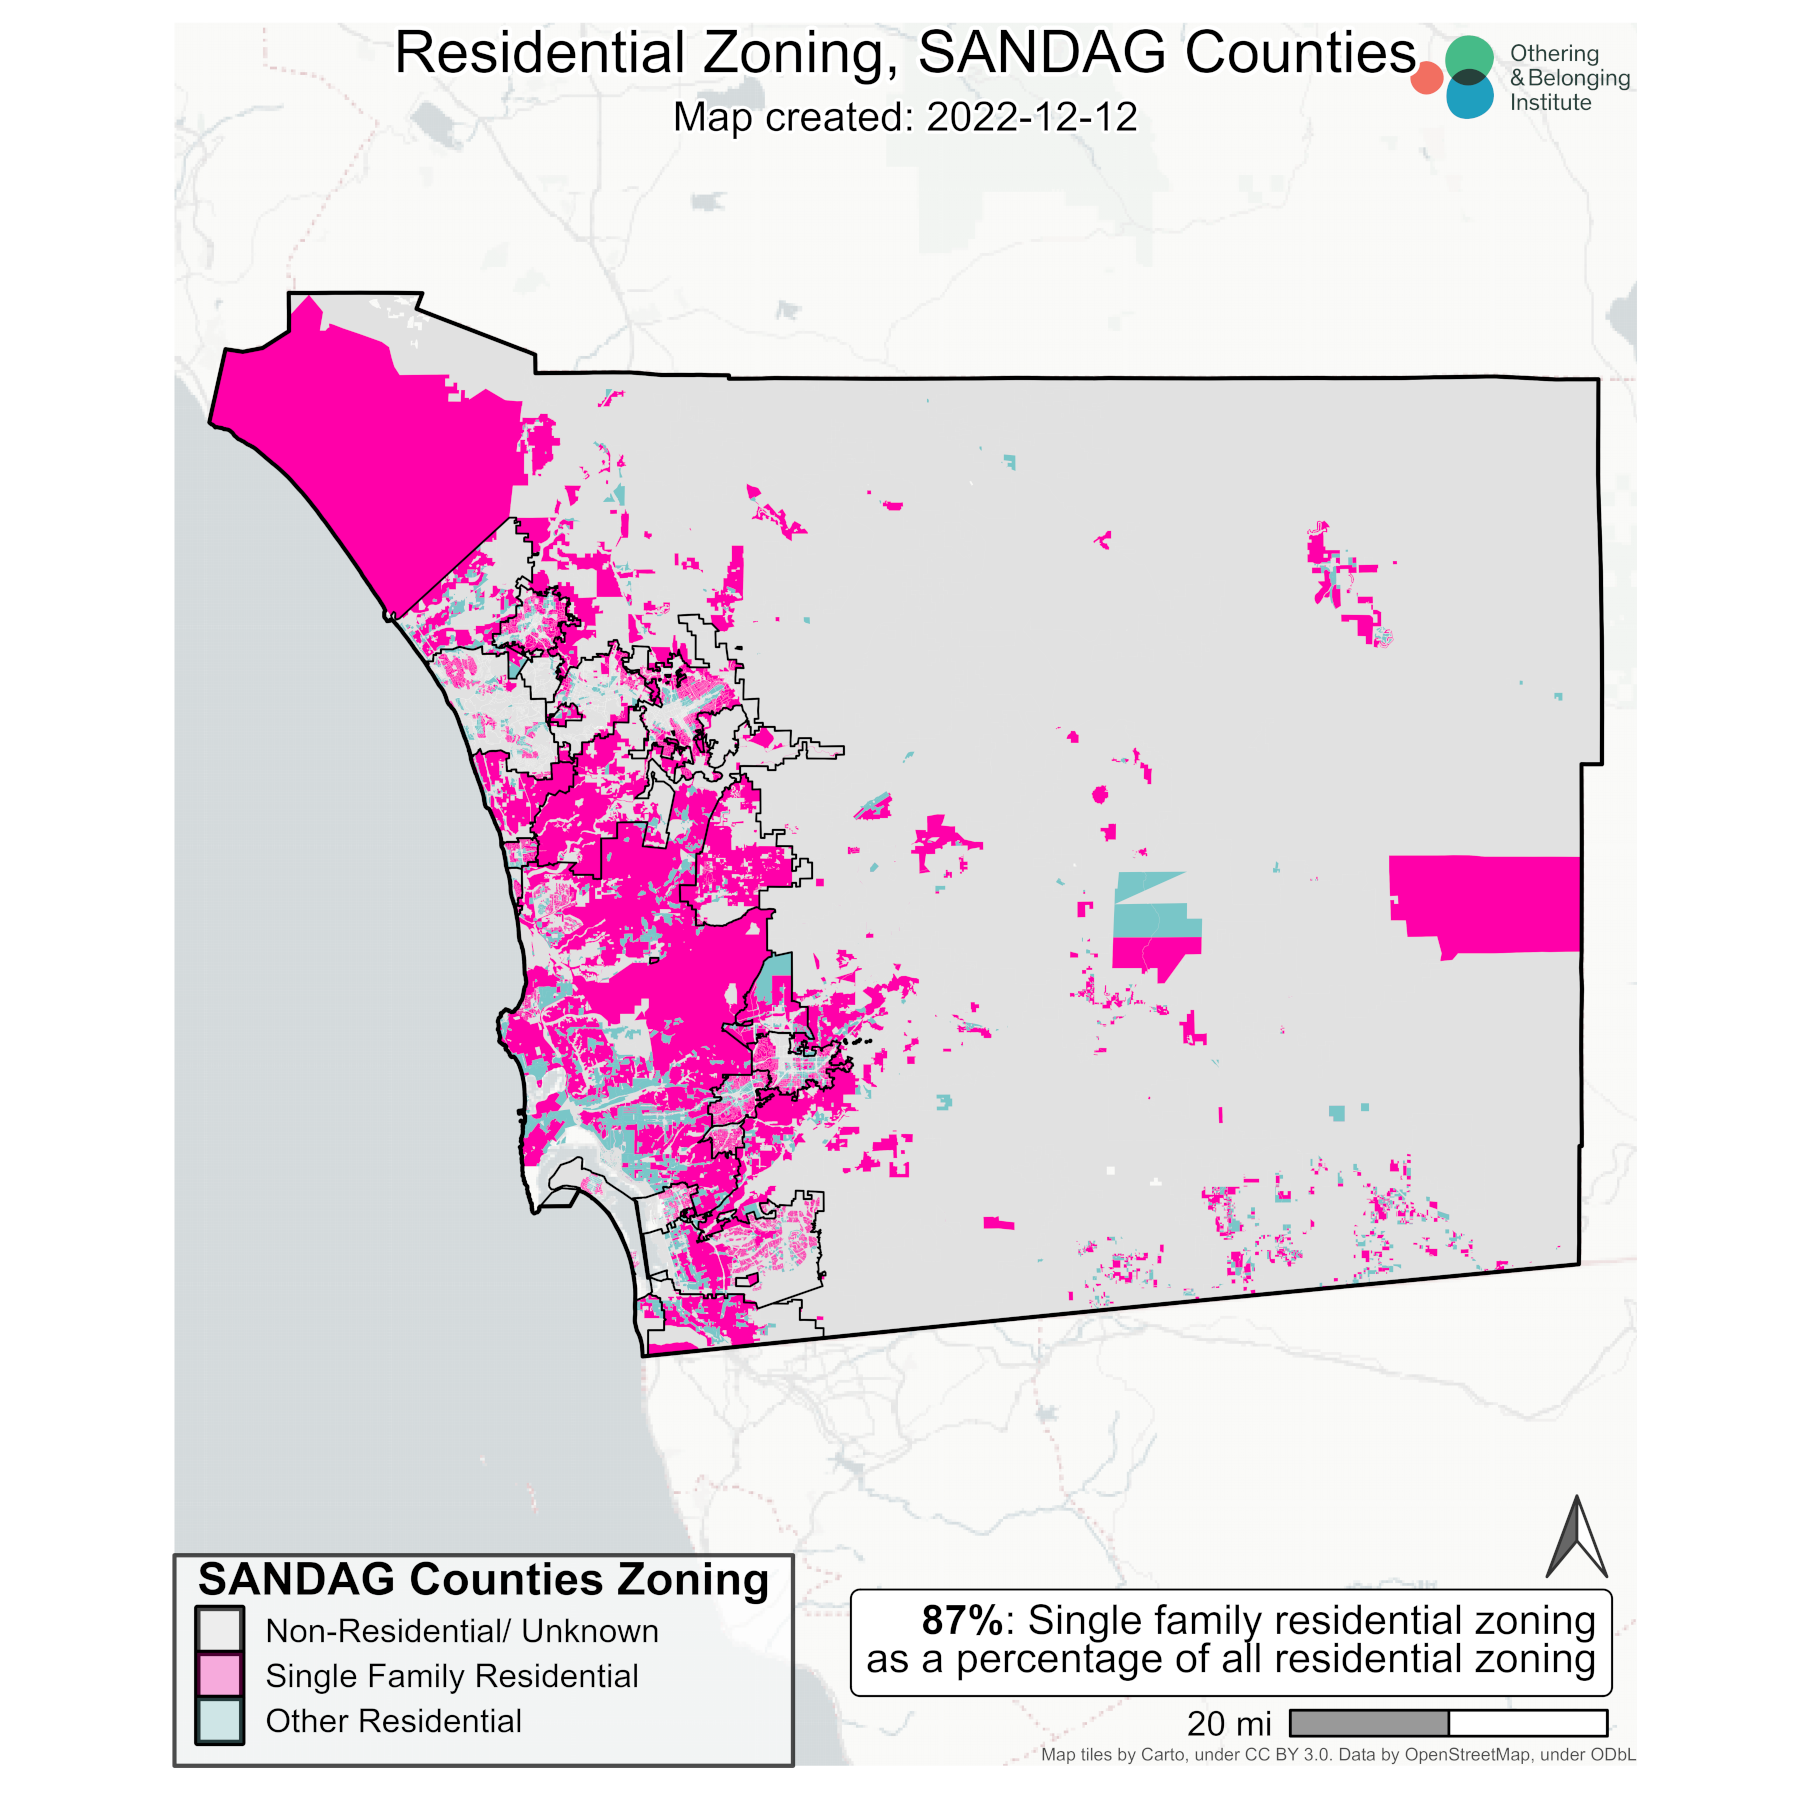
Consistent with the findings of our previous two regional investigations, we find that single-family-only zoning is predominant within the San Diego region, especially within residential areas. Specifically, we find that 75.66 percent of residential land in the region is exclusively reserved for single-family housing (see Figure 2 below), and that 39.72 percent of all land is zoned as such. The percentage of single-family zoning is, perhaps surprisingly, much greater in unincorporated areas than within incorporated areas (92.17 percent versus 74.74 percent, respectively).
Figure 2: Residential Zoning in San Diego County
Comparative Regional Analysis
Now that we have conducted similar analyses across the state, it is interesting to compare regions, as depicted in Table 1 below. As this table illustrates, San Diego is roughly in line with the other larger regions of the state in terms of its percentage of single-family zoning in relation to residentially-zoned land or all land. Notably, however, although San Diego has slightly less single-family-only zoned land than the other three regions, it has a smaller share of land available for multi-family housing.
Table 1: San Diego Zoning vs. other California Regions
| Region | # of jurisdictions | % of SFZ of residential land | % SFZ of all Land | % of residential land available for multi-family housing | % of land available for multi-family housing |
| SF Bay Area | 101 | 85% | 47% | 14.9% | 2.7% |
| Los Angeles | 191 | 77.7% | 41% | 23.1% | 11.8% |
| Sacramento | 22 | 77% | 42% | 19.09% | 12.10% |
| San Diego | 18 | 74.74% | 39.7% | 21.7% | 10.78% |
These findings are also consistent with other detailed investigations (rather than survey data) conducted in other regions of the country. For instance, a report by the Twin Cities’ Star Tribune found that 73 percent of residential land in the Twin Cities (104 jurisdictions) is governed by local zoning ordinances that only allow single-family detached homes.3 Similarly, a statewide analysis of Connecticut (including over 2,600 jurisdictions) found that 70 percent of residential land was zoned exclusively for single-family dwellings.4 As various regional analyses continue to be produced, it appears that the percentage of single-family-only zoned areas of residential land continues to fall within a remarkably consistent range. That the key range varies so little despite tremendous contextual differences in terms of population, economy, topography, and number of jurisdictions is remarkable, and speaks to the power of zoning as a tool used (or manipulated and abused, depending on your perspective) by municipalities.
Despite regional similarities, cities within the San Diego region (as all regions we have surveyed so far) vary tremendously in their degree of zoning restrictiveness. Imperial Beach has the least amount of residential land zoned for single-family-only housing, while Poway has the most. Encinitas has the largest portion of all land zoned for single-family-only housing, while Coronado has the least (see Table 2 below).
Table 2: Key Single-Family Zoning Statistics
| % of residential land | % of all land | |
| Mean | 74.74% | 41.2% |
| Median | 74.67% | 41.78% |
| Maximum | 97.69% (Poway) | 72.82 (Encinitas) |
| Minimum | 49.32% (Imperial Beach) | 9.68% (Coronado) |
Identifying Cities for Reform
As in our previous regional reports, we attempt to identify cities that may be the stronger candidates for zoning reform in the region. In our previous reports, we applied several simple selection criteria to identify jurisdictions that would be excellent candidates for zoning reform. In addition to those same factors, we are also adding an analysis of the city’s racial and economic demographics relative to the region.
The criteria we have previously used to select jurisdictions that would serve the region by reforming their zoning regulations included:
1) The percentage of single-family-only zoned residential areas
The greater the proportion of single-family-only zoned residential, the more likely it is that a jurisdiction is excessively restrictive and should permit greater density. This indicator selects only jurisdictions with a high or extremely high level of single-family-only zoned areas.
2) The percentage of the jurisdiction that is designated as “high opportunity” on the state’s COG-based opportunity maps5
The Tax Credit Allocation Committee’s official opportunity maps already guide the state’s allocation of federal subsidies for affordable housing, and for that reason are useful indicators for identifying jurisdictions with a high degree of opportunity. Jurisdictions with a greater share of high-opportunity neighborhoods are better targets for reform in relation to equity objectives. Here, we chose municipalities with 85 percent or more neighborhoods designated high-opportunity areas.
3) Distance from regional economic centers (central business districts)
This indicator is a proxy for access to jobs. Upzoning areas that are remote or difficult to access makes far less sense than upzoning neighborhoods that are already accessible and proximate to jobs and businesses. Therefore, we excluded jurisdictions too remote from job centers as places to prioritize reform. We selected municipalities where the commute is 40 minutes or less from the nearest central business district. There are other possibly more direct measures of job proximity, but this measure has the additional benefit of reflecting significant existing transit infrastructure. Central business districts are accustomed to accommodating large numbers of daytime workers. We apply this criteria both in terms of distance and travel time.
4) Poor performance with RHNA targets
The Regional Housing Needs Assessment requires that every jurisdiction in the state plan for housing at five different income levels, "very-low," "low," "moderate," "above-moderate," and “high.”6 Jurisdictions are required to zone for local needs, but in practice, jurisdictions do not meet their RHNA requirements.7 Jurisdictions that perform especially poorly with respect to RHNA targets for low and very-low income housing are excellent candidates for zoning reform because government agencies have already determined that they should have a greater share of affordable housing developments. Table 3 below displays our results.
Table 3: Jurisdictional Candidates for Zoning Reform and Selection Indicators
| Cities | Single Family % | % of Neighborhoods in High Opportunity Category | RHNA Low & Very Low Income Completion8 | Minutes from CBD | Miles from CBD9 |
| Encinitas | 95% | 100% | 0.07% | 33.9 | 23.7 |
| Poway | 98% | 100% | 0.15% | 34.5 | 20.5 |
| Del Mar | 70% | 100% | 0% | 29.2 | 18.1 |
| Solana Beach | 69% | 100% | 0.04% | 27.5 | 20 |
To summarize, we conclude that Encinitas, Poway, Del Mar, and Solana Beach are the four jurisdictions that appear to be most urgently in need of zoning reform based on our four-factor criteria. This does not mean that other jurisdictions should not also consider it. But these four jurisdictions are the most extreme cases within the region.
Critically, however, these are jurisdictions that feature strong evidence of racial and economic exclusion as well. Table 4, below, compares these selected jurisdictions in terms of race and income to the region as a whole.
Table 4: Jurisdictional Candidates by Race and Class10
| Jurisdiction | % White | % Black | % Latino | % Asian | Median Income | Median Home Values |
| San Diego County | 44.15% | 6.56% | 34.32% | 15.04% | $88,240 | $627,200 |
| Encinitas | 74.94% | 1.22% | 16.62% | 7.46% | $132,276 | $1,096,400 |
| Poway | 62.16% | 3.06% | 16.92% | 16.80% | $119,847 | $766,700 |
| Del Mar | 83.23% | 2.74% | 9.63% | 2.42% | $157,708 | Above $2 million |
| Solana Beach | 68.41% | 1.67% | 17.44% | 11.46% | $113,903 | $1,431,600 |
As you can see, the white population of these jurisdictions is much larger (and Black population respectively much smaller) as a proportion than the region as a whole. This does not mean that zoning reform alone will make these places more diverse, inclusive and equitable, but it is a necessary first step.
Similarly, the median income and median home values (a wealth proxy) are far above that of the county and metropolitan region, suggesting a powerful economic exclusionary effect to restrictive zoning in these communities. Again, loosening restrictive zoning, alone, will not create natural housing affordability or community access, but that access will be nearly impossible without doing so.
Conclusion
As with our previous studies, the San Diego region’s residential areas are dominated by single-family-only zoning, stifling the development of denser housing options, perpetuating racial and economic exclusion, and shaping access to opportunity for millions of Californians.
We hope this brief report sheds critical light on the pattern and extent of the problem in this region. We will continue our investigation of other regions as we build toward a statewide zoning atlas into 2023.APPENDIX: CHALLENGES & METHODOLOGY
Challenges
There are many daunting research challenges to studying municipal zoning. Foremost among them is the lack of consistent classifications or base formulae for zoning designations from which they may be derived. Zoning codes are generally dense, technical, and difficult to access. While there may be strong similarities in zoning taxonomies across jurisdictions with land use authorities, the particulars of each zoning code are often idiosyncratic to the jurisdiction. Certain designations may mean different things in different jurisdictions. This means that studying regional zoning patterns requires tedious and time-intensive effort to produce accurate data.
There are shortcuts researchers can use to gather data, but they lack precision. The most common and widely relied upon shortcut is the use of survey instruments (e.g. the Wharton Regulatory Land Use Index). We summarized notable zoning surveys, going back to the 1970s, and their respective strengths and limitations, in our Bay Area report.11 Although there are a number of other proposed methodological shortcuts, including restricting analysis to a sample of cities using American Community Survey samplings of housing units within cities, or drawing inferences about zoned density from property tax records, the vast majority of research conducted on this issue relies upon these survey instruments.12
While these surveys may be generally useful, there is evidence to suggest that their results contain systematic errors, partly due to the inaccurate perception of the survey respondents.13 These surveys also suffer from lack of reliability, since, in many cases, respondents fail to complete the survey, creating holes in the datasets.14 These instruments are also limited and tend to focus on the largest jurisdictions, meaning that smaller municipalities are less likely to be included. This may be another source of systematic bias in such data, since smaller municipalities may have a greater share of restrictive zoning.
Another challenge to studying zoning is that zoning ordinances and codes do not necessarily indicate actual zoning, especially for planned developments. Planned development is typically a designation that allows for more flexible or dynamic zoning and land use, where planners anticipate or intend future development. The intended use for such parcels may not be defined in the municipal zoning code, meaning that it has to be observed directly.15
A related problem is that zoning codes do not always reflect the built environment, and vice versa. This is probably the single biggest source of confusion regarding our zoning maps, as evidenced from inquiries we have received about them. Our maps and analyses are of zoning, not the built environment. While the actual built environment may be the most relevant piece of information for some purposes (such as researchers or policymakers who are primarily concerned with the production of housing), our research is focused on better understanding how zoning designations themselves shape or correlate with certain community characteristics and life outcomes.
So-called “non-conforming uses,” which create a divergence between the built environment and zoning laws, exist for many reasons. Some developments, especially older ones, may have been constructed before zoning codes were adopted or prior to a down-zoning of the neighborhood to prevent new, higher density developments. Developers of more recent developments may petition for, and receive, a “spot variance,” which is permission to build at a higher density or taller than what is permitted by ordinance. Certain state laws, like density bonus laws, may similarly create override mechanisms that generate non-conforming structures. One cannot easily scan an environment and accurately infer a zoning designation.
Methodology
Because we are specifically interested in the effects and/or correlates of restrictive zoning itself, and most of the zoning codes were idiosyncratic across municipalities, for purposes of this report, we simplified zoning designations into three broad categories: Single Family Residential, Other Residential, and Non-Residential/Unknown, defined as follows:
- Single Family Residential is land designated for detached, single-family residential land use (one or two dwelling units per parcel of land) in both low and high density. This includes single-family homes and two-family detached dwellings, and usually includes single-family zones, low-density zones, agriculture zones (if single-family homes are permitted) or estate zones. The zone is not classified as single-family residential if it only permits the following: caretaker’s residence, employee housing, or live-work unit.
- Other Residential includes both multi-family residential and mixed-use residential.
- Multi-family residential is land designated to allow for multiple dwelling units per parcel of land. This includes apartment buildings, duplexes, triplex, fourplex, townhouses, condos, mobile home parks, and two-family attached dwellings. Additionally, if a zone’s intent allows for both single-family homes and any of the multi-family housing above, it is sorted into the multi-family category. This category does not include employee housing and student housing.
- Mixed-Use Residential is land designated to blend multiple uses that includes residential use. This includes mixed-use commercial zones permitting residential use, zones allowing multi-family buildings with commercial spaces (e.g., on the group floor), and zones where residential use and other non-residential uses such as commercial or industrial uses are both permitted.16
- Non-Residential is land that is designated for non-residential uses. This includes parks and open space, commercial, industrial, and public land. Non-developable land was removed from the overall land area, including water, waterways, marshland, and highways or streets.
Municipal zoning code documents are the primary source to identify each zoning category for each city, describe the purpose of each, and list what is permitted to be built in each of these zones. We utilized these documents for each city to recode each zone into the typology listed above. Based on city ordinances for each unique zone in each municipality, we recorded the type of housing development permitted and conditionally permitted as follows:
P: permitted as right. We did not include building types that were permitted for accessory use only.
C: conditionally permitted; requires review; requires minor use permit
We prioritized and focused on the intent and the purpose of the zone to sort the zones into one of the three categories: non-residential/unknown, single-family, and other residential. For example, a residential zone intended for both single-family and multi-family developments would be classified in the other residential category (which includes multi-family zones), even if multi-family is only conditionally permitted. This is because the zone’s intention was for both single-family and multi-family developments.
When the intent and purpose of the zone was unclear, we classified the zone based on what is permitted in the zone. For example, consider a “general residential” zone that does not specify whether it is strictly for single-family homes in its intent. If it permits single-family homes but only conditionally permits multi-family homes, it would be classified in the single-family category. And if it permits both single-family homes and multi-family homes, it would be classified in the other residential category. Since we prioritized the zone’s stated intent and purpose in the city ordinance, we would only rely on the permitted use if the intent and purpose was unclear.For planned development and specific plan zones where the municipal ordinance does not detail the intent and purpose sufficiently for us to classify the entire zone or zones that are missing in the municipal ordinance, we used the standardized land use class from SACOG to categorize the parcels in these zones into one of the three categories above.
We accessed parcel-level zoning data primarily from shapefile repositories maintained by individual municipalities, in addition to the repositories maintained by the SACOG organization itself. We applied our classification of simplified zoning categories to the zones found in the zoning shapefile for each city. In the absence of a zoning shapefile for a particular city either from the SACOG repository or the city planning/GIS department, we searched for these shapefiles from ESRI’s ArcGIS Hub and other online sources.17
Once we obtained the zoning shapefile, we created a list of all zoning codes available within the shapefile. We used the description of each zone in the municipal code document, and re-coded each of those to one of the three categories listed above. We then applied our simplified typology to each of the parcels in the shapefile. We mapped the data to display this typology.
We realize that our simplified taxonomy of myriad zoning designations into three categories (in order to draw out the degree to which single-family-only zoning predominates residential areas) conceals many other aspects of zoning codes that impede or restrict development or certain types of developments. For example, height limitations, setback requirements, discretionary reviews, parking requirements and the like can all inhibit density, even in multi-family residential or mixed-use zones. For that reason, in constructing this tranche of maps, we have separately created a database of additional zoning characteristics for each jurisdiction, which we will release at a future point in completing a statewide “zoning atlas” for California.18 Until then, our focus is on single-family-only residential zoning as the principal form of restrictive and exclusionary zoning.
Additional notes on methodology are below.
Data procurement: Zoning shapefiles for each city in the region were gathered from multiple sources, including the SANDAG GIS Data Warehouse, city and county planning/GIS or relevant departments, and ESRI’s ArcGIS Hub in the listed order to ensure we have the most updated shapefiles to conduct our analysis.
Quality check procedures: Human errors could impact the quality of the analysis so it was important to establish data quality checking protocols to reduce any human errors. We followed these procedures at different stages of data collection and classifying our zoning categories.
We checked for updated zoning shapefiles from individual city planning departments for each municipality to ensure we procured the most updated version of each shapefile. Once the zoning codes were extracted from the shapefiles and were re-coded to our three simplified zoning categories, another team member conducted a spot check to ensure the extraction and coding was done properly and with internal consistency. We cross-checked our final maps against the zoning maps provided by the city to ensure our processing was accurate.
Though attempts were made to minimize any human error while interpreting various zoning codes and recoding those to our simplified categories, it was beyond our capacity to check the input data for accuracy. We were not able to check that the zoning shapefiles supplied by SANDAG or any city’s planning department had the data entered correctly. We solicit any inputs or suggestions from the general public or city departments to highlight any inconsistencies in identifying the correct zoning categories and/or share updated zoning data to ensure our mapping and analysis are accurate.
- 1The authors would like to thank Joshua Cantong, Data Analyst at the Othering and Belonging Institute for their valuable insights and contributions.
- 2Health and Human Services, San Diego County, demographics: https://www.sandiegocounty.gov/hhsa/statistics_demographics.html
- 3MaryJo Webster and Michael Corey, "How Twin Cities housing rules keep the metro segregated," Star Tribune, August 17, 2021, https://www.startribune.com/how-twin-cities-housing-rules-keep-the-metro-segregated/600081529/.
- 4Sara Bronin et al., “Connecticut Zoning Atlas," Desegregate Connecticut, https://www.desegregatect.org/atlas.
- 5This opportunity map uses the same methodology as the state’s TCAC Opportunity Map but all tracts within Councils of Governments (COGs) are scored against each other. Tracts that do not fall within a COG are scored against tracts within their county. By comparison, the TCAC opportunity map uses TCAC regions as the reference geography. The TCAC/HCD map also scores rural areas separately because rural affordable housing developments compete in a separate funding pool, but such a distinction is not made here.
- 6“Regional Housing Needs Assessment,” Sacramento Area Council of Governments, https://www.sacog.org/regional-housing-needs-allocation-rhna.
- 7Heather Bromfield and Eli Moore, Unfair Shares: Racial Disparities and the Regional Housing Needs Allocation Process in the Bay Area, (Berkeley, CA: Haas Institute for a Fair and Inclusive Society, 2017), http://belonging.berkeley.edu/sites/default/files/haasinstitute_unfairshares_rhnabayarea_publish.pdf.
- 8Division of Housing Policy Development, “Annual Progress Report Permit Summary Table (K2 - AN542),” RHNA 5th Cycle Full Summary, (Sacramento, CA: California Department of Housing and Community Development, 2019), https://www.hcd.ca.gov/community-development/housing-element/docs/annual_progress_report_permit_summary.xlsx. For a grade ranking of cities by RHNA performance, see Nikie Johnson and Jeff Collins, “Report Card: California Cities, Counties Failing Again on Affordable Housing Goals,” Orange County Register, January 31, 2021, https://www.ocregister.com/2021/01/31/report-card-california-cities-counties-failing-again-on-affordable-housing-goals/.
- 9Central Business District Coordinates Dataset (2013), distributed by Daniel Hartley, https://www.danielaaronhartley.com/.
- 10These figures are based on 2021 American Community Survey 5-year estimates.
- 11For greater detail on notable zoning surveys, see footnote 4 in Stephen Menendian et al., "Single-Family Zoning in the San Francisco Bay Area: Characteristics of Exclusionary Communities," (Berkeley, CA: Othering & Belonging Institute, 2020), https://belonging.berkeley.edu/single-family-zoning-san-francisco-bay-area.
- 12See report the paragraphs that contain footnotes 5-9 in the section “Difficulties with Zoning Research and Limitations of Existing Zoning Datasets” in Menendian et al., "Single-Family Zoning in the San Francisco Bay Area: Characteristics of Exclusionary Communities," (Berkeley, CA: Othering & Belonging Institute, 2020), https://belonging.berkeley.edu/single-family-zoning-san-francisco-bay-area. For an example of a report presenting zoning figures using the ACS sampling, see: Western Economic Services LLC, 2015 Suffolk County: Analysis of Impediments to Fair Housing Choice, (Suffolk County Department of Economic Development and Planning, 2015), 39, https://suffolkcountyny.gov/Portals/0/formsdocs/ecodev/Community%20Development/AI%20final%20draft%202015.pdf?ver=2015-10-22-115354-200. As part of the research we conducted for this report, we compared the ACS sampling of the percentage of single-family residential units in the greater LA region with our manually collected zoning data. Given that the unit used for the ACS survey is in housing units as built, the results are very different from ours where we used the unit of residential land as zoned. Here is a link to the scatterplot, which illustrates the difference, and should be a warning to researchers relying on such shortcuts.
- 13Menendian et al., “Single-Family Zoning in the San Francisco Bay Area: Characteristics of Exclusionary Communities," citing Moira O’Neill, Giulia Gualco-Nelson, and Eric Biber, Comparing Perceptions and Practice: Why Better Land Use Data is Critical to Ground Truth Legal Reform, (Berkeley, CA: The Terner Center for Housing Innovation, 2019), https://ternercenter.berkeley.edu/blog/comparing-perceptions-land-use-data.
- 14Sara C. Bronin, “Zoning by a Thousand Cuts: The Prevalence and Nature of Incremental Regulatory Constraints on Housing,” Cornell Journal of Law and Public Policy (2021): 23, https://papers.ssrn.com/sol3/papers.cfm?abstract_id=3792544.
- 15For planned development and specific plan zones where the municipal ordinance does not detail the intent and purpose enough for us to classify the entire zone, we used the standardized land use class from SACOG to categorize the parcels.
- 16The approach used in the present study differs slightly from our Bay Area single-family zoning study mentioned earlier. In our Bay Area report, mixed-use commercial zones were categorized as part of the “Non-residential” category if the zones were dominated by commercial uses regardless of whether residential uses are allowed. In our present study, commercial mixed-use zones are classified as “Other residential” if these zones permit residential uses according to the city ordinance, regardless of the dominant uses as suggested by the built environment. The rationale behind this divergence is our intention for the results in the present study to reflect the zoning code text even more directly, instead of basing it on the built environment, as was the approach we used in a few ambiguous mixed-use zones in our Bay Area study. We do not believe that this significantly changes the overall results or the comparability of the maps, but we note it nonetheless.
- 17Esri, “ArcGIS Hub”, ArcGIS Hub, accessed July 8, 2022, https://hub.arcgis.com/search.
- 18See, for example, Bronin et al., Connecticut Zoning Atlas, https://www.desegregatect.org/atlas.

