Learn to build a world where everyone belongs. Take free classes at OBI University.   Start Now

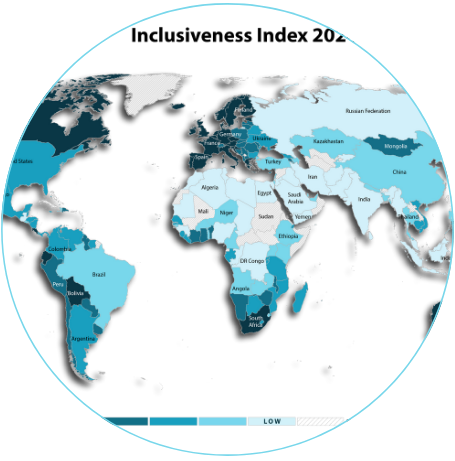
The Othering and Belonging Institute’s “Inclusiveness Index” examines the degree of inclusivity experienced by marginalized groups across the globe and within the United States. Our annual index ranks states and countries in absolute and relative terms using a variety of indicators. Our instrument is unique in striving to gauge inclusivity on its own terms rather than as part of a more general assessment of group well-being, wealth or economic conditions. We feel it is important to measure inclusiveness distinctly from other measures or indices of well-being.

We operationalize this definition of “inclusivity” by focusing primarily on the degree of institutional inclusion and protections extended to vulnerable groups across salient social cleavages, such as gender, race, ethnicity, religion, sexual orientation, and (dis)ability. Our index focuses on social groups rather than individuals, emphasizing the kind of marginality that results from social identities and group membership.

Watch our Inclusiveness Index team present the 2022 results and demonstrate the interactive table below:

The indicators and data sources we draw on to construct our index and gauge inclusivity are described on this page, but we recognize that many aspects of inclusivity are not captured by current data sources, and that some indicators or measures are not consistently or regularly collected in a way that would permit their incorporation into this Index. A complete description of all data sources used and a matrix of inputs can be seen in our methodology section.

This research initiative, now in its 9th year, is presented as an interactive web-based tool rather than a formal report. We are hopeful that this approach, adopted in 2021, will allow users to better understand the inputs and drivers of individual state-based rankings and glean deeper insights into the dynamics of inclusivity. Prior to 2021 we published this index in traditional reports, which are still available for download for the years 2016-2020 as PDFs. 

The individual state rankings and scores are displayed on the table as well as the social group rankings. By clicking individual states, you may view more details about the indicators composing the index score, as well as how those values have changed over time. By clicking different group headings, you may also re-rank the index for that social group. These features should help users more easily understand the rankings than was possible before.

In addition to assessing how inclusive various societies are, the Inclusiveness Index serves as a diagnostic tool. It helps us identify places and societies that are improving, in terms of developing a more inclusive polity and set of institutions, and those places where societies are fracturing and becoming more divided along these lines. We encourage you to use our Index as a starting point for your own investigation, rather than as the final word.

For that reason, we caution that our rankings are not the definitive assessment of any national or state performance. Rather, they are intended to spark a conversation and generate further inquiry into how and why some places, communities, and nations are more inclusive than others.

Please be sure to send us your suggestions, feedback, and ideas at belonging@berkeley.edu. For media inquiries email marcabizeid@berkeley.edu.

Additional information about this project, including past reports and downloadable data files, is available at belonging.berkeley.edu/inclusivenessindex.

To cite to this index, we recommend:

Stephen Menendian, Elsadig Elsheikh, Samir Gambhir, and Eve Liao, 2024 Inclusiveness Index (Berkeley, CA: Othering & Belonging Institute, 2024), https://belonging.berkeley.edu/inclusiveness-index.

Acknowledgments:

We would like to thank Marina Blum and Shahan Shahid Nawaz for their significant contributions to this project.