BERKELEY, CA: UC Berkeley's Othering & Belonging Institute on Wednesday released a sophisticated new tool that measures the progress and/or regress for Black Americans in recent decades in 15 areas, including in education, wealth accumulation, several health-related areas, and other critical life outcomes.
The Racial Disparities Dashboard, as we've named it, provides a simple and illustrative set of interactive tools that allow researchers, journalists and other interested people to easily identify areas where Black Americans have made progress or are faring worse compared to white Americans over the five decades spanning 1970 to 2020.
Among the standout findings, it shows that Black Americans have made big strides in education, voting, and reduction of poverty rates, but remain vastly unequal or have gotten worse in maternal mortality, incarceration rates, wealth accumulation, and homeownership.
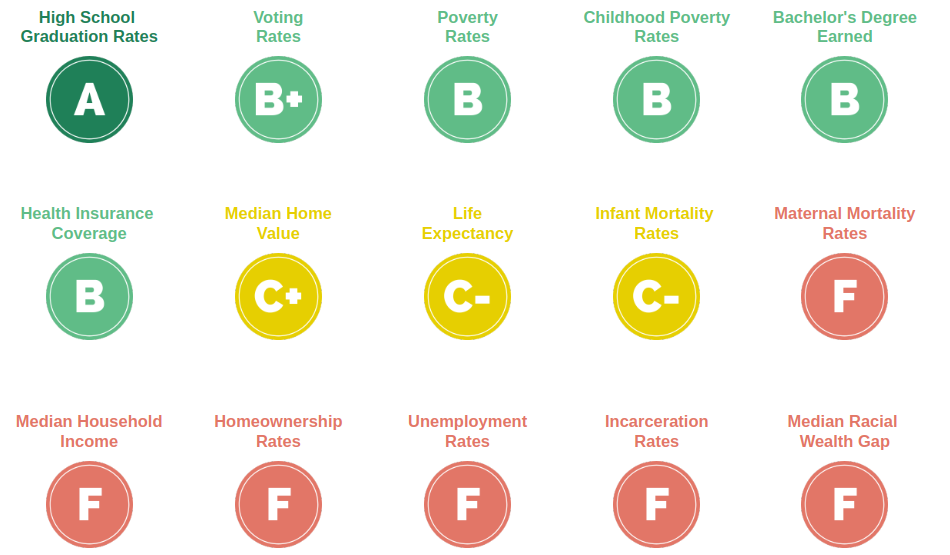
The dashboard assigns grades to each area based on multiple factors, including whether or not the disparity has increased or decreased over that period, and if the overall condition for both groups has improved or gotten worse. The grades are not an evaluation of current performance, but of change over time.
For instance, the area of high school graduation rates received an A in the report card section of the dashboard, becoming the highest scoring of the 15 indicators measured in the dashboard.
This is due to the fact that the difference in Black and white high school graduation rates has almost entirely diminished over that period (from a disparity of 23.7 percent in 1970 to 1.9 percent in 2020), while graduation rates overall have increased substantially over the period (from 33.7 percent for Blacks and 57.4 for whites, to about 90 percent for both).
The grading system also means that it is possible for a racial disparity in a certain area to remain more or less the same, but still receive a failing grade since the overall condition worsens.
Incarceration rates are a prime example of this. The ratio of Black-to-white incarceration relative to population size got a little worse, but remained at about 5-to-1 from 1970-2020, while the incarceration rates for Blacks and whites increased by about 11 percent for each group.
The dashboard complexifies the story of racial progress in the United States, revealing both the good and the bad. The data compiled and illustrated on the Racial Disparities Dashboard shows that racial inequality is neither a persistent and insurmountable problem, nor is it particularly optimistic.
As was already suggested, disparities can decrease while the overall problem increases, both can get worse, or both can get better. Each area can be studied individually to understand why the situation is what it is.
One of the goals of this project is to provide a one-stop-shop for researchers who study racial inequality and produce policy papers to suggest remedies to it. All the data used to produce the Dashboard is available for download on the page.
For the time being the Dashboard only shows data for Black and white Americans, but the project may expand in the future to include more racial groups and other categories of people.
Users can watch this short how-to video that provides a general overview of the project and showcases its different interactive functions.
Media Contact
Marc Abizeid
marcabizeid@berkeley.edu
###

