
Project Summary1
The Roots of Structural Racism Project was unveiled in June 2021 after several years of investigating the persistence of racial residential segregation across the United States. Among the many components included in this project are the national segregation report (below) which contains startling findings about the intensification of racial residential segregation in recent decades; an interactive mapping tool that illustrates the level of segregation in every city, region and neighborhood in the country; a collection of tables which list cities and metropolitan regions by various measures of segregation and political polarization; nine city profiles noteworthy for their levels of segregation or integration; and a literature review featuring dozens of local city histories. All of these components can be accessed using the navigation menu on the right-hand side of this page.
This project spawned out of a multi-part report series on segregation focused on the San Francisco Bay Area we published from 2018 to 2020, and which informed efforts by the Berkeley city council in February 2021 to reconsider exclusionary zoning. We hope this new national project will be useful to housing justice advocates, researchers, lawmakers, and journalists across the country working towards integration.
Key report findings
- Out of every metropolitan region in the United States with more than 200,000 residents, 81 percent (169 out of 209) were more segregated as of 2019 than they were in 1990
- Rustbelt cities of the industrial Midwest and mid-Atlantic disproportionately make up the top 10 most segregated cities list, which includes Detroit, Cleveland, Milwaukee, Philadelphia, and Trenton
- Out of the 113 largest cities examined, only Colorado Springs, CO and Port St. Lucie, FL qualify as “integrated” under our rubric
- Neighborhood poverty rates are highest in segregated communities of color (21 percent), which is three times higher than in segregated white neighborhoods (7 percent)
- Black children raised in integrated neighborhoods earn nearly $1,000 more as adults per year, and $4,000 more when raised in white neighborhoods, than those raised in highly segregated communities of color
- Latino children raised in integrated neighborhoods earn $844 more per year as adults, and $5,000 more when raised in white neighborhoods, than those raised in highly segregated communities of color
- Household incomes and home values in white neighborhoods are nearly twice as high as those in segregated communities of color
- Homeownership is 77 percent in highly segregated white neighborhoods, 59 percent in well-integrated neighborhoods, but just 46 percent in highly segregated communities of color
- 83 percent of neighborhoods that were given poor ratings (or "redlined") in the 1930s by a federal mortgage policy were as of 2010 highly segregated communities of color
- Regions with higher levels of racial residential segregation have higher levels of political polarization, an important implication in the context of gerrymandering and voter suppression
- The most segregated regions are the Midwest and mid-Atlantic, followed by the West Coast
- Southern states have lower overall levels of segregation, and the Mountain West and Plains states have the least
I. Introduction
In 2020, disparate rates of infection and deaths from the Covid-19 pandemic and a series of shocking police encounters captured on video, culminating in the brutal murder of George Floyd by the Minneapolis police, prompted what media organizations labeled “a National Reckoning on race.” A greater portion of the American public awakened to the fact that too many people of color were disadvantaged in ways that seemed to shape life chances and overall well-being. Demonstrations supporting the Black Lives Matter movement occurred not only in large metropolitan regions, but spread to many predominantly white and rural counties across the country. Books on race and racism shot up best seller charts, polls indicated a groundswell of public support for race-conscious policy reforms, and the term “systemic racism” entered the mainstream lexicon.2
Racial disparities in health and well-being, policing and the criminal justice system, schools and universities, corporations and labor markets, and in neighborhoods and housing are stark and difficult to ignore. Whereas such disparities may once have been attributed to differences in intelligence, motivation or effort, the surge in anti-racism activism and reading has helped engender greater awareness of the structural inequities that underpin these outcomes. Journalists have probed these phenomena more deeply than in the past, revealing the circumstances and conditions that contribute to these outcomes or the subtle differences in treatment or care that create stunning inequities.3
Despite these efforts, however, there remains a surprising lack of appreciation for the centrality of racial residential segregation in forming and sustaining these disparities. It is residential segregation, by sorting people into particular neighborhoods or communities on the basis of race, that connects (or fails to connect) residents to good schools, nutritious foods, healthy environments, good paying jobs, and access to health care, clinics, critical amenities and services. Aggressive “broken windows” policing practices target racially and economically isolated Black and Brown neighborhoods, while jobs and the tax dollars flow to white communities, leaving crumbling infrastructure, poisonous water, predatory financial institutions, and food deserts behind.4 For these reasons, and many more, racial residential segregation remains the “lynchpin”—the deep root cause—that sustains systemic racial inequality.5
Given the centrality of racial residential segregation to the reproduction of racial inequality—not just as a fact of history, but in contemporary terms—there is a remarkable ambivalence about this fact, and what to do about it, and not just among those who oppose racial justice advocacy or stand on the sidelines in such policy debates. For many middle-aged African Americans, the short-lived experiment in educational desegregation was a mixed bag—an infusion of resources and expansion of educational opportunities at the expense of community, more micro-aggressions (or worse), and fewer caring and committed teachers and administrators invested in their future.6 And desegregation proved fleeting. White hostility and unrelenting opposition to integration produced bursts of violence even in northern cities like Chicago and Boston, accelerating white flight, which further undermined the project of federally mandated desegregation, long before courts largely abandoned this effort in the early 1990s.7
And unlike school desegregation, the nation never embarked upon a national project to integrate neighborhoods, let alone declared an unambiguous commitment to that goal. There has never been a Brown v. Board of Education-like decision for housing, mandating a deliberate, proactive effort to integrate neighborhoods. Even if there had been such efforts on a wide scale, integrating neighborhoods was always going to be more difficult than integrating schools.8 No matter how unpopular, students could be assigned to different schools in a district or region by a central public authority under the mandate of federal courts, and bused accordingly. But there is no comparable institution or authority that has the power to compel the integration of neighborhoods and communities.
Instead, our fair housing laws are predicated on the assumption that simply prohibiting discrimination would gradually unwind decades of deliberate segregative policy and ultimately produce residential integration. This assumption proved fallacious. The Fair Housing Act of 1968, the final legislative achievement of the civil rights movement, prohibited discrimination in housing (sale, rental, lease, etc.) on the basis of race, and provided victims of discrimination with a tort remedy as well as empowered the federal government to bring suits on behalf of aggrieved parties.9 Indeed, the Act helped break down barriers to integration and reduce the prevalence of housing discrmination, but it was comparatively weak in terms of proactively integrating existing segregated communities.10
Nonetheless, following the passage of the federal Fair Housing Act in 1968, residential integration increased significantly between 1970 and 1980,11 to such an extent that many reasonable observers felt that the residential patterns established in the early and middle decades of the twentieth century might actually fade away in time. Previously all-white neighborhoods changed complexion as non-white neighbors arrived, and vice versa.12 Although progress incrementally slowed each subsequent decade, the in-migration of people of color into the suburbs—especially between 1990 and 2000—seemed to suggest a different and more hopeful racial trajectory, such that two economists declared the “End of the Segregated Century.”13 The downward trend of residential segregation, at least as popularly measured, seemed to portend eventual widespread residential integration. But as we'll explain later in this report, these encouraging observations turned out not to reflect the actual dynamics of what was occurring. In most regions, segregation was in fact increasing.
Aside from public health and epidemiology, one arena where policymakers, parents, and scholars speak frequently and unabashedly about the harms of segregation is in the context of education, where sharp disparities in educational outcomes and demographic profiles are stark and persistent.14 Schools have gradually re-segregated in the 65 years since Brown v. Board of Education was decided.15 The problem today is that our nation’s public schools replicate the demographic profiles of the communities and neighborhoods they serve.16
Given the failures of integration, or, more accurately, the failure to integrate (and sustain it), many anti-racism advocates evince ambivalence about integration itself, or carefully elide the issue, focusing instead on the symptoms, such as abusive policing, inadequate health care, and underperforming schools. For example, in his popular treatise How to be an Antiracist, Ibram X. Kendi writes, “What really made the schools unequal were the dramatically unequal resources provided to them, not the mere fact of racial separation.”17 He’s right on this point, of course, but his implied solution, to simply equalize resources, is woefully insufficient as a comprehensive remedy, for reasons we will show.
It is unlikely that we can ever close out racial disparities let alone significantly improve life outcomes for racially marginalized people in a racially segregated society. ... Racial residential segregation so effectively sorts people across space and bundles vitalizing resources that no redistribution plan can ever match the swift efficacy of the underlying mechanism.
This report refocuses attention on the roots of structural racism: racial residential segregation. First, we explain how segregation functions not only to perpetuate and sustain racial inequality, but as a widespread and surprisingly commonplace global driver of inter-group inequality. By illustrating its near universality as an inequity-causing mechanism, we can better appreciate the continuing function of racial segregation in American society today. To that end, we briefly canvass the social scientific literature on the harms of racial residential segregation in the realms of public health, education, and economics.
Second, we will show how racial residential segregation is much more pervasive and endemic than we generally acknowledge. Not only are most of our major metropolitan regions and cities highly segregated, but we find that nearly 81 percent American cities and metropolitan regions are more segregated today than they were in 1990, after several decades of federal policy applied to this problem.
Part of the failure to recognize this is a byproduct of overreliance on inadequate measures of segregation that are no longer capable of helping us gauge the extent of segregation in an increasingly diverse and multi-racial society. Racial residential segregation has evolved during the last century, but our prevailing ways of understanding and describing it are stuck within a twentieth century paradigm.
To address these problems, we apply more recently developed measures and gauges of segregation and introduce a functionally new measure of racial residential integration. We describe regional differences in segregation and identify the most and least segregated cities in the nation, and flag places that have changed the most in recent years, either becoming less segregated or moreso.
Third, we present key findings and insights from an analysis of our observed measures of racial residential segregation. We find consistent and strong correlations between the degree of racial residential segregation and key life outcomes, such as poverty rates, home values and rents, educational achievement, life expectancy, economic mobility, and more. For example, we find that neighborhood poverty rates are highest in segregated communities of color (21 percent), which is three times higher than in segregated white neighborhoods (7 percent).
We compare highly segregated white neighborhoods to highly segregated Black and Latino neighborhoods and integrated neighborhoods, as well outcomes for different-race residents, to demonstrate the structural role of racial residential segregation in shaping access to vitalizing resources. For example, we find that Black children raised in integrated neighborhoods earn nearly $1,000 more per year as adults than those raised in highly segregated communities of color. Latino children raised in integrated neighborhoods earn $844 more per year as adults than Latino children raised in highly segregated communities of color.
We also describe the relationship between historical redlining and contemporary patterns of segregation, suggesting the enduring effects of government policy nearly a century ago. We also illustrate the relationship of racial residential segregation and political polarization with implications for the process of political districting.
Finally, we introduce a sophisticated and powerful new mapping tool that is capable of more vividly illustrating the extent and degree of racial residential segregation in our nation and illuminating the extent of the problem. This interactive tool can be used to observe racial residential segregation in any community at any level of geography (neighborhood, city, region), and to see changes over time.
It is our hope that this tool and the granular data made available by this project will engender not only greater awareness of the problem of segregation at the local level, but will facilitate the creation of local histories and deeper knowledge that can support local advocacy and policy change.18 For that reason, we supplement our mapping tool with a repository of city snapshots and local histories to serve as examples, educational tools and inspiration.
II. The Function and Effects of Segregation
Second only to outgroup violence, segregation is the oldest and most ubiquitous source of inter-group inequality. From the most ancient human civilizations to the present, segregation has been used to separate people on the basis of race, ethnicity, sex, class, profession, caste, and religion in public and private realms. In contemporary societies, where violence and discrimination are either outlawed or otherwise verboten, segregation is the primary mechanism for controlling access to resources, spaces and people. Segregation undergirds a vast array of resource disparities, tangible and intangible.19
It is important to emphasize at the outset, however, that racial segregation, like racial violence or discrimination, is generally not established, justified, or propounded on the basis of hatred, animus or invidiousness. Rather, it is usually advanced on the basis of peace, security, social harmony, and order, and sometimes on the basis of purity, religious or otherwise. Thus, the US War Department placed Japanese Americans into internment camps on the ground that they were a security threat to the United States during World War II;20 the California Department of Corrections segregated inmates on the basis of race ostensibly to tamp down inter-group violence within prisons as recently as 2005;21 and, ancient European kingdoms isolated Jewish people into “ghettos” ostensibly to protect Christian religious purity.22
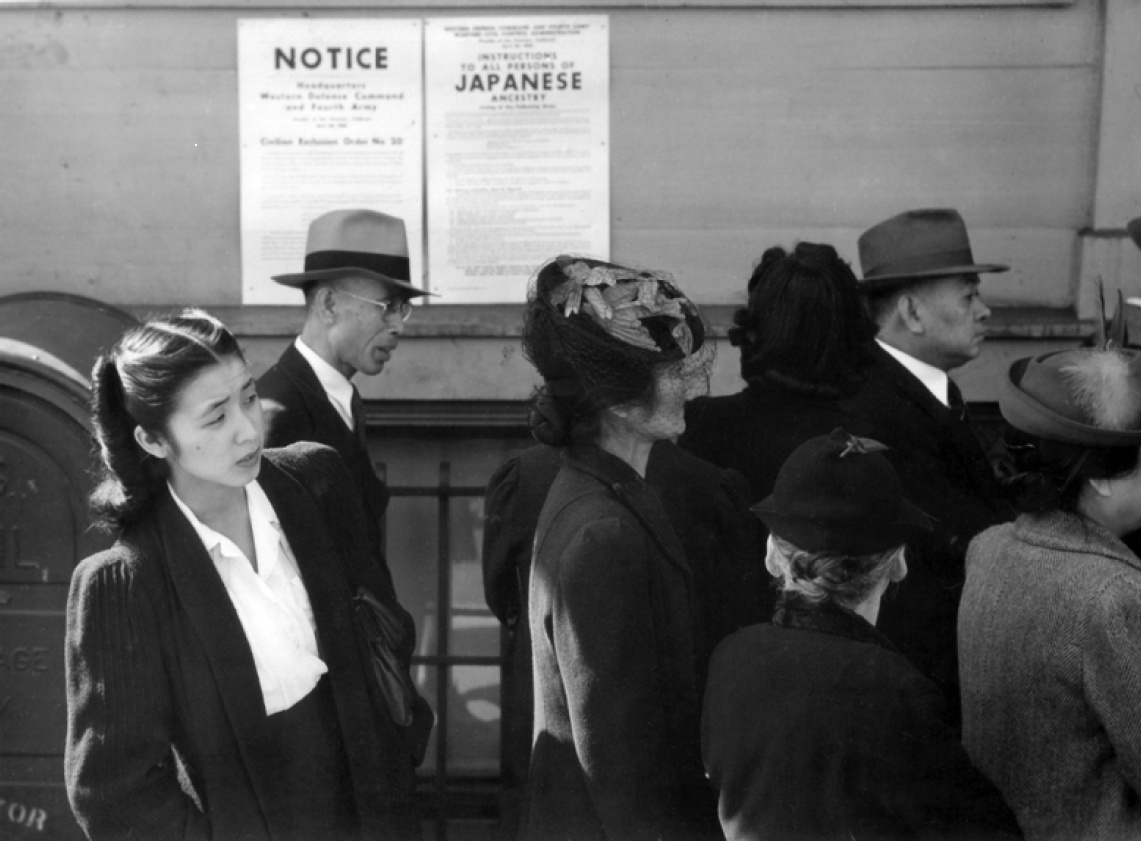
Residents of Japanese ancestry pictured in front of posters with internment orders as they register for evacuation and housing, in San Francisco, in April 1942. (Library of Congress/Wikicommons)
To better appreciate the universality of segregation as a mechanism of inequality, briefly consider cases of segregation and their effects in contexts aside from race and outside of the United States: religious segregation in Northern Ireland, sex segregation in Saudi Arabia, and caste segregation in India. Through these cases, American readers will better appreciate the actual function of segregation, before we present a summary of findings on the harmful effects of American racial segregation.
India’s ancient caste system deems the lowest caste, Dalits, as “untouchables.”23 This is not merely a rhetorical flourish, but a literal article of faith among many Hindus. In many villages, Dalits are forbidden to drink from upper-caste wells or to worship at their temples.24 In 2020, a 17-year-old Dalit was shot and killed for entering a temple “belonging” to an upper caste.25 In many ways, this kind of caste-based segregation is similar to that of Jim Crow, which restricted access to public accommodations for Black Americans.
Saudi Arabia’s “Guardianship” system created an interlocking set of rules that segregates women from men.26 Until very recently, these rules not only prohibited women from driving or traveling outside the country without a male family member’s explicit permission,27 they also restricted access to public spaces, such as movie theaters or concerts, and provided separate seating areas and entrances for men and women in restaurants and other public venues.28 Again, this kind of public accommodations segregation resembles elements of Jim Crow, which provided separate seating areas in restaurants, courts and theaters, and on public transit.
For many decades in the twentieth century, Northern Ireland was a site of intense violence between Irish Catholics and “Unionist” Protestants. The conflict was dubbed “The Troubles.”29 In the course of this conflict, as a result of violence and enmity, neighborhoods in Northern Ireland became increasingly religiously segregated, with Catholics moving to predominantly Catholic neighborhoods and Protestants moving to more heavily Protestant neighborhoods.30 These neighborhoods provided differential access to critical resources, such that today, Irish Catholic life expectancy there is 74.1 years compared to 81.7 for Protestant men.31 Protestant women live 4.7 years longer than Catholic women.
Racial residential segregation in the United States is associated with similar disparities in life outcomes. In the San Francisco Bay Area, for example, we found that life expectancy is more than five years greater in white neighborhoods (84 years) than in highly segregated Black/Latino neighborhoods (79 years).32 By virtually any measure of well-being, from employment, income, educational attainment, access to health care and a healthy environment, residential segregation based upon group identity is a driver of unequal outcomes.
One of the fundamental problems in our world is the divide between people who want a community built around a single, primary salient identity and those who want to live in diverse, pluralistic communities. The exclusionary enclave sentiment undergirds anti-immigrant and xenophobic sentiment worldwide, but it is also rampant within societies, including in the United States. This is the essence of segregation.
Perhaps the most extensive research on the harmful effects of racial residential segregation is in the field of public health.33 Racial residential segregation has been linked to infant mortality,34 asthma,35 cardiovascular disease,36 diabetes,37 hypertension,38 obesity,39 and many other health conditions and illness,40 including Covid-19 infections.41 Segregated communities of color often have less access to grocery stores, child care facilities, and other important neighborhood resources, and are more likely to have hazardous waste facilities in close proximity.42 Segregation disproportionately exposes Black communities to environmental pollutants and isolates Black populations from essential health resources such as improved recreational spaces, quality pharmacies, clinics and hospitals, and healthy food options.43
The harms of segregation are well documented in the educational context as well.44 Segregated schools are associated with teacher turnover and lower teacher quality, larger class sizes, fewer extracurricular offerings, lower test scores and graduation rates.45 In contrast, integrated schools have more credentialed teachers, lower drop-out rates, and greater capital investments into school buildings and infrastructure.46
A recent study of schools found that racial segregation is strongly associated with the magnitude of achievement gaps in third grade, and with the rate at which gaps grow from third to eighth grade. The study found that racial segregation appears to be harmful because it concentrates minority students in high-poverty schools, which are, on average, less effective than lower-poverty schools.47
In a landmark longitudinal study of Black and white students in desegregated schools in the southern United States, Berkeley professor Rucker Johnson found that desegregated schools greatly improved educational outcomes for Black children with no corresponding decrease in outcomes for white children.48 He found, for example, that at least five years spent in desegregated schools yielded an estimated 25 percent increase in annual earnings and increased annual work effort of 195 hours for Black boys. He found that each additional year of attendance in desegregated schools increased Black men’s adult annual earnings by roughly 5 percent, increased their wages by 2.9 percent, and led to an annual work effort that was 39 hours higher. This reduced their chances of poverty as adults as well. Furthermore, attending a desegregated school as a child reduced by 14.7 percent the probability of spending time in jail by age 30.
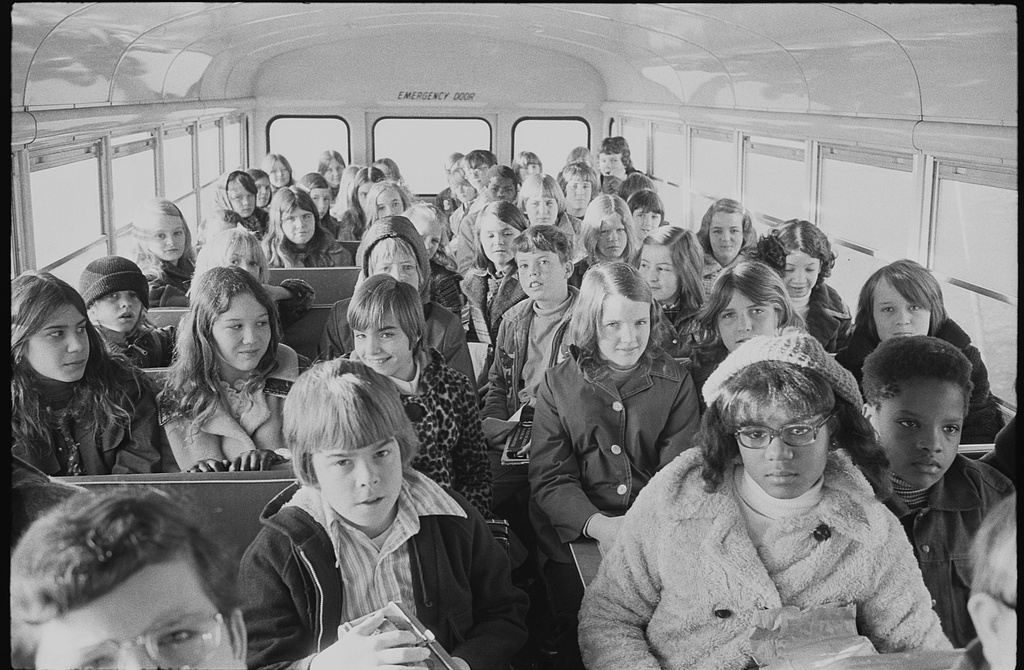
Black and white school children on a school bus, riding from the suburbs to an inner city school in Charlotte, North Carolina, in February 1973. (Library of Congress)
The economics literature on racial residential segregation also firmly establishes the harmful effects on economic and social mobility and other economic outcomes. Higher levels of racial segregation are associated with lower median and per capita incomes for Black and Latino Americans.49 It is also associated with unemployment and idleness.50 Racial residential segregation is also strongly associated with disparities in lending practices and access to credit.51
It is an uncomfortable truth for anti-racism advocates, but one that we must confront and acknowledge: it is unlikely that we can ever close out racial disparities let alone significantly improve life outcomes for racially marginalized people in a racially segregated society. Compensatory schemes that redistribute resources can help to ameliorate these inequities, but racial residential segregation so effectively sorts people across space and bundles vitalizing resources that no redistribution plan can ever match the swift efficacy of the underlying mechanism.52
Moreover, even if it could eliminate some disparities, such efforts would fail to remedy every element inside the bundle. For example, even if redistribution could match the inequity in school funding, it might fail to do so in terms of jobs. But even if it could do so in terms of jobs, it might fail to do so in terms of health care or providing a healthy environment. And even if it could do that, it might not in terms of social capital and communal fiscal stability. This is why racial residential segregation is the lynchpin of racial disparities in the United States.
III. A Fresh Look at Racial Residential Segregation
When we think of segregation, we may think of Jim Crow lunch counters or race-based pupil assignments. While the segregation of public accommodations was the primary form of segregation in the South, in the North and West, segregation was accomplished primarily through residential patterns—by law and violence that prohibited Black movers from entering any but a small number of tightly bound neighborhoods. The federal government reinforced racial residential segregation through policies such as redlining and other federal mortgage guarantees, which were promulgated locally and spread through the private market.53 Although we dismantled much of Jim Crow by the late-1960s, northern-style residential segregation overtook the country, even as most neighborhoods diversified.
By prohibiting discrimination in housing on the basis of race, the 1968 Fair Housing Act began to open up previously all-white neighborhoods to people of color. Despite these prohibitions, our growing diversity and the decline in single-race communities, racial residential segregation remains a stubborn and persistent fact of life. Today, most white children live in segregated, white communities, and most Black children, similarly, live in segregated, Black neighborhoods.54 Racially identifiable communities are everywhere, and students and families are more racially isolated than they would like to be, even controlling for income, wealth, and demographic preferences.55
Schools have gradually re-segregated in the 65 years since Brown v. Board of Education was decided. The problem today is that our nation’s public schools replicate the demographic profiles of the communities and neighborhoods they serve.
The prevailing narrative around gradual residential integration relies primarily on a measure of segregation that is misleading and flawed in many ways, but chiefly because it focuses on the binary of Black-white segregation. This widely used measure of Black-white segregation indicates a relatively significant decline in segregation between 1970 and 1980, with more modest declines between 1980 and 1990, 1990 and 2000, and 2000 and 2010, with the 2010 measures as either high, moderate-high, or moderate for virtually every major metropolitan area in the United States.56 So, although this traditional measure of segregation reflects gradual declines in overall levels of segregation, for many, if not most, regions of the country, overall Black-white segregation remains high or moderately high.
One reason for the gradual decline in Black-white segregation (from extremely high to merely high or moderately-high) is the presence of anti-discrimination laws and their enforcement. As a consequence of the passage of the Fair Housing Act, there are far fewer homogeneous all-white (or all-Black) communities in the United States any more. At least some members of different races have been able to move into previously single-race communities. But a relatively small number of different-race residents should not obscure the fact that racially isolated neighborhoods are still commonplace. The fact that these neighborhoods are no longer entirely same-race does not mean that they are truly integrated, just that the ramparts of racial exclusion are no longer impermeable.
A related problem with traditional perspectives and measures of racial residential segregation is that the form that racial residential segregation takes has evolved in critical respects. Whereas racial segregation once separated people of different races into different neighborhoods in the same cities (such as different neighborhoods in Oakland, Chicago, New York, or Detroit), racial residential segregation today is more “mobile” and regional.57 People of color have greater freedom to move to different communities than they did several generations ago, but those neighborhoods and communities are more likely to be struggling, either declining urban areas or struggling inner-ring suburbs or far-flung exurbs. In this sense, people of color are no longer locked into a small number of neighborhoods, but are channeled into certain types of often disadvantaged communities, like Ferguson, Missouri, or Vallejo, California.
As a result, racial residential segregation today occurs between cities and places as much as it does between neighborhoods within the same cities. This is what is meant by “regional” segregation: racial residential segregation is more inter-municipal than intra-municipal. Thus, the simple patterns of segregation that defined metropolitan regions in the second half of the twentieth century, such as the “Chocolate city, Vanilla suburb,” no longer hold.58 Segregation is more prominent between different-race suburbs today than the traditional urban-suburban divide would suggest. Measures that are more sensitive to these dynamics are needed.
Contrary to prevailing impressions of the United States, the most segregated regions are the Midwest and Mid-Atlantic, followed by the West Coast. Southern states have lower overall levels of racial residential segregation, and the Mountain West and Plains states have the least.
A more serious problem with traditional binary measures of segregation is that they fail to account for America’s growing diversity. A great paradox of racial segregation in America is that segregation persists despite the nation’s growing diversity, and also despite the fact that there are fewer and fewer places that are racially homogenous. In other words, there are far fewer all-white or all-Black neighborhoods today than there were 50 years ago. And so many of our regions and states are more diverse than they were a generation ago.
A large and growing influx of Asian and Latino residents has dramatically shifted the complexion of our racial geography nationwide, but especially in states like California, Texas, and Washington. This diversity means that simple binary measures of racial residential segregation can no longer suffice to convey a fulsome portrait of underlying conditions or patterns. Holistic measures that can account for growing diversity are needed, and they tell a very different tale.
For that reason, we employ a relatively new measure of segregation that overcomes these problems, and better accounts for America’s current diversity. This project measures segregation in a way that better accounts for Asian, Latino, and Native American populations, as described throughout. The appendix to this report contains a technical description of the various measures of segregation, and a more comprehensive explanation of our preferred measure over the alternatives. We find, for example, that many highly diverse regions in the United States are either as segregated or more segregated as of 2010 than they were in 1970 or even 1990. For example, Tucson, Arizona; San Jose, California; and Honolulu, Hawaii are cities that have overall much higher levels of racial residential segregation than would be suggested by Black-white segregation.59
Overall, we found that racial residential segregation was much greater and more pervasive than is generally appreciated. We calculated the level of segregation for every city and metropolitan region in the United States. Out of every metropolitan region in the United States with more than 200,000 residents, 81 percent (169 out of 209) were more segregated as of 2019 than they were in 1990. In most cases the increase or reduction in segregation was modest, but in some cases the changes were dramatic as indicated in Tables 1 and 2 below, which provides a list of the metropolitan areas with the greatest overall increase or decrease in segregation in that time period, and indicates racial compositional changes that may have contributed to these changes in the level of segregation.
Table 1: Top 10 Metros with the Greatest Increase in Segregation (1990-2019, Minimum 200,000 people)
Table 2: Top 10 Metros with Greatest Decrease in Segregation (1990-2019, Minimum 200,000 people)
The complete results of this analysis, indicating the change in level of segregation and racial composition for every metropolitan area from 1990 to 2019, are available here.
We also calculated a complete list of the most-to-least segregated cities and metropolitan areas in the United States (again, available on the “Tables” menu on the right hand side of the project page). The top 10 most segregated metropolitan areas are presented below in Table 3, and are generally consistent with more traditional measures of segregation.60
Table 3: Top 10 Most Segregated Metropolitan Statistical Areas (2019, Minimum 200,000 people)
Our nation’s largest cities and metropolitan areas remain highly segregated using any measure, but the rustbelt cities of the industrial Midwest and mid-Atlantic disproportionately make up the top 10 most segregated cities list, which includes places like Detroit, Cleveland, Milwaukee, Philadelphia, and Trenton. It is no coincidence that these were places where major Black Lives Matter protests occurred even before the 2020 demonstrations, and that they were also sites of major racial uprisings in the 1960s.61 These were also places where the Great Migration (1916-1970) had the strongest pull.
As these tables suggest, we find that contrary to prevailing impressions of the United States, the most segregated regions are the Midwest and Mid-Atlantic, followed by the West Coast (See Figure 1). Southern states have lower overall levels of racial residential segregation, and the Mountain West and Plains states have the least.62
Figure 1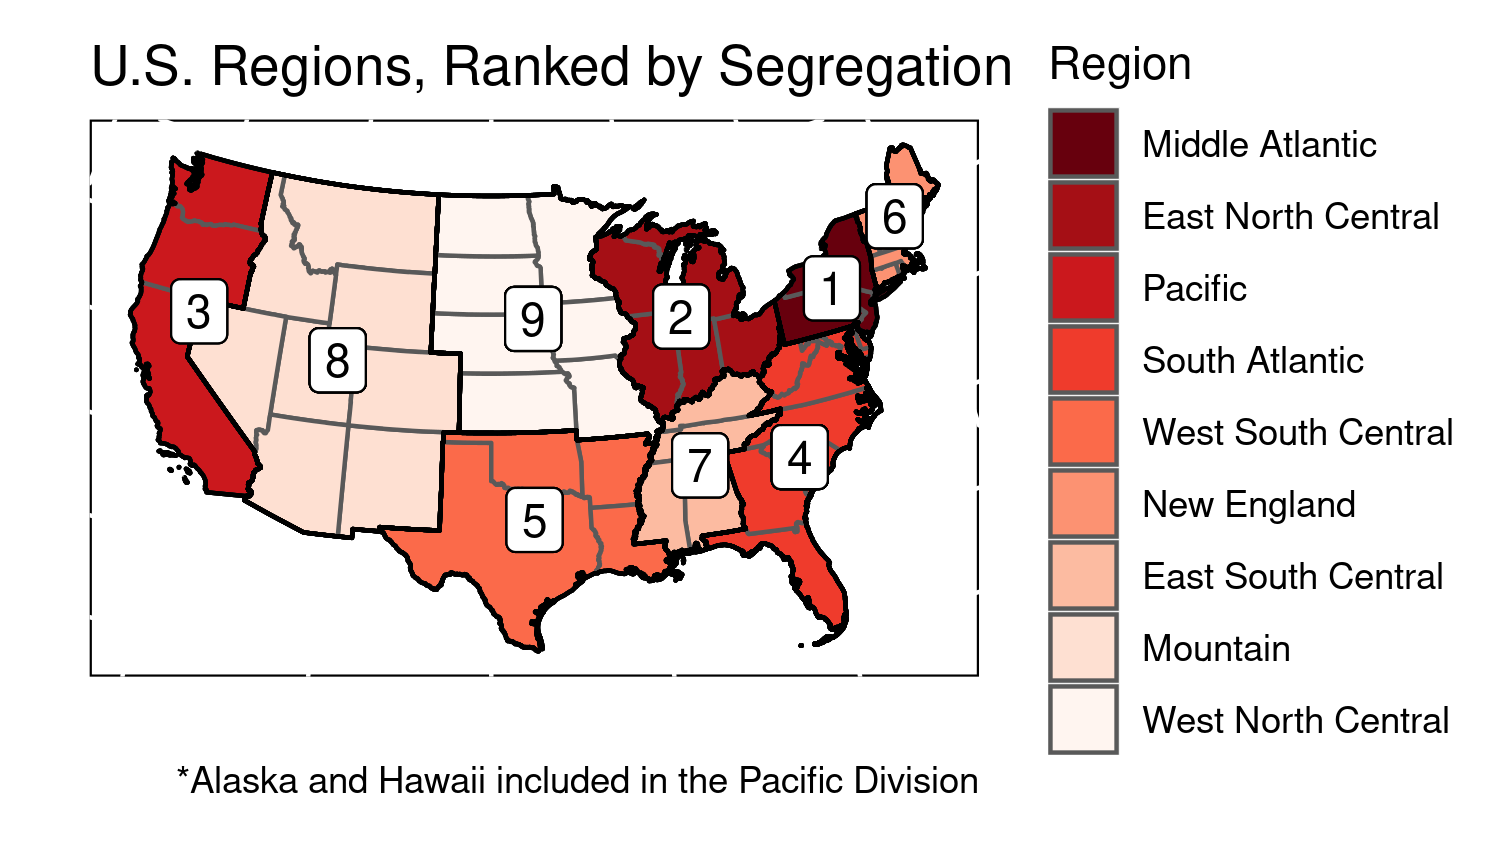
Consistent with the regional pattern, many mid-Atlantic and Midwestern cities like Scranton and Green Bay have had large increases in segregation in the last 30 years (see Table 1, above). Conversely, southern cities in states like Florida and Texas have had equally significant demographic change, but managed to reduce racial residential segregation (see Table 2, above).
In addition to using a relatively new measure of segregation, we created a functionally new measure of integration for this project that identifies places that are both diverse and have lower levels of residential racial isolation (this is also described in the Technical Appendix). Some communities and regions may appear to have relatively little racial residential segregation, but that could be because they are not very diverse. Thus, we combine diversity thresholds with our preferred measure of segregation to find places that can be truly characterized as integrated.
Although there are many integrated neighborhoods around the country, very few cities and metropolitan areas meet our definition. Out of the 113 largest cities examined, only Colorado Springs, CO and Port St. Lucie, FL qualify as “integrated” under our rubric. Similarly, out of the 221 largest metropolitan regions, only San Luis Obispo-Paso Robles, CA and Colorado Springs, CO qualify as “integrated.” Overall, the United States remains very racially segregated.
Using our preferred measures of segregation and integration, we have a clearer and more accurate view of the extent racial residential segregation around the country. Moreover, using these measures we can better understand the relationship between segregation and key life outcomes.
IV. Key Findings
Examining demographic data (income, race, etc.) and our preferred measures of segregation and integration, we find a number of apparent and sometimes startling relationships. Most prominently, we find a striking relationship between income by race and racial residential segregation. Specifically, we find that Black and Latino income is higher in more integrated neighborhoods. Poverty rates are significantly lower (14 percent compared to 21 percent) in integrated neighborhoods compared to segregated communities of color.63
Table 4 below includes a summary of our main findings, which compares conditions and outcomes in integrated neighborhoods with outcomes in highly segregated white neighborhoods and highly segregated communities of color (“POC Segregation”). Despite the strong correlations, we caution that this analysis cannot prove that racial segregation is the cause of these neighborhood outcomes, but the consistent direction of outcomes across a large set of variables along these types of neighborhoods is highly suggestive and consistent with the “neighborhood effects” literature, which attributes life outcomes to community conditions.64
Table 4: 2019 Segregation and Select Neighborhood Outcomes65, 66
The best life outcomes are found, however, in highly segregated white neighborhoods, which is consistent with a theory of “opportunity hoarding” that predominantly white cities and communities have greater resources and often have the fewest people of color living in them.67 Household incomes in these neighborhoods are nearly twice those in segregated communities of color. That income differential contributes to wealth disparities, as home values are also nearly twice as high. Even life expectancy is four years longer in these neighborhoods than in segregated communities of color.68 But critically, these neighborhoods are difficult to access: monthly rents are more than $300 and $400 per unit higher than in either integrated or highly segregated POC neighborhoods, respectively.
It is also notable that home ownership is much higher in both white segregated neighborhoods and integrated neighborhoods than in segregated communities of color. Homeowner occupancy is 77 percent in highly segregated white neighborhoods, 59 percent in well-integrated neighborhoods, but just 46 percent in highly segregated communities of color. Homeownership is a critical pathway to wealth accumulation.
We also examined economic outcomes (and rates of incarceration) for children of different races born between 1978 and 1984 across these neighborhood types (as measured in 1990).69 We found clear and consistent evidence that children raised in integrated neighborhoods had better outcomes than children raised in segregated communities of color (see Table 5).70 Black children raised in integrated neighborhoods earn nearly $1,000 more per year as adults than those raised in highly segregated communities of color. Latino children raised in integrated neighborhoods earn $844 more per year as adults than Latino children raised in highly segregated communities of color.
The best economic outcomes, however, again occurred in highly segregated white neighborhoods. Average income is substantially higher in those neighborhoods, not just for white children, but for Black and Latino children as well. Black children raised in highly segregated white neighborhoods earned nearly $4,000 more as adults than Black children raised in highly segregated communities of color. Similarly, Latino children raised in highly segregated white neighborhoods earned about $5,000 more per year as adults than Latino children raised in segregated communities of color.
Neighborhood segregation appears to affect outcomes for people of all races residing in them, not just members of certain racial groups. By shaping outcomes for all residents irrespective of race, these results reinforce our view that racial residential segregation is a structural force that allocates and distributes vitalizing resources.
Table 5: 1990 Neighborhood Segregation and Select Outcomes for Racial Groups
Although the form that racial residential segregation takes in the United States has evolved in ways described in the previous section, we nonetheless find that federal policy in the New Deal and post-war period may continue to shape those patterns. Using digitized Home Owners Loan Corporation (HOLC) city survey security maps, we analyzed the relationship between levels of segregation in our map and the designation of neighborhoods by the HOLC, an agency created during the 1930s to slow the tide of foreclosures and extend credit for home loans.71
The HOLC ranked neighborhoods as part of its survey program. Neighborhoods marked in Green (grade A) were considered “Best,” blue (grade B) were considered “Still Desirable,” yellow (grade C) were “Definitely Declining,” and red (grade D, hence the term “redlining”) were deemed “Hazardous.”72 Using the digitized HOLC security maps from the 1930s and our preferred measure of segregation, we can infer the extent to which federal policy nearly a century ago may be shaping racial residential segregation today.73
Table 6 indicates the percentage of HOLC graded neighborhoods within each level and type of racial residential segregation.74 For example, of well-integrated neighborhoods as of 2010 that were given a HOLC grade in the 1930s, 5.8 percent were graded A, 25 percent were graded B, 46.5 percent were graded C, and 22.6 percent were graded D. This shows that very few integrated neighborhoods today were given high HOLC grades.
The most important finding from the table is the evidence of the lingering effects of past governmental policy. Of the highly segregated communities of color as of 2010, only 2 percent were graded “A” in the 1930s, while 83 percent were graded either “C” or “D.” This suggests that lower HOLC grades (and by extension federal mortgage insurance policy) may have contributed to the perpetuation of racial residential segregation. The unsurprising corollary to this finding is that highly segregated white neighborhoods as of 2010 had the fewest percentage of “C” and “D” HOLC rankings and the highest percentage of “A” rankings among the neighborhood types presented. Nearly a century later, federal policy has a long tail.
Table 6: HOLC Grades by 2010 Neighborhood Segregation Type
Another issue we examined was the relationship between segregation and political polarization. Some scholars have argued that racial residential segregation may be a driver of political racial polarization, and have found evidence supporting this claim.75 For example, a recent study found that “cross-ethnic” exposure in childhood predicted political preferences decades later.76 We apply our preferred measure of segregation to investigate this issue.
Political polarization is a nuanced concept that refers not simply to partisanship or the intensity of partisan feelings, but the degree to which people gravitate to the ends of the political spectrum rather than cluster in the middle.77 Aggregate election results by themselves do not necessarily tell us the degree of political polarization that may exist (since options in general elections are essentially binary, i.e. Republican vs. Democrat), but measures of political segregation can indicate regional political polarization.
We analyzed the relationship between racial residential segregation and regional political segregation for 314 metropolitan areas, and the results are illustrated in Figure 2 below.
Figure 2: Racial Residential Segregation and Regional Political Segregation, by Metropolitan Area

Figure 2 presents our percentile rank of racial residential segregation on the vertical axis and metropolitan political polarization on the horizontal axis (see endnote for a description of our measure).78 The graph shows a strong correlation (.50). In simple terms, the greater the level of racial residential segregation, the greater the level of political polarization. Whether there is a causal relationship between the two or some deeper force explaining both is a matter of some academic interest, but one we need not resolve here.
In any case, the finding presents a very important policy implication. When racial segregation is greater, political gerrymandering—the process of drawing political districts for political advantage—may be easier. By sorting people across space within a region, racial residential segregation makes gerrymandering techniques like “packing” and “cracking” easier at the same time that racial political polarization makes race a stronger predictor of political voting patterns.79 This is yet another reason to be concerned about racial residential segregation.
V. Using our Interactive Mapping Tool
Our preferred measure of segregation and novel measure of integration is not just more revealing, it helps us present more intuitive visualizations of the reality and extent of racial residential segregation in the United States. To accompany this report, we created a new interactive mapping tool to illustrate the level of segregation for every city, region and neighborhood in the United States while also indicating the racial composition of any neighborhood selected. (There are several other, excellent mapping tools that represent educational segregation, which our map does not do).80
After clicking “begin,” the map’s default layer displays the holistic level of segregation for every city and metro area in the country using our preferred measure. Users can then either enter an address or city into the search bar or use the zoom function to locate any specific area of the country and directly observe the level of segregation that exists there, at the level of census tract, or neighborhood.81 The color scheme and legend indicate the level of segregation (or integration). When selecting a census tract on the map, the chart on the left-hand side of the map provides the racial composition of the tract, the tract number, and the specific segregation value and percentile.
For example, take a look at the Detroit metropolitan region, one of the most segregated regions in the country (99th percentile of segregation). Blacks and Latinos are heavily over-represented (89 percent of the city compared to 27 percent of the metro in 2010), and highly isolated within the city (see Figure 3 below). The surrounding cities within the region are often either more integrated and representative areas like Eastpointe City (48th percentile), or highly white segregated areas like Livonia City (90 percent white, 77th percentile).82
Figure 3: Detroit
Not only does the interactive map indicate the level of racial residential segregation for every neighborhood in the United States, but also for different census years (as well as for different measures of segregation, which we describe in the Technical Appendix to this report). The default left-hand menu allows you to view the level of segregation for any place in 1980, 1990, 2000, 2010, or 2019 (2020 census data has not yet been released at the time of this publication).83 Using the slider, you can compare how segregation has changed in your own community or any other community of interest.
For example, if we look at a neighborhood in the French Quarter of New Orleans, we find that the level of segregation is “moderate” as of 2010, our default year. But if we use the slider, we find that the level of segregation for that neighborhood was “low” in 1980 and became more segregated in the intervening years (peaking in 2000).
Users may also switch between different measures of segregation and select any corresponding geography they would like to retrieve scores or values for those measures (see the Technical Appendix for a description of measures). Users may also use the slider to move forward to backward in time for their preferred measure.
In addition to allowing users to directly observe the level of racial residential segregation for any place in the United States since 1980, we have developed nine city snapshots that briefly highlight cities in the country that have 1) most rapidly integrated over this time period or 2) remain the most stubbornly segregated places in the country. Simply click the “storybook” icon to read the city snapshot. We have provided snapshots of Chicago, New Orleans, Detroit, Boston, Aurora (CO), Colorado Spring (CO), Inglewood (CA), Killeen (TX), and New York City.
A great paradox of racial segregation in America is that segregation persists despite the nation’s growing diversity, and also despite the fact that there are fewer and fewer places that are racially homogenous.
It is our hope that this tool can be used by local grassroots organizations and fair housing advocates to support fair housing litigation and policy reforms, as well as the development of local histories. With the underlying data (both segregation and racial composition) made readily available to any user for free, it should be relatively simple for fair housing advocates to input key data points to support arguments on behalf of integration.
To aid in the development of local histories, we have created a backend database of reports, articles, essays, chapters, and books pertaining to specific localities that provide accounts of how segregation occurred in those places. An annotated bibliography of these resources is viewable on the right-hand menu to this web report or as a layer in the map. We provide those narratives not only to contextualize the data in our map, but also as models for other groups to emulate.
VI. Conclusion
One of the fundamental problems in our world is the divide between people who want a community built around a single, primary salient identity and those who want to live in diverse, pluralistic communities. The exclusionary enclave sentiment undergirds anti-immigrant and xenophobic sentiment worldwide, but it is also rampant within societies, including in the United States. This is the essence of segregation.
As the “root” metaphor suggests, reducing racial disparities in health care, criminal justice enforcement or education without addressing racial residential segregation is treating symptoms and not causes. Segregation remains one of the principal causes of group-based inequality, by separating people from life-enhancing resources, such as good schools, healthy environments, and access to jobs. This was the raison d'être for public accommodations segregation in the Jim Crow South: to maintain a racial caste system. But residential segregation does this with nearly the same wicked efficiency today. We must act if we are serious about remedying systemic and structural racism. But before we can act, we first need to recognize the problem. Our primary goal with this report is to better help us do just that.
We have made progress toward integration in the past (and, in fact, most American cities were more racially residentially integrated in the nineteenth century than they were in the twentieth), and can do so again in the future.84 But it takes focused attention and deliberate effort. In the educational context, between 1968 and the early 1990s, we made enormous strides in creating more integrated school systems.85 Although many schools have gradually re-segregated since, these efforts prove it was possible.
Our concerns with persistent racial residential segregation in the United States are primarily empirical, not philosophical. They are based upon a careful review of the ever-accumulating and already voluminous social science evidence that racial residential segregation is associated with harmful impacts in terms of health, educational attainment, employment, income and wealth. This evidence supports our view that racial residential segregation is the mechanism that sorts people into advantaged or disadvantaged environments based upon race, and therefore is the taproot of systemic racial inequality.
Although this project is based upon a careful review of the evidence of the harms caused by racial residential segregation, there are other grounds to be concerned about the persistence of racial residential segregation. As we said in another recent publication, “racial residential segregation undermines the possibility of a national community with a sense of shared purpose and common destiny; this is a less immediate danger and more difficult to perceive and fully appreciate.”86
Indeed, this was one of the principal insights of the prophetic Kerner Commission report of 1968. As it stated in its chapter on “The Future of the Cities,” integration is “the only course which explicitly seeks to achieve a single nation” rather than a dual or permanently divided society.87 Even if it were possible, however unlikely, to ameliorate extreme inequalities between segregated communities and achieve the "separate, but equal" status which was a transparent fiction in Plessy v. Ferguson, that would merely reinforce societal balkanization, not help engender a cohesive yet diverse nation where everyone belongs.
Click for the Technical Appendix.
- 1This project has been in development for many years, and the authors would like to thank Lindsey Burnside, Peter Mattingly, Karina French, and Ruqayah Ghaus for their research support and contributions to this project. The authors would also like to thank external reviewers Richard Rothstein, George Galster, Sheryll Cashin, Alex Schafran, and Nancy McCardle for their expert feedback on this project.
- 2“Protestors’ Anger Justified Even If Actions May Not Be,” Monmouth University Polling Institute, June 2, 2020, https://www.monmouth.edu/polling-institute/reports/monmouthpoll_us_060220/; Michael Tesler, “Support For Black Lives Matter Surged During Protests, But Is Waning Among White Americans,” FiveThirtyEight, August 19, 2020, https://fivethirtyeight.com/features/support-for-black-lives-matter-surged-during-protests-but-is-waning-among-white-americans/
- 3See e.g. Linda Villarosa, “Why America’s Black Mothers and Babies Are in a Life-or-Death Crisis,” New York Times, April 11, 2018, https://www.nytimes.com/2018/04/11/magazine/black-mothers-babies-death-maternal-mortality.html.
- 4Jacob S. Rugh and Douglas S. Massey, “Racial Segregation and the American Foreclosure Crisis,” American Sociological Review 75, no. 5 (2010): 629-651, https://journals.sagepub.com/doi/10.1177/0003122410380868.
- 5Douglas S. Massey, “Still the Linchpin: Segregation and Stratification in the USA,” Race and Social Problems 12, no. 1 (2020): 1, https://link.springer.com/article/10.1007/s12552-019-09280-1.
- 6See e.g. Mosi Secret, “‘The Way to Survive It Was to Make A’s’,” New York Times, September 7, 2017, https://www.nytimes.com/2017/09/07/magazine/the-way-to-survive-it-was-to-make-as.html; Steve Maas, “As Southern Schools Desegregated, Share of Black Teachers Declined,” NBER Digest, no. 9 (2019): 6, https://www.nber.org/digest/sep19/southern-schools-desegregated-share-black-teachers-declined; Sharon Washington, “We’re Still Waiting For The Promise Of Brown v. Board Of Education To Be Fulfilled,” Huffington Post, May 16, 2021, https://www.huffpost.com/entry/brown-v-board-of-education-integration_n_609fc167e4b063dcceaa219d.
- 7Kevin D. Brown, “Termination of Public School Desegregation: Determination of Unitary Status Based on the Elimination of Invidious Value Inculcation,” George Washington Law Review 58, no. 6 (1990): 1105-1164, https://www.repository.law.indiana.edu/cgi/viewcontent.cgi?article=1747&context=facpub#:~:text=For%20the%20purposes%20of%20the,to%20the%20relevant%20educational%20authorities.
- 8Even if it seems more logical in retrospect, given that much school segregation is a byproduct of neighborhood segregation. See e.g. David Brooks, “Integration Now, Integration Forever,” New York Times, March 29, 2018, https://www.nytimes.com/2018/03/29/opinion/integration-now-integration-forever.html.
- 9“Housing Discrimination Under the Fair Housing Act,” United States Department of Housing and Urban Development, accessed May 7, 2021, https://www.hud.gov/program_offices/fair_housing_equal_opp/fair_housing_act_overview.
- 10Nikole Hannah-Jones, “Living Apart: How the Government Betrayed a Landmark Civil Rights Law,” ProPublica, June 25, 2015, https://www.propublica.org/article/living-apart-how-the-government-betrayed-a-landmark-civil-rights-law; john a. powell, “Reflections on the Past, Looking to the Future: The Fair Housing Act at 40,” Indiana Law Review 41, no. 3 (2008): 606, https://journals.iupui.edu/index.php/inlawrev/article/view/3949; Stephen Menendian, “Affirmatively Furthering Fair Housing: A Reckoning with Government‐Sponsored Segregation in the 21st Century,” National Civic Review 106, no. 3 (2017): 20-27, https://onlinelibrary.wiley.com/doi/abs/10.1002/ncr.21332.
- 11Richard H. Sander, Yana A. Kucheva and Jonathan M. Zasloff, Moving Toward Integration: The Past and Future of Fair Housing (Cambridge, MA: Harvard University Press, 2018), 166-198 (investigating the “puzzle” of why some cities integrated more than others between 1970 and 1980). See our technical appendix for a different and more nuanced definition of what we mean by “integration.”
- 12By “White,” we deviate from contemporary census conventions, and mean the term to refer to non-Hispanic white people. Further, although the US Census classifies Asian, African-American/Black, and white/Caucasian as racial categories and Hispanic as an ethnic category, we refer to Latino/a as a racial category that generally encompasses groups that the census counts as “Hispanic, non-white,” and classify “non-Hispanic whites” as simply white, and so on. We recognize that racial and ethnic categories are contested and politically fraught, but adopt this taxonomy for ease of analysis and simplicity in discussion. We further recognize the gendered nature of Latino, but, we use “Latino” in a gender neutral manner, or alternatively Latinx. Relatedly, we classify Native American peoples as a racial category, although tribal membership is not necessarily an indicator of racial identity.
- 13David M. Cutler, Edward L. Glaeser and Jacob L. Vigdor, “The Rise and Decline of the American Ghetto,” Journal of Political Economy 107, no. 3 (1999): 455-506, https://www.jstor.org/stable/10.1086/250069?seq=1.
- 14See e.g. Allison Roda and Amy Stuart Wells, “School Choice Policies and Racial Segregation: Where White Parents’ Good Intentions, Anxiety, and Privilege Collide,” American Journal of Education 119, no. 2 (2013): 261-293, https://www.journals.uchicago.edu/doi/abs/10.1086/668753?mobileUi=0&journalCode=aje&. (for a scholarly example) and the New York Times podcast Nice White Parents (for a more popular example) Chana Joffe-Walt, “1: The Book of Statuses,” July 30, 2020, in Nice White Parents, produced by Simplecast, MP3 Audio, 1:00:45, https://www.nytimes.com/2020/07/23/podcasts/nice-white-parents-serial.html.
- 15“Brown at 65 -- No Cause for Celebration,” UCLA Civil Rights Project, May 10, 2019, https://www.civilrightsproject.ucla.edu/news/press-releases/press-releases-2019/brown-at-65-no-cause-for-celebration.
- 16Alvin Chang, “We Can Draw School Zones to Make Classrooms Less Segregated. This is How Well Your District Does,” VOX, August 27, 2018, https://www.vox.com/2018/1/8/16822374/school-segregation-gerrymander-map, (showing how school demographics replicate neighborhood demographics). There are exceptions, of course, in that some school districts have managed to maintain integration through special programs. For a list of initiatives promoting school integration, see Halley Potter and Michelle Burris, Here Is What School Integration in America Looks Like Today (New York, NY: The Century Foundation, 2020), https://tcf.org/content/report/school-integration-america-looks-like-today/.
- 17Ibram X. Kendi, How to be an Antiracist (New York, NY: One World, 2019), 176.
- 18This report and project is focused on illuminating the extent of racial residential segregation in the United States and its harmful consequences. We do not attempt to explain how racial residential segregation was created and perpetuated (although we may allude to some contributing factors), nor do we offer a set of solutions to this problem. Such an effort would be beyond the scope of our narrow purpose: to raise awareness of the extent and nature of the problem. There are many different theories on what causes or sustains racial residential segregation. For a sense of the (unresolved) scholarly debate on the causes of racial residential segregation, see Stephen Menendian, “Recent Writing on the Causes, Consequences, and Politics of Racial Segregation,” Othering & Belonging Institute, October 31, 2019, https://belonging.berkeley.edu/recent-writing-causes-consequences-and-politics-racial-segregation. For sources on solutions to the problem, see e.g. Stephen Menendian, Samir Gambhir, and Arthur Gailes, Racial Segregation in the San Francisco Bay Area, Part 5: Remedies, Solutions, and Targets (Berkeley, CA: Othering & Belonging Institute, 2020); Richard Rothstein, “Considering Fixes,” in The Color of Law: A Forgotten History of How Our Government Segregated America (New York, NY: Liveright Publishing Corporation, 2017); Richard Sander, Yana A. Kucheva and Jonathan M. Zasloff, Moving Toward Integration: The Past and Future of Fair Housing (Cambridge, MA: Harvard University Press, 2018), 409-444.
- 19It is worth emphasizing this nuanced distinction. While equity advocates accurately appreciate the harms of segregation in terms of the distribution of tangible resources, the courts and many social scientists have also regularly understood the harms of segregation in intangible terms as well. In Brown v. Board of Education (1954), most notably, the US Supreme Court stipulated that “the Negro and white schools involved have been equalized, or are being equalized, with respect to buildings, curricula, qualifications and salaries of teachers, and other ‘tangible’ factors.” Brown, 347 U.S. at 492. It did so, based upon an agreement of the parties, so that the Court might rule against the doctrine of ‘separate, but equal’ on broader grounds, not as a legal fiction to be made honest. See john a. powell, RSF: The Russell Sage Foundation Journal of the Social Sciences 7, no. 1 (2021): 20-31, https://www.rsfjournal.org/content/7/1/20. Similarly, in United States v. Virginia, 518 U.S. 515 (1996), the Supreme Court struck down the state of Virginia’s female-only alternative to its prestigious military institute, VMI. As the Court observed in a landmark opinion delivered by Justice Ruth Bader Ginsburg, VMI’s reputation, unique history, unique training, and alumni network could not be duplicated at a sister institution, no matter how well resourced. In any assessment of the harms of segregation, we must try to look beyond tangible resources and simple disparities.
- 20Exec. Order No. 9066, 72 Fed. Reg. 93 (February, 19, 1942), https://www.archives.gov/historical-docs/todays-doc/?dod-date=219. This order was challenged in the United States Supreme Court, which upheld it. Korematsu v. United States, 323 U.S. 214 (1944).
- 21Johnson v. California (03-636) 543 U.S. 499 (2005).
- 22Katherine Aron-Beller, “Ghettoization: The Papal Enclosure and Its Jews,” in A Companion to Early Modern Rome, 1492-1692, eds. Pamela M. Jones, Barbara Wisch, and Simon Dutchfield (Leiden, The Netherlands: Brill, 2019), 232-246; Luis Suarez-Fernandez, Documentos acerca de la expulsion de los Judios, trans. Edward Peters, (Valladolid: C.S.I.C., 1964), 391-395, http://www.sephardicstudies.org/decree.html.
- 23Michael Sullivan, “An Untouchable Subject? Indian Government Wants Caste System off U.N. Agenda,” NPR, August 29, 2001, https://legacy.npr.org/programs/specials/racism/010828.caste.html.
- 24Balla Satish, “Why This India Priest Carried an 'Untouchable' Into a Temple,” BBC, April 20, 2018, https://www.bbc.com/news/world-asia-india-43807951.
- 25“17-year-old Dalit youth not allowed to enter temple, shot dead by upper caste men for arguing,” Times Now, last modified June 9, 2020, https://www.timesnownews.com/mirror-now/crime/article/17-year-old-dalit-youth-not-allowed-to-enter-temple-shot-dead-by-upper-caste-men-for-arguing/603464.
- 26Ben Hubbard and Vivian Yee, “Saudi Arabia Extends New Rights to Women in Blow to Oppressive System,” New York Times, August 2, 2019, https://www.nytimes.com/2019/08/02/world/middleeast/saudi-arabia-guardianship.html.
- 27“Saudi Arabia's Ban On Women Driving Officially Ends,” BBC, June 24, 2018, https://www.bbc.com/news/world-middle-east-44576795#.
- 28“Saudi Arabia Ends Gender Segregation in Restaurants,” BBC, December 9, 2019, https://www.bbc.com/news/world-middle-east-50708384.
- 29Jeff Wallenfeldt, “The Troubles,” Encyclopedia Britannica, August 21, 2020, https://www.britannica.com/event/The-Troubles-Northern-Ireland-history; Tim Pat Coogan, The Troubles: Ireland's Ordeal 1966–1995 and the Search for Peace (Clerkenwell, London: Head of Zeus, 2015).
- 30See Gemma Catney, “‘Religious’ Concentration and Health Outcomes in Northern Ireland,” in Social-Spatial Segregation: Concepts, Processes and Outcomes, ed. Christopher D. Lloyd, Ian Shuttleworth, and David W. Wong (Bristol, United Kingdom: Policy Press, 2014), 335-362.
- 31Paul Nolan, “Two Tribes: A Divided Northern Ireland,” The Irish Times, April 1, 2017, https://www.irishtimes.com/news/ireland/irish-news/two-tribes-a-divided-northern-ireland-1.3030921.
- 32Stephen Menendian and Arthur Gailes, Racial Segregation in the San Francisco Bay Area, Part 4: The Harmful Effects of Segregation (Berkeley, CA: Othering & Belonging Institute, 2019), https://belonging.berkeley.edu/racial-segregation-san-francisco-bay-area-part-4.
- 33David R. Williams and Chiquita Collins, “Racial Residential Segregation: A Fundamental Cause of Racial Disparities in Health,” Public Health Reports 116, no. 5 (2001): 404- 416; David R. Williams, Jourdyn A. Lawrence, and Brigette A. Davis, “Racism and Health: Evidence and Needed Research,” Annual Review of Public Health 40, (2019): 105-125; Zinzi D. Bailey, “Structural Racism and Health Inequities in the USA: Evidence and Interventions,” The Lancet 389, no. 10077 (2017): 1453-1463; Michael R. Kramer and Carol R. Hogue, “Is Segregation Bad for Your Health?,” Epidemiologic Reviews 31, no. 1 (2009): 178-194; Gilbert C. Gee and Chandra L. Ford, “Structural Racism and Health Inequities: Old Issues,” Du Bois Rev 8, no. 1 (2011): 115; Kellee White and Luisa N. Borrell, “Racial/Ethnic Residential Segregation: Framing the Context of Health Risk and Health Disparities,” Health & Place 17, no. 2 (2011): 438- 448, quoted in Jason Richardson et al., The Lasting Impact of Historic “Redlining” on Neighborhood Health: Higher Prevalence of Covid-19 Risk Factors (Washington, D.C.: National Community Reinvestment Coalition, 2020), 11, https://ncrc.org/holc-health/.
- 34Anthony P. Polednak,"Trends in US Urban Black Infant Mortality, By Degree of Residential Segregation," American Journal of Public Health 86, no. 5 (1996): 723-726, https://pubmed.ncbi.nlm.nih.gov/8629726/.
- 35Diane Alexander and Janet Currie, "Is it Who You Are or Where You Live? Residential Segregation and Racial Gaps in Childhood Asthma," Journal of Health Economics 55 (2017): 186-200.
- 36Kiarri N. Kershaw et al., "Neighborhood-Level Racial/Ethnic Residential Segregation and Incident Cardiovascular Disease: The Multi-Ethnic Study of Atherosclerosis," Circulation 131, no. 2 (2015): 141-148.
- 37Sharrelle Barber et al., “Abstract MP58: Racial Residential Segregation is Associated With Worse Cardiovascular Health in African American Adults: The Jackson Heart Study.” Circulation 137, no. suppl_1 (2018).
- 38Kiarri N. Kershaw et al., "Metropolitan-Level Racial Residential Segregation and Black-White Disparities in Hypertension," American Journal of Epidemiology 174, no. 5 (2011): 537-545; Barber et al.,”Abstract MP58.”
- 39Lindsay R. Pool et al., "Longitudinal Associations of Neighborhood-Level Racial Residential Segregation With Obesity Among Blacks," Epidemiology 29, no. 2 (2018): 207-214.
- 40Kirsten M. Beyer et al., “New Spatially Continuous Indices of Redlining and Racial Bias in Mortgage Lending: Links to Survival After Breast Cancer Diagnosis and Implications for Health Disparities Research,” Health & Place 40, (2016): 34-43; Rachel Morello-Frosch and Bill M. Jesdale, “Separate and Unequal: Residential Segregation and Estimated Cancer Risks Associated with Ambient Air Toxics In U.S. Metropolitan Areas,” Environmental and Health Perspectives 114, no. 3 (2006): 386-393; Michelle Precourt Debbink and Michael D. M. Bader, “Racial Residential Segregation and Low Birth Weight in Michigan's Metropolitan Areas,” American Journal of Public Health 101, no. 9 (2011): 1714-1720; Renee Mehra, Lisa M. Boyd, and Jeannette R. Ickovics, “Racial Residential Segregation and Adverse Birth Outcomes: A Systematic Review and Meta-Analysis,” Social Science & Medicine 191, (2017): 237-250; Michael McFarland and Cheryl A. Smith, “Segregation, Race, and Infant Well-Being,” Population Research and Policy Review 30, (2011): 467–493, quoted in Jason Richardson et al., The Lasting Impact of Historic “Redlining” on Neighborhood Health: Higher Prevalence of Covid-19 Risk Factors (Washington, D.C.: National Community Reinvestment Coalition, 2020), 11, https://ncrc.org/holc-health/.
- 41Jason Richardson et al., The Lasting Impact of Historic “Redlining” on Neighborhood Health: Higher Prevalence of Covid-19 Risk Factors (Washington, D.C.: National Community Reinvestment Coalition, 2020),10, https://ncrc.org/holc-health/.
- 42Danyelle Solomon, Connor Maxwell, and Abril Castro, “Systemic Inequality: Displacement, Exclusion, and Segregation,” Center for American Progress, August 7, 2019, https://www.americanprogress.org/issues/race/reports/2019/08/07/472617/s.
- 43Dayna Bowen Matthew, Edward Rodrigue, and Richard V. Reeves, “Time For Justice: Tackling Race Inequalities in Health and Housing,” Brookings Institution, October 19, 2016, https://www.brookings.edu/research/time-for-justice-tackling-race-inequa.
- 44See e.g. “Parents Involved in Community Schools v. Seattle School Dist. No. 1, et al.: Brief of 553 Social Scientists as Amici Curiae in Support of Respondents,” UCLA Civil Rights Project, https://civilrightsproject.ucla.edu/legal-developments/court-decisions/statement-of-american-social-scientists-of-research-on-school-desegregation-submitted-to-us-supreme-court/amicus_parents_v_seatl…. See also Brief of the Caucus for Structural Equity (Columbus, OH: Kirwan Institute for the Study of Race and Ethnicity, 2006), 12-27, http://www.kirwaninstitute.osu.edu/reports/2006/10_2006_Caucus_for_Structural_Equity_Brief.pdf.
- 45Brief for the American Educational Research Association as Amicus Curiae, Parents Involved in Community Schools v. Seattle School District No. 1, 127 S. Ct. 2738 (2007), quoted in Linda Darling-Hammond, “What Can PISA Tell Us about U.S. Education Policy?,” New England Journal of Public Policy 26, no. 1 (2014): 6.
- 46Cody Tuttle, “The Long-Run Economic Effects of School Desegregation,” University of Maryland, Department of Economics, (2019): 1, http://econweb.umd.edu/~tuttle/files/tuttle_busing.pdf.
- 47Sean F. Reardon et al., “Is Separate Still Unequal? New Evidence on School Segregation and Racial Academic Achievement Gaps,” CEPA Working Paper, no. 19-06 (2019): 1, https://vtechworks.lib.vt.edu/bitstream/handle/10919/97804/SeparateStillEqual.pdf?sequence=1&isAllowed=y.
- 48Rucker C. Johnson, "Long-Run Impacts of School Desegregation and School Quality on Adult Attainments,” NBER Working Paper, no. 16664 (2011): 2, https://www.nber.org/system/files/working_papers/w16664/w16664.pdf.
- 49Gregory Acs et al., The Cost of Segregation: National Trends and the Case of Chicago, 1990-2010 (Washington, DC: Urban Institute, 2017), https://www.urban.org/research/publication/cost-segregation/view/full_report; Ingrid Gould Ellen, Justin P. Steil, and Jorge De la Roca, “The Significance of Segregation in the 21st Century” City & Community 15, no. 1 (2016): 8–13; Justin Steil, Jorge de la Roca, and Ingrid Gould Ellen, “Desvinculado y Desigual: Is Segregation Harmful to Latinos?,” The Annals of the American Academy of Political and Social Science 660, no. 1 (2015): 92-110.
- 50David M. Cutler and Edward Glaeser, “Are Ghettos Good or Bad?” Quarterly Journal of Economics 112, no. 3 (1997): 827-872.
- 51Vicki Been, Ingrid Ellen, and Josiah Madar, “The High Cost of Segregation: Exploring Racial Disparities in High-Cost Lending,” Fordham Urban Law Journal 36, no. 3 (2009): 361-393.
- 52This issue parallels the debate over “in place” interventions versus “mobility strategies.” To see a description of the failure of many place-based interventions, see powell and Menendian, “Opportunity Communities: Overcoming the Debate Over Mobility Versus Place-Based Strategies”, Squires, Gregory D., and Walter F. Mondale, eds. 2018. The fight for fair housing: causes, consequences, and future implications of the 1968 Federal Fair Housing Act.
- 53See e.g. Richard Rothstein, The Color of Law: A Forgotten History of How Our Government Segregated America (New York, NY: Liveright Publishing Corporation, 2017).
- 54We know this because, inter alia, of the exposure index results, which tell us the average community for members of each race. Douglas S. Massey and Nancy A. Denton, “The Dimensions of Residential Segregation,” Social Forces 67, no. 2 (1988): 287.
- 55Maria Krysan and Kyle Crowder, Cycle of Segregation: Social Processes and Residential Stratification (New York, NY: The Russell Sage Foundation, 2017), 33.
- 56John R. Logan, Separate and Unequal in Suburbia (Washington, D.C.: United States Census Bureau- US2010 Project, 2014), 4, https://s4.ad.brown.edu/Projects/Diversity/Data/Report/report12012014.pdf.
- 57Alex Schafran, The Road to Resegregation: Northern California and the Failure of Politics (Berkeley, CA: University of California Press, 2018), 24. See also Claude S. Fischer et al., "Distinguishing the Geographic Levels and Social Dimensions of U.S. Metropolitan Segregation, 1960-2000," Demography 41, no. 1 (2004): 45, http://www.jstor.org/stable/1515212.(describing how segregation has evolved from 1960, especially that most Black segregation is now regional rather than ‘tract-within-place’ segregation).
- 58Reynolds Farley et al., ““Chocolate City, Vanilla Suburbs:” Will the Trend Toward Racially Separate Communities Continue?,” Social Science Research 7, no. 4 (1978): 319-344, https://www.sciencedirect.com/science/article/abs/pii/0049089X78900170; Jenny Schuetz, “Metro Areas Are Still Racially Segregated,” Brookings Institution, December 8, 2017, https://www.brookings.edu/blog/the-avenue/2017/12/08/metro-areas-are-still-racially-segregated/.
- 59Even when controlling for just Black-white Divergence, there are many cities that are much more segregated than the Black-white dissimilarity score would suggest. For example, Las Vegas, El Paso, Raleigh, Charlottesville, VA, Gainesville, FL, and Durham-Chapel Hill, NC have much higher Black-white divergence scores than Black-white dissimilarity scores. See Table 1 in our technical appendix, and the table “Comparing Black-White Segregation Measures” on the right-hand menu.
- 60John R. Logan and Brian J. Stults, The Persistence of Segregation in the Metropolis: New Findings from the 2010 Census (Washington, D.C.: United States Census Bureau- US2010 Project, 2011), 6, https://s4.ad.brown.edu/Projects/Diversity/Data/Report/report2.pdf (listing Detroit, Milwaukee, New York, Newark, Chicago, Philadelphia, Miami, Cleveland, St. Louis, and Nassau as the top 10 most segregated cities in 2010 in Table 1). It is notable that at least 7 of our top 10 list are the same regions.
- 61Protests and Uprisings in 1967 [map], 1:18, 475,000, “Othering & Belonging Institute,” https://belonging.berkeley.edu/sites/default/files/protest_cities_v2.png. See also “Race & Inequality in America: The Kerner Commission at 50 Conference, February 27- March 1, 2018,” Othering & Belonging Institute, 2018, https://belonging.berkeley.edu/kerner50.
- 62There is considerable nuance lost in drawing broad conclusions about the overall level of segregation across regions, and these conclusions are highly sensitive to the measure used. For a scholarly investigation that came to a very different conclusion while also comparing other measures of segregation, see Trevon D. Logan and John M. Parman, "The National Rise in Residential Segregation," The Journal of Economic History 77, no. 1 (2017): 127-170.
- 63The term “people of color” typically encompasses all non-white groups. However, for the purposes of identifying “highly segregated communities of color,” we are referring only to segregated Black and/or Latino communities. The reason for this is that there are vanishingly few tracts in the United States that are highly segregated and predominantly Native American and/or Asian. Therefore, “segregated communities of color” is almost coterminous with “segregated Black and/or Latino” neighborhoods. This does not mean that the few predominantly Asian and/or Native American tracts in the country are being characterized as white, but that they are not included in this specific analysis, presented in Tables 4 and 5 or on the “detailed” view of the map delineating between these types of neighborhoods. As you can see from the last two rows of Table 4, not all tracts are included in this analysis because they are either not highly segregated, not integrated, or not predominantly white and/or Black or Latino. Asian and Native Americans, however, are accounted for in the city and metro rankings, as they are in nearly all of our Divergence Index calculations.
- 64See e.g. Robert J. Sampson, Great American City: Chicago and the Enduring Neighborhood Effect (Chicago, Illinois: The University of Chicago Press, 2012), 47, 358; Raj Chetty, Nathaniel Hendren, and Lawrence F. Katz, "The Effects of Exposure to Better Neighborhoods on Children: New Evidence from the Moving to Opportunity Experiment," American Economic Review 106, no. 4 (2016): 855-902.
- 65Census tracts are classified into four groups for the purpose of this report: High White Segregation: Divergence Index in the top third nationally, majority white, and a white Location Quotient above 1.25. High POC Segregation: Divergence Index in the top third nationally, but not in the above category. Well Integrated: Divergence Index in the bottom third nationally, an Entropy score in the top 50% nationally, and at least 20% Black and Latino. Low-Medium Segregation: All other census tracts not covered by the other three categories. In practice, this means they are neither highly segregated nor integrated by our definition.
- 66All figures are the average between the Census tracts in each category, weighted by population or households.
- 67John L. Rury and Argun Saatcioglu, “Opportunity Hoarding,” The Wiley Blackwell Encyclopedia of Race, Ethnicity, and Nationalism (2015): 1-3, https://onlinelibrary.wiley.com/doi/abs/10.1002/9781118663202.wberen435. The findings of this report are largely consistent with that report and our series on racial segregation in the San Francisco Bay Area, where we found similar results. Stephen Menendian et al., Racial Segregation in the San Francisco Bay Area (Berkeley, CA: Othering & Belonging Institute, 2020).
- 68“U.S. Small-Area Life Expectancy Estimates Project (USALEEP),” Centers for Disease Control and Prevention, last modified June 9, 2020, https://www.cdc.gov/nchs/nvss/usaleep/usaleep.html.
- 69“The Opportunity Atlas,” Opportunity Atlas, accessed May 7, 2021, https://www.opportunityatlas.org/. Whereas our correlations are merely suggestive of some causal relationship, the authors of Opportunity Atlas have established a causal relationship based upon sibling pairs. See Raj Chetty and Nathaniel Hendren, “The Impacts of Neighborhoods on Intergenerational Mobility: Childhood Exposure Effects and County-Level Estimates,” Harvard University and NBER (2015): 1-144, http://www.equality-of-opportunity.org/images/nbhds_paper.pdf.
- 70These results control for income by focusing only on children born to parents at the bottom 25th percentile of income. Also, the results are in 2015 dollars, and are not adjusted for inflation.
- 71See Amy E. Hillier, “Residential Security Maps and Neighborhood Appraisals: The Home Owners' Loan Corporation and the Case of Philadelphia,” Social Science History 29, no. 2 (2005): 207-233; Kristen B. Crossney and David W. Bartelt, “The Legacy of the Home Owners’ Loan Corporation,” Housing Policy Debate 16, no. 3-4 (2005): 547-574; Todd M. Michney and LaDale Winling, “New Perspectives on New Deal Housing Policy: Explicating and Mapping HOLC Loans to African Americans,” Journal of Urban History 46, no. 1 (2020): 150-180, quoted in Jason Richardson et al., The Lasting Impact of Historic “Redlining” on Neighborhood Health: Higher Prevalence of Covid-19 Risk Factors (Washington, D.C.: National Community Reinvestment Coalition, 2020), 9, https://ncrc.org/holc-health/.
- 72See e.g. Anthony L. Nardone et al., “Associations Between Historical Redlining and Birth Outcomes from 2006 through 2015 in California,” PLoS ONE 15, no. 8 (2020), https://journals.plos.org/plosone/article?id=10.1371/journal.pone.0237241.
- 73There is more nuance to this story than we can present here. In brief, HOLC lending mostly wound down by 1936, but the appraisal system it created would live on for decades longer. In particular, this system spread throughout the private market, even where it had not already been implicitly present, and to the FHA redlining maps. See Price V. Fishback et al., “Race, Risk, and the Emergence of Federal Redlining,” NBER Working Paper, no. 28146 (2020), https://www.nber.org/papers/w28146. There are also many other researchers using the digitized HOLC maps to assess their possible impact over time. See e.g. Daniel Aaronson, Daniel Hartley, and Bhash Mazumder, “The Effects of the 1930s Holc 'Redlining' Maps,” FRB of Chicago Working Paper, no. 2017-12 (2017): 1-81, https://www.chicagofed.org/publications/working-papers/2017/wp2017-12 and Jacob W. Faber, “We Built This: Consequences of New Deal Era Intervention in America’s Racial Geography,” American Sociological Review 85, no. 5 (2020): 739-775, https://journals.sagepub.com/doi/full/10.1177/0003122420948464.
- 74This is a very complicated table to render for a number of methodological reasons. But not every city was given a HOLC grade, and not every neighborhood within graded cities was graded at the time (because it may not have existed). Also, HOLC grades were not uniformly distributed. Overall, 6 percent of areas were grade A, vs 45 percent being grade C, which helps explain why such a large percentage of neighborhood types are “C” grades today.
- 75See Jessica Trounstine, Segregation by Design: Local Politics and Inequality in American Cities (Cambridge, United Kingdom: Cambridge University Press, 2018). (Arguing that racial segregation could be both a cause and effect of political polarization). It could be a cause, as Trounstine argues, because racial residential segregation undermines broad support for investments in public goods. But it could also be an effect because racial residential segregation facilitates political gerrymandering. Indeed, the Supreme Court has suggested that racial gerrymandering is in effect state-based racial segregation. Shaw v. Reno, 509 U.S. 630, 1993 (Justice O’Connor characterized racial redistricting as "an effort to segregate voters into separate voting districts because of their race.”) See also Miller v. Johnson, 515 U.S. 900 (1995) (Justice Kennedy wrote that “the essence of the equal protection claim recognized in Shaw is that the state has used race as a basis for separating voters into districts”). The problem is that the Court has essentially refused to regulate political gerrymandering not based explicitly or obviously on race. Gill v. Whitford, 585 U.S. ___ (2018)
- 76Jacob R. Brown et al., “Childhood Cross-Ethnic Exposure Predicts Political Behavior Seven Decades Later: Evidence From Linked Administrative Data,” Science Advances 7, no. 24 (2021): 1-14, https://advances.sciencemag.org/content/7/24/eabe8432.
- 77Polarization is an elusive concept. As a helpful analog, economic polarization is when a larger part of the income distribution exists at the tails rather than in the middle.
- 78To operationalize a measure of political polarization, we use the Divergence Index formula: Broadly speaking, we define political polarization as the degree of “divergence” in political attitudes to ideological extremes. For this analysis, we calculate the share of Democratic and Republican votes from the 2020 US Presidential Election for individual voting precincts and compare that share with the greater metropolitan area. Using the Divergence Index, we configure how extreme ideologies are in a precinct based on how over- or underrepresented that ideology is relative to the surrounding precincts within that area. For example, the metropolitan area of Jackson, Mississippi ranks first in political divergence, indicating the presence of ideological extremes where precincts overwhelmingly voted in favor of one party while neighboring precincts voted in favor of the other party. Comparatively, the metropolitan area of Carson City, Nevada has one of the lowest political divergence scores, suggesting that neighboring precincts tended to vote less in favor of one candidate and that the share of votes between parties was relatively consistent across all precincts within that area.
- 79Nicholas Stephanopoulos and Eric McGhee, “Partisan Gerrymandering and the Efficiency Gap,” University of Chicago Law Review 82 (2015): 831-900, https://chicagounbound.uchicago.edu/cgi/viewcontent.cgi?article=12542&context=journal_articles.
- 80See e.g. "Educational Opportunity in the U.S.,” The Educational Opportunity Project at Stanford University, https://edopportunity.org/explorer/#/split/none/districts/avg/ses/all/3.15/37.39/-96.78/; Kate Rabinowitz, Armand Emamdjomeh and Laura Meckler, “How The Nation’s Growing Racial Diversity is Changing Our Schools,” The Washington Post, September 12, 2019, https://www.washingtonpost.com/graphics/2019/local/school-diversity-data/; Alvin Chang, “We Can Draw School Zones to Make Classrooms Less Segregated. This is How Well Your District Does,” Vox, last modified August 27, 2018, https://www.vox.com/2018/1/8/16822374/school-segregation-gerrymander-map. These mapping tools allow users to look up schools and school districts to assess the level of segregation among other uses.
- 81We anchor these findings with the Metropolitan/Micropolitan (Core-Based) Statistical Area or county, as available. “Core-Based Statistical Areas,” United States Census Bureau, last modified December 7, 2016, https://www.census.gov/topics/housing/housing-patterns/about/core-based-statistical-areas.html.
- 82We aggregate place population from the census tract, so our reported percentages differ slightly from official Census counts. See the Technical Appendix for more details https://belonging.berkeley.edu/technical-appendix.
- 83As soon as the tract-level 2020 census results are out, we will update our map and key findings in this report.
- 84See e.g. James H. Carr and Nandinee K. Kutty, “The New Imperative for Equality,” in Segregation: The Rising Costs for America, eds. James H. Carr and Nandinee K. Kutty (New York, NY: Routledge, 2008), 3-4.
- 85See Carl Kaestle, “Federalism and Inequality in Education: What Can History Tell Us?,” in The Dynamics of Opportunity in America: Evidence and Perspectives, eds. Henry Braun and Irwin Kirsch (Switzerland: Springer International Publishing AG, 2016), 48, table 3.1.
- 86Nirali Beri, Richard Rothstein, and Stephen Menendian. The Road Not Taken: Housing and Criminal Justice 50 Years after the Kerner Commission Report. (Berkeley, CA: Othering & Belonging Institute, 2019). https://belonging.berkeley.edu/road-not-taken.
- 87Otto Kerner et al., Report of The National Advisory Commission on Civil Disorders (Washington, D.C.: United States Government Publishing Office, 1968), 406.

