
Segregation is one of our nation’s most enduring and intractable problems. More than 60 years since the Supreme Court’s landmark Brown v. Board of Education decision denounced racial segregation in primary and secondary public schools, and 50 years since the enactment of the federal Fair Housing Act, our neighborhoods and schools have yet to reflect the rich diversity of our nation as a whole. Given the seriousness of the problem of racial segregation as a cause of racial inequality and the complexities in understanding the nature of this problem, the Institute launched a series of briefs that will attempt to illuminate these patterns and demystify the reality of segregation in the San Francisco Bay Area. We've also launched an interactive segregation map of the Bay Area as a supplement to the third brief.
Part 1: Segregation
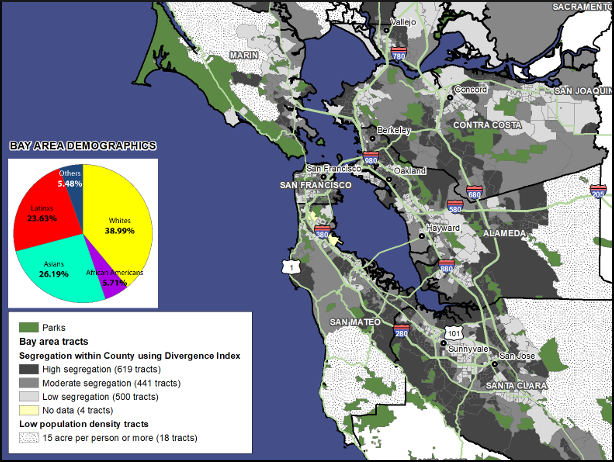
In the first brief, we present a series of detailed maps illustrating segregation across the region, within each of the nine Bay Area counties, and in its major metropolitan areas. Our goal is that readers in the Bay Area, for the first time, will have a clear portrait of the reality and extent of the racial segregation in their communities. We highlight and discuss the varying levels of residential racial segregation within the region and show which communities and neighborhoods are the most segregated, and the most integrated.
Part 2: Demographics
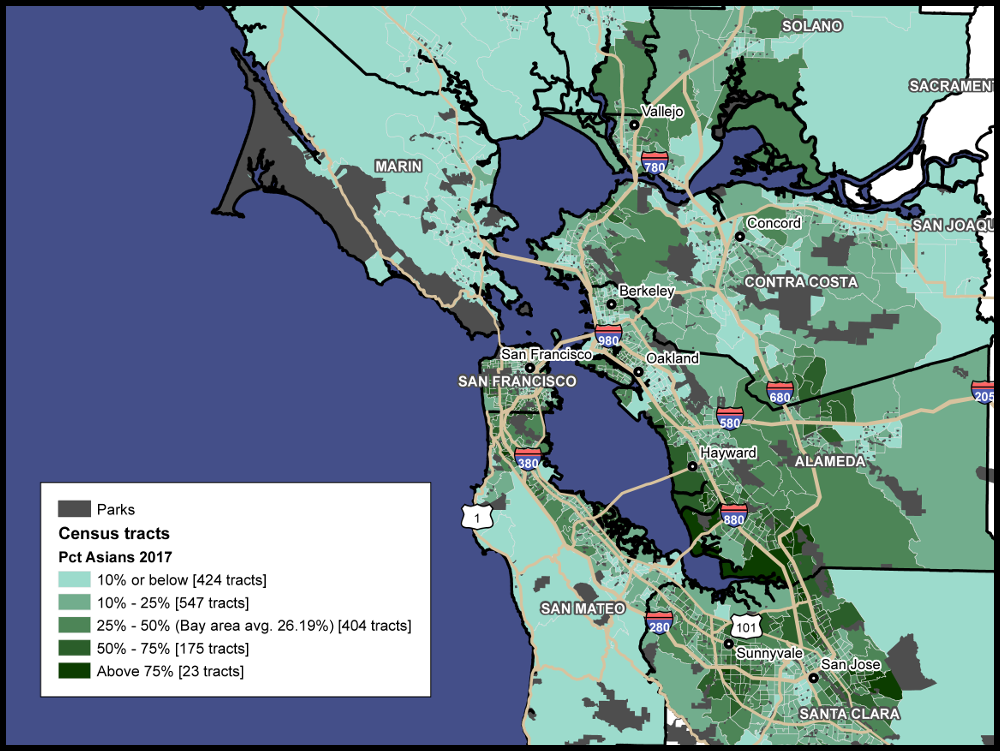
In our second brief we disaggregate and untangle patterns of segregation into specific patterns of racial demographics. We examine the unique patterns of racial distribution in the San Francisco Bay region, and across major metropolitan areas. In particular, part two of this series illustrates the distribution of white, Black, Latino, Asian, and Native American populations across each large metropolitan area and many counties. We also examine specific areas of racial clustering and concentration, not simply segregation, and examine how these demographic changes have occurred over time.
Part 3: Measuring Segregation
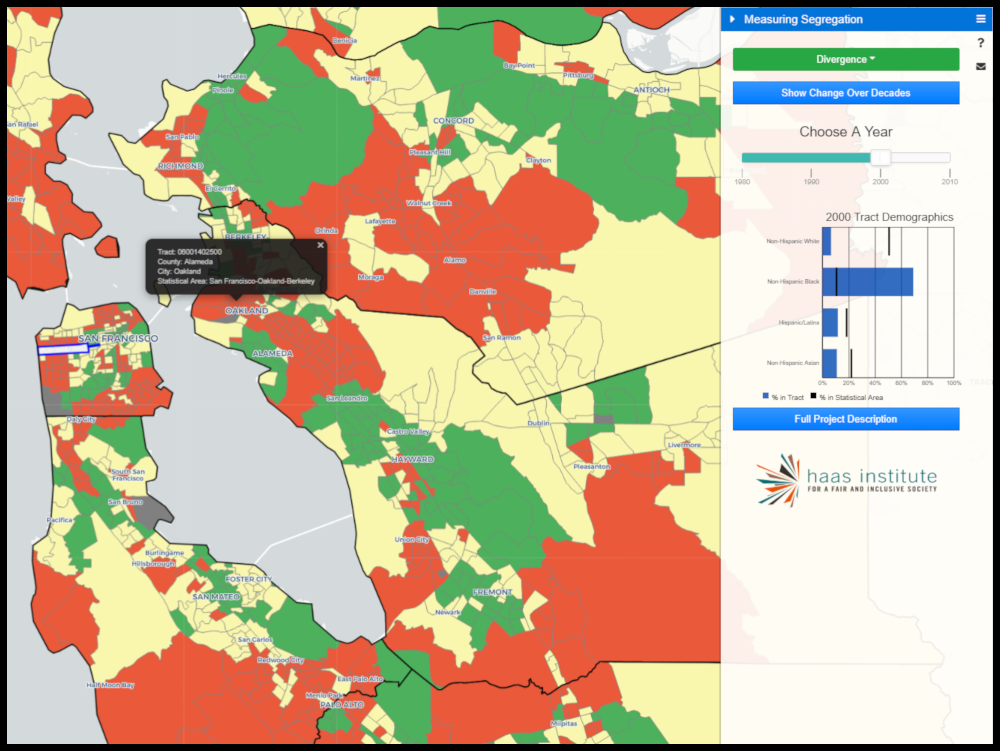
In our third brief, we shift the discussion to a more technical, but no less important, matter: the measurement of segregation. As we emphasized throughout this series, racial segregation is not the same thing as racial demographics. Too often, maps of racial demographics are used as a substitute for mapping segregation itself. By examining several measures of segregation in juxtaposition, we can offer a better-rounded portrait of the actual reality of segregation itself and a better understanding of the perspective that any particular measure illuminates—a partial glimpse of a complex whole.
Part 4: The Harmful Effects of Segregation
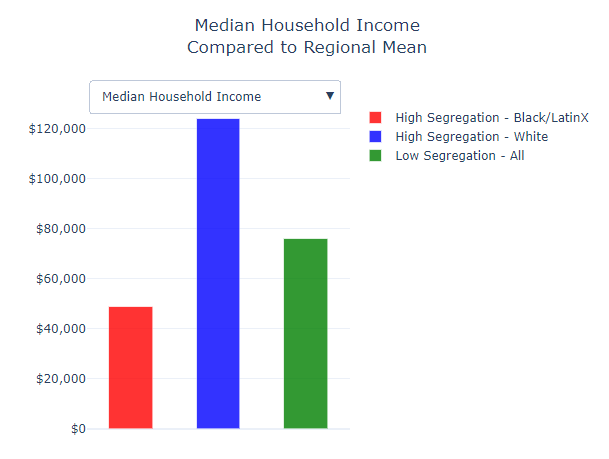
In this fourth brief, we turn to the question of the effects of segregation. Specifically, we illustrate the specific correlations with segregation and a variety of life outcomes in the San Francisco Bay Area. The study compared metrics between three types of neighborhoods: 1. highly segregated Black and/or Latinx neighborhoods; 2. highly segregated white neighborhoods; and 3. Low segregation/relatively integrated neighborhoods. Overall, we find that highly segregated Black/Latinx neighborhoods correlate with negative life outcomes for all people in those communities, including rates of poverty, income, educational attainment, home values, and health outcomes.
Part 5: Remedies, Solutions, and Targets
This fifth and final brief on remedies, solutions, and targets presents five general policy approaches that can help address the problem of racial residential segregation and help put the Bay Area on a better path forward. We present each strategy individually and explain why these strategies may advance the goal of greater integration, and how they could be operationalized in the Bay Area. We also suggest empirical targets to measure progress.
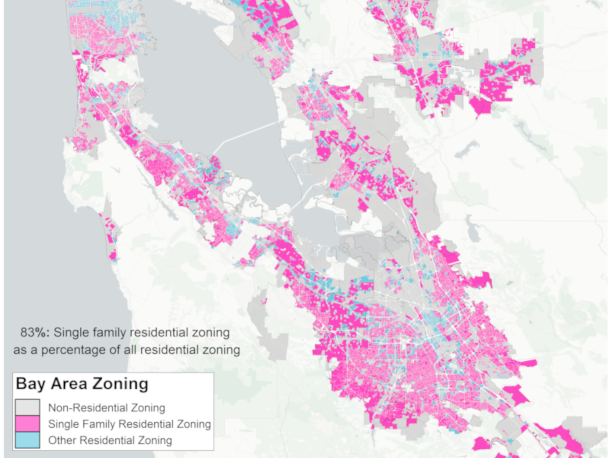
Zoning Report: Characteristics of Exclusionary Communities
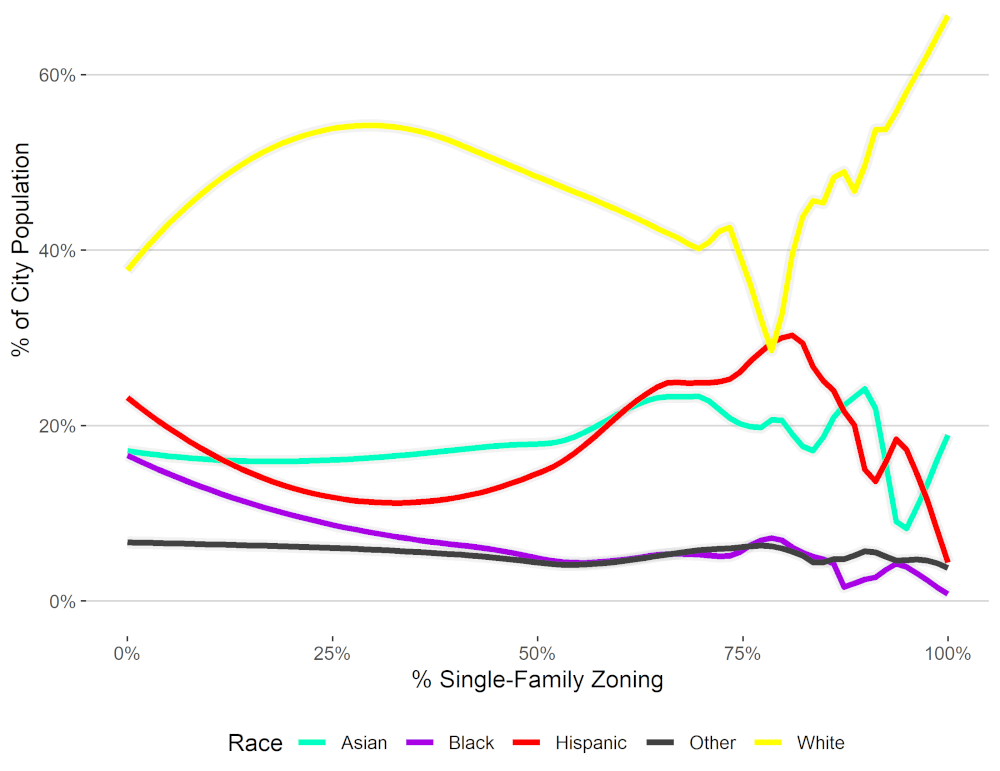
This report follows our zoning analysis from the Part 5 brief, but elaborates with more detailed findings on the harms of exclusionary zoning beyond a focus on segregation. It compares the level of single-family zoning against variables such as community incomes, home values, school performance, and much more. We consistently find that single-family zoning is correlated with both white racial segregation and opportunity hoarding. This report also makes public our parcel-level zoning data for other researchers to conduct their own analyses.
Decoding Zoning: Regulation and Reform in California
As part of our racial segregation report series, we mapped exclusionary zoning, analyzed its association with racial segregation in the Bay Area, and offered recommendations for exclusionary zoning reform. However, the path to effective zoning reform is still emerging, as only a handful of cities nationwide have moved towards reforming single-family exclusionary zoning. This article describes the statutory basis and process of amending zoning law in California, offers a framework for understanding the phases of reform, and provides examples from California and beyond.
Addendum II: Following up on the Bay Area's Most Segregated Cities in 2020
In November of 2020, we ranked every city in the Bay Area from most to least segregated internally and in terms of segregation from the surrounding region. Using the recently-released 2020 Census data, we are updating and expanding that research to include listings of the most segregated neighborhoods in the Bay Area for every major racial group.
Addendum: The Most Segregated Cities in the Bay Area in 2019
Whereas the previous five reports in this series focused on neighborhoods or counties, this follow-up brief ranks the most segregated and most integrated cities in the Bay Area. A downloadable spreadsheet indicates the segregated score for all 101 incorporated municipalities using city-wide and neighborhood segregation scores.
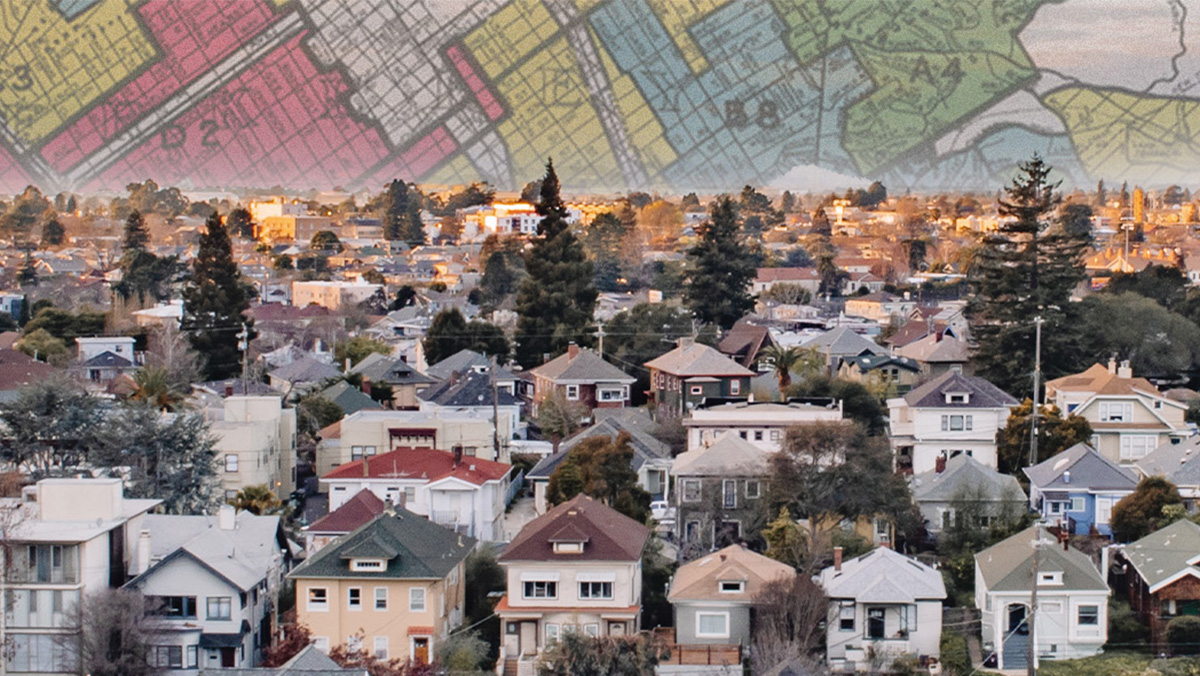
A History of Racially Exclusionary Housing in the Bay Area

This report traces the long history of racially-motivated exclusion in housing in the San Francisco Bay Area from the late nineteenth century up until the passage of the federal Fair Housing Act in 1968. This report focuses on the tactics of racial exclusion and dispossession driven by local actors such as homeowners’ associations and neighborhood groups, real estate agents and developers operating within the regional housing market, and institutions, such as local governments and public agencies, which collectively shape local policies and markets, thus blurring the lines between public and private action.

