Background
Our recently released report, Single-Family Zoning in Greater Los Angeles, examined the pervasiveness of single-family zoning in counties within the Southern California Association of Governments (SCAG) region. The analysis uncovered a number of alarming correlates to high levels of single-family zoning, spanning income, prospects for upward mobility, educational outcomes, and environmental hazards. The aforementioned report concluded that single-family zoning appears to facilitate opportunity hoarding, or the accumulation of critical resources and services in some communities and the denial of those same resources to others, by preserving inaccessible high home and rental prices and preventing construction of more affordable multi-family units. Such prices exclude lower-income residents from these resource-rich areas.
Furthermore, single-family zoning appears to simultaneously drive resource accumulation via a correlation with higher median home values. As higher median home values likely connect to higher property tax values—a major municipal revenue source—this finding prompted us to investigate the relationship between single-family zoning, municipal revenue drivers like property tax, and municipal spending. Municipal revenues are important for critical infrastructure like water and sewage, in addition to funding parks, road repairs, and other services. However, some revenues have heavy legal restrictions and may only be spent on certain programs. Other revenues are discretionary, meaning cities may allocate the funds to any program or service. Discretionary spending is what typically funds desirable community features like recreational areas and libraries, and property tax is a primary source of discretionary revenue.
Whereas our previous report highlights the impact of single-family zoning on individuals’ earnings and life trajectories, our present report digs deeper into the possible effects of exclusionary zoning on community and municipality-level resources. The findings below provide additional support for the theory that single-family zoning is a means of opportunity hoarding. In particular, this analysis suggests that single-family zoning impacts municipal discretionary funding and the provision of desirable municipal services and infrastructure, thus playing a role in resource hoarding at the municipal level. Such inequities in community resources likely contribute to the disparities observed in the Single-Family Zoning in Greater Los Angeles report, and suggest that the SCAG region needs zoning reform to facilitate equitable access to opportunity for all residents.
City Balance Sheets
To provide context for this analysis of municipal revenues and spending, we lay out a brief overview of the SCAG region’s city expenditures, incomes, securities, and budgets (see Table 1). This will underlie our subsequent analysis on the unique budget circumstances of high single-family zoning areas and zoning’s role in increasing discretionary funds.
While 64 percent of cities in the region spend more than they take in annually, overall, cities are balancing their budgets with expenditure-to-revenue ratios hovering just over 1:1. Although California state law does not require local governments to maintain balanced budgets, other measures ensure local budgets are kept in check.1 The expenditure-to-revenue ratios are comparable across cities in the three single-family zoning percentage groups. Meanwhile, cities in the highest single-family zoning percentage group have the highest cash- and securities-to-revenue ratio, suggesting larger financial reserves for these cities compared to municipalities with less single-family zoning.
Table 1: Median annual municipal expenditure, revenue, and cash and securities grouped by single-family zoning percentage
|
|
|
|
|
|
|
|
|
|
|
|
|
|
|
|
|
|
|
|
|
|
|
|
|
|
|
|
|
|
|
|
|
|
|
|
When we look at municipal revenue and expenditure per capita, however, we find both to be significantly lower for cities in the 90 - 100 percent single-family zoning group compared to the other two groups (see Table 1, above).5 At first, this may seem to counter the idea that resource hoarding is prevalent in more exclusive cites, but not all revenues are created and used equally. The differences in expenditures per capita may relate to excessive spending on police in the two lower single-family zoning groups, which we will discuss in a subsequent section. All told, these findings suggest that the better life trajectories and environmental health of these communities, as laid out in the Greater Los Angeles report, aren’t necessarily due to the cities being better funded overall. The key difference may lie in how and where they are spending their revenue, and critically, how much of that revenue is discretionary.
Property Tax: A major source of discretionary municipal revenue
On average in California cities, the second largest source of city revenue is property tax.6 User charges and fees make up the largest source of revenue, but this funding is limited to covering the cost of services.7 This makes property tax the largest revenue source that can be used for discretionary spending like police, parks and recreation, community development, and public works. Our previous research found a correlation between single-family zoning and median property values. To continue this line of inquiry, in this section, we dive into the relationship between property tax and single-family zoning to investigate how these regulations impact community resources.
Cities levy property tax based on the assessed real estate values.8 In California, Proposition 13 caps these taxes to 1 percent of the property’s value at purchase, with annual 2 percent increases to the taxable, originally assessed value of the property barring sale or new construction. It follows that neighborhoods and cities with higher home values would generate more property tax revenue for the municipal government. Indeed, we found a correlation between percentage of single-family zoning and property tax per capita, especially among cities with more than 90 percent of land zoned for single families, as shown in Figure 1.
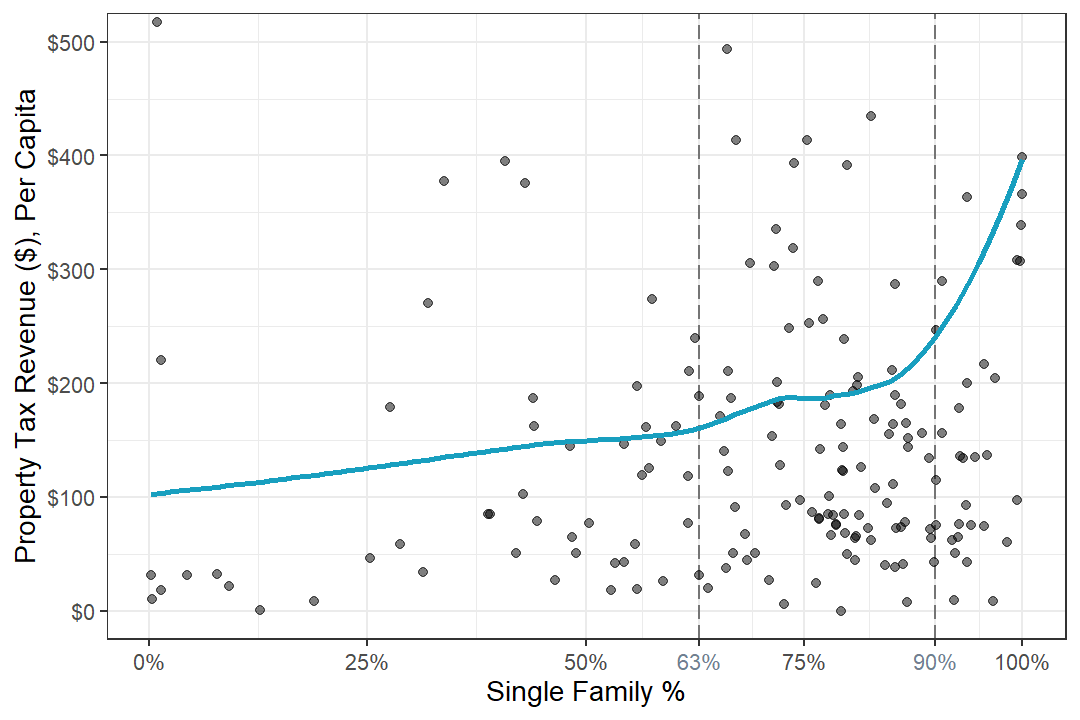
Figure 1: Property tax per capita and higher percent of single-family-only zoning percentage for the cities in the SCAG region. Note: Only up to $500 per capita is shown in the graph for interpretability for the trend line. There are data points beyond $500 per capita, especially for the highest single-family % group.
Cities in the 90 - 100 percent single-family zoning group had nearly double the median property tax revenue (per capita and per household) of cities in the 0 - 63 percent group. However, single-family zoning most directly impacts the market price of residential properties. Therefore, we did a secondary analysis that included cities with a majority of residential land to focus on the impact zoning may have on property tax revenues,9 which revealed a median property tax revenue (per capita and per household) nearly three times higher in cities with 90 - 100 percent single-family zoning compared to cities with 0 - 63 percent single-family zoning (Table 2). This further supports the hypothesis that single-family zoning contributes significantly to municipal revenue creation via its impact on home prices.
Table 2: Median property tax revenue per capita and per household among cities with majority residentially-zoned land, grouped by single-family zoning percentage
|
|
|
|
|
|
|
|
|
|
|
|
|
|
|
|
|
|
|
|
|
|
|
|
|
|
|
|
|
|
We further investigate the relationship between zoning, property tax, and municipal revenue by looking at property tax as a percentage of total municipal revenue. Since property tax is often the largest source of revenue for local discretionary funds, cities with a larger share of municipal revenue funded by property taxes could spend more on the services commonly associated with more desired neighborhood characteristics (e.g., public works, schools, and parks and recreation). And this is exactly what we found; property tax accounts for a higher percentage of the total municipal revenue for the highest single-family zoning group (Figure 2).
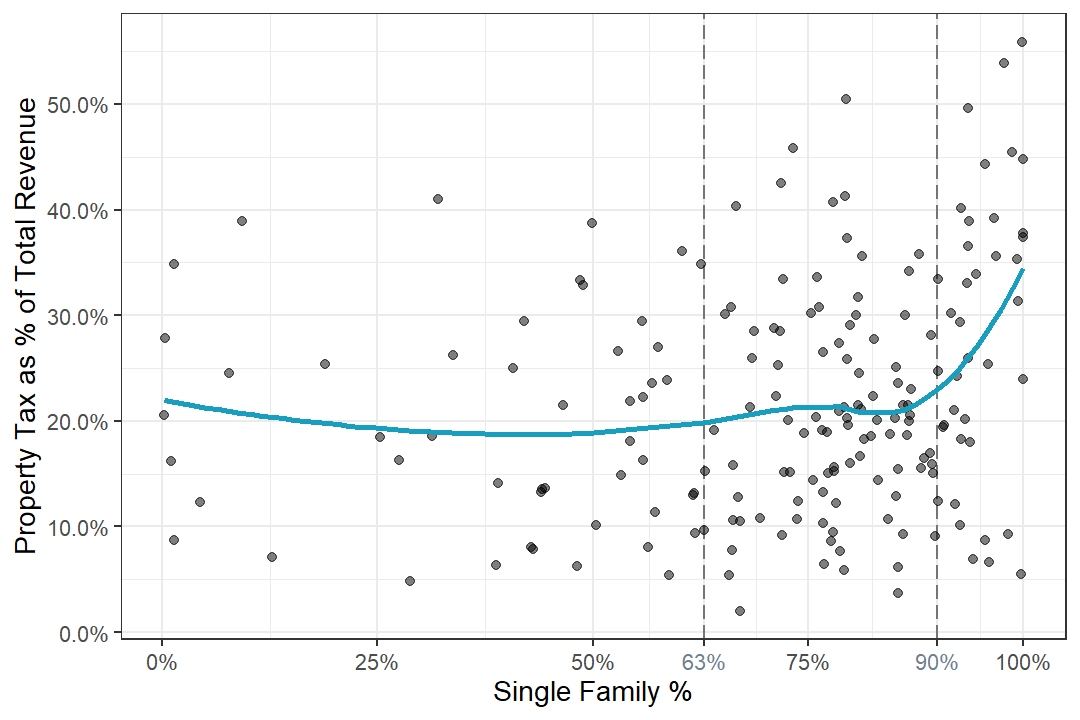
Figure 2: Property tax revenue as a percentage of total municipal revenue and single-family-only zoning percentages for the cities in the SCAG region
So far, we have shown that SCAG cities with the highest percent of single-family zoning appear to have a higher percentage of municipal revenues from property taxes, the primary component of municipal discretionary funds. Next, we will investigate municipal expenditure to compare cities’ spending priorities in light of city zoning patterns.
Municipal spending and priorities
Consistently across cities from all single-family zoning groups, the top three municipal operational expenses in the Greater Los Angeles region are police, central staffing, and water facilities. Table 3 below shows the median operation spending for these three categories as a percentage of the municipal revenue.10
Table 3: Percentages of revenue spent on police, staffing, and water operations (the Top 3 operational expenses for all groups)
|
|
|
|
|
|
|
|
|
|
|
|
|
|
|
|
|
|
|
|
|
|
|
|
|
As we highlighted in the Greater Los Angeles zoning report, cities with higher single-family zoning percentages are whiter and have smaller lower-income and Black and Brown populations–racial groups that experience greater police surveillance and encounters.11 Indeed, median police operations spending seems to reflect this trend when we compare expenditures across three single-family percentage groups (Table 3). Although police is the top line item for all three groups, cities in the 90 - 100 percent single-family zoning group spend one-third less of their annual revenue on police operations compared to the 0 - 63 percent group.12
Comparing the top municipal spending and top discretionary revenue source side-by-side in Figure 3, we can see that the property tax alone in the 90 - 100 percent group is more than enough to fund police operations with plenty left over for other services. Conversely, the cities in 0 - 63 percent single-family zoning group spend more on police than the revenue generated by property tax. This potentially means the cities with a property tax revenue lower than their police operations spending (i.e., the cities with less single-family zoning) would need to supplement the police spending with additional revenue sources.
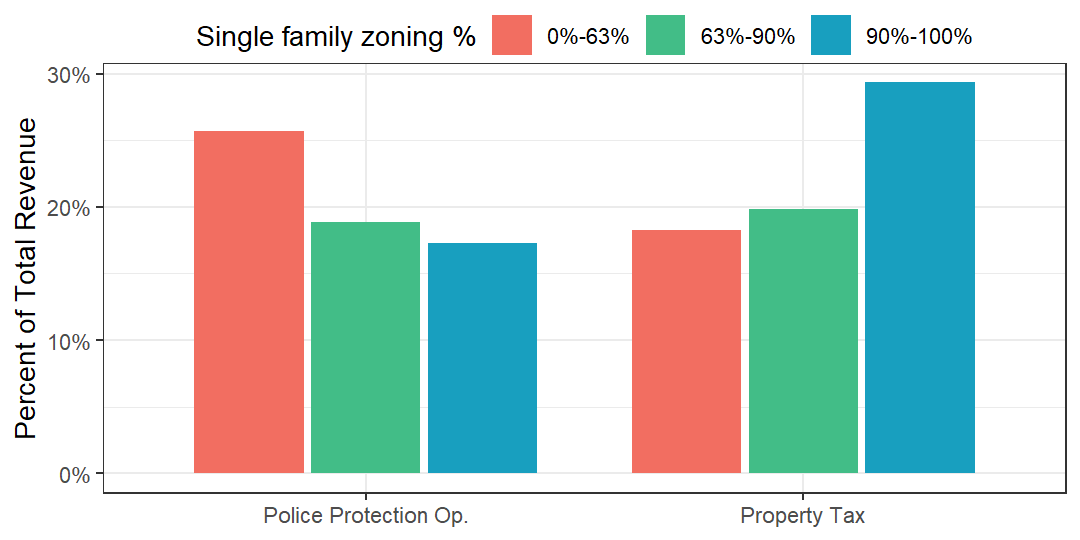
Figure 3. Police spending and property tax revenue as median percentages of total municipal revenue of cities, grouped by single-family-only zoning.
The savings in police operations in cities with more single-family zoning can be used to fund other desirable features like parks and recreation, libraries, and municipal services. These cities may also rely less on supplemental revenue sources like parcel taxes and sales taxes. On average, for the 139 cities with 63 percent or more of residential land zoned for single-family use, the savings from spending lower than 26 percent of their municipal revenue on police—the median percentage spent by cities with less than 63 percent single family zoning—amount to $28 million per city annually.13 In aggregate for the entire SCAG region, that amounts to $3.88 billion annually, enough to build 8,000 affordable housing units every year.14
The implications of the gap in discretionary revenue based on exclusionary zoning is borne out in the differences in expenditures on desirable municipal services as shown in Figure 4.15 Cities in the 90 -100 percent single-family zoning group consistently spend a higher portion of their municipal revenue than either of the other two zoning groups on the construction and operation of highways, roads, and parks, as well as on the operation of libraries, water facilities, and sewage.
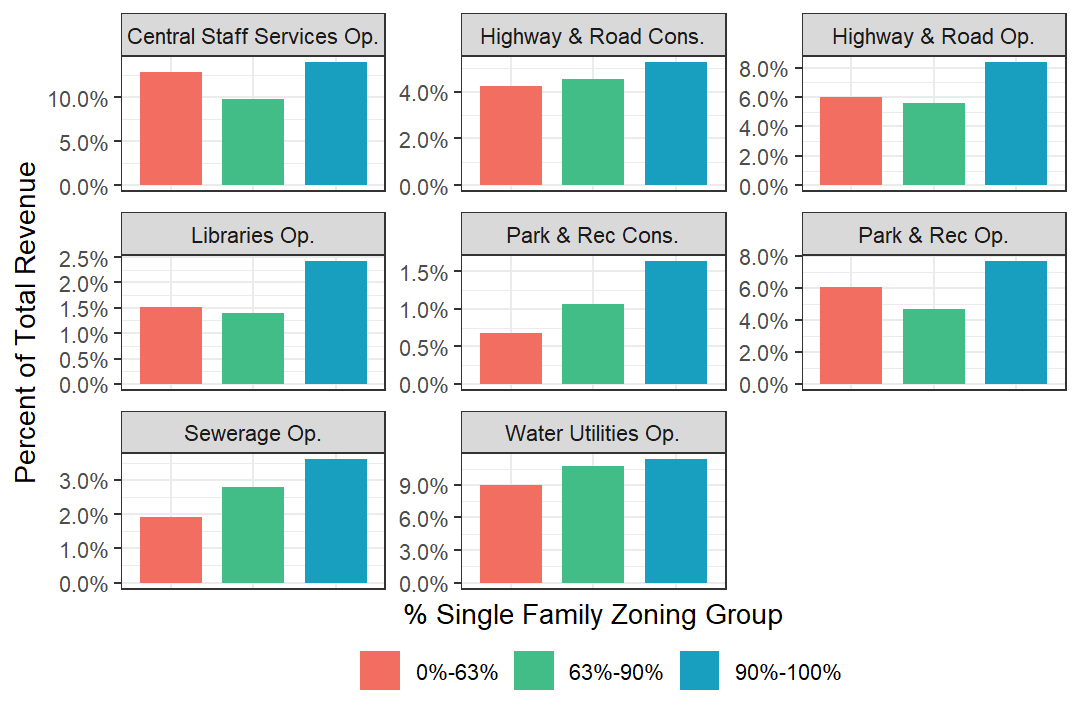
Figure 4: Selected municipal spending as median percentages of total municipal revenue of cities, grouped by percentage of single-family zoning
More exclusive communities—achieved in part through exclusionary regulations like single-family zoning and associated property values—spend less on police. This in turn allows cities to better fund other city services and infrastructure, potentially explaining aspects of the discrepancies in life outcomes discussed in the Greater Los Angeles zoning report. A cyclic effect may also be at play; thanks to investment in desirable community characteristics, property values likely increase and generate additional tax revenue and discretionary city funds for further investment, and so on.
City snapshot comparison
To illustrate these findings with examples of specific cities, we compare La Cañada Flintridge, a top city in need of zoning reform per the Greater Los Angeles report, and Inglewood, a highly segregated city with low single-family zoning undergoing dramatic changes in its housing market.16 Both cities are roughly the same distance from downtown Los Angeles; La Cañada lies to the north, situated on the foothills of the San Gabriel Mountains, while Inglewood is to the southwest of the downtown area, home of the new Los Angeles Rams football stadium (the world’s most expensive stadium). Table 4 below shows the key summaries of the two cities regarding zoning, sociodemographics, and municipal revenue and expenditure.
Table 4: Key sociodemographic, zoning, and municipal finance summaries of La Cañada Flintridge and Inglewood
|
|
|
|
|
|
|
|
|
|
|
|
|
|
|
|
|
|
|
|
|
|
|
|
|
|
|
|
|
|
|
|
|
|
|
|
|
|
|
|
|
|
|
|
|
|
|
|
|
|
|
|
|
|
|
|
Consistent with all of our findings in this report, the city with more single-family zoning, La Cañada Flintridge, is whiter and has more than three times the median household income and median home price of Inglewood. Property tax revenue in La Cañada Flintridge is higher than Inglewood, both per capita and as a percentage of total municipal revenue. While the median home value in La Cañada Flintridge is more than triple that of Inglewood, the property tax revenue per capita and per household are only 1.3 times Inglewood’s respective values.
As for policing, La Cañada Flintridge spends $166 per capita, or 16 percent of its total revenue (slightly more than half of its property tax revenue). Meanwhile, Inglewood’s expenditure on police is nearly triple that of La Cañada Flintridge per capita, spending almost 28 percent of its total revenue (and nearly twice its property tax revenue). If Inglewood could spend the same amount as La Cañada Flintridge on police per capita, it would save the city $44 million a year. That $44 million could be redirected towards parks, libraries, other amenities and social services.
Conclusion and Recommendations
The present research further supports the findings of our Greater Los Angeles zoning report. In particular, we find that single-family zoning likely contributes to opportunity and resource hoarding at the municipal level. Rampant single-family zoning appears to underlie a revenue producing cycle for some areas of SCAG. It contributes to higher home values by limiting housing supply, which in turn increases property tax revenues and drives up discretionary municipal revenue that can be spent on desirable neighborhood characteristics. The abundance of desirable neighborhood characteristics subsequently puts upward pressure on property values, and the cycle begins anew.
At face value, such effects may seem harmless or even beneficial, but high home prices also have an exclusionary effect and facilitate resource hoarding. Inaccessible home prices form a major obstacle to entry in such communities for individuals without means for high rents and mortgages. Those kept out are disproportionately Black and Brown, and these individuals are in turn kept away from the benefits of living in such neighborhoods. The municipalities they live in tend to spend a higher proportion of their budget on policing, leaving less of already diminished discretionary funds for beneficial communal services and resources. Overall, high levels of single-family zoning seem to create a cycle that likely deepens rifts of inequity and prevents many residents of the Greater Los Angeles area from having a fair shot at wealth accumulation, upward trajectories, and longer lives.19
Much like the Greater Los Angeles report, these findings support the need for the implementation of more inclusive zoning practices in the SCAG region, and for the state of California as a whole. The municipalities of the SCAG region must take steps, individually and collectively, to address the disparities evident in this report and our prior research. Creating affordable housing in areas rich in opportunities and resources will allow a more diverse swath of the Greater Los Angeles population to experience their benefits and move the entire state towards a more inclusive and equitable future.
- 1Michael Coleman. 2013. “Are California Cities Required to Have Budgets? No, But….” http://www.californiacityfinance.com/CityBudgets.pdf.
- 2In the Greater Los Angeles zoning report, we categorized the 189 cities in the Southern California Association of Government metropolitan planning area into three groups based on the percentage of the residential land zoned exclusively for single-family use (two cities, City of Industry and Vernon, were excluded as they have no residential zoning according to their respective city ordinance.) The three groups are 1) 0% to 63% single-family zoning, 2) more than 63% and less than or equal to 90% single-family zoning, and 3) more than 90% single-family zoning. We continue the same categorization for the analyses presented in this supplementary report.
- 3Total municipal expenditures divided by total municipal revenue.
- 4Total cash and securities divided by total municipal revenue. Cash and securities include cash on hand, bond funds, investments, etc. A full list of assets included in the category cash and securities can be found in Table 10-A in the Government Finance and Employment Classification Manual, https://www2.census.gov/govs/class/classfull.pdf.
- 5Municipal revenue and expenditure data compiled using 2015 to 2019 datasets and filtered to the most current data year for each city from United States Census Bureau, Annual Survey of State and Local Government Finance Data (United States Census Bureau), https://www.census.gov/programs-surveys/gov-finances/data/datasets.html.
- 6Institute for Local Government. 2016. “Understanding the Basics of Municipal Revenues in California: Cities, Counties and Special Districts.” Sacramento. https://www.ca-ilg.org/sites/main/files/file-attachments/basics_of_municipal_revenue_2016.pdf?1478299060.
- 7Per the California Code of Regulations. https://www.ca-ilg.org/sites/main/files/file-attachments/revenue_guide_formatted_footnotes.pdf
- 8Chas Alamo, Mark Whitaker, and Marianne O’Malley. 2012. “Understanding California’s Property Taxes.” Sacramento. https://lao.ca.gov/reports/2012/tax/property-tax-primer-112912.aspx.
- 9Defined as cities with 50% or more of city land area zoned as residential land. Of the original 189 cities, this excluded 59 cities for a total of 130 cities.
- 10United States Census Bureau. 2019. “Annual Survey of State and Local Government Finance.” https://www.census.gov/programs-surveys/gov-finances.html.
- 11Frank Edwards, Lee Hedwig, and Michael Esposito. 2019. “Risk of Being Killed by Police Use of Force in the United States by Age, Race–Ethnicity, and Sex.” Proceedings of the National Academy of Sciences 116 (34): 16793–98. https://doi.org/10.1073/pnas.1821204116; Lofstrom, Magnus, Joseph Hayes, Brandon Martin, Deepak Premkumar, and Alexandria Gumbs. 2021; “Racial Disparities in Law Enforcement Stops.” https://www.ppic.org/publication/racial-disparities-in-law-enforcement-stops/. Desilver, Drew, Michael Lipka, and Dalia Fahmy. 2020. “10 Things We Know about Race and Policing in the U.S.” https://www.pewresearch.org/fact-tank/2020/06/03/10-things-we-know-about-race-and-policing-in-the-u-s/.
- 12(25.68%-17.32%)/25.68%
- 13For each city, savings on police operations is calculated as the difference between what the city actually spent on police operations in the data year and the police operations expenditure if the city has to spend the same percentage of their revenue as the 0%-63% single-family zoning group.
- 14Using $500,000 per affordable unit from the following report. Carolina Reid. 2020. “The Costs of Affordable Housing Production: Insights from California’s 9% Low-Income Housing Tax Credit Program.” Berkeley. https://ternercenter.berkeley.edu/wp-content/uploads/pdfs/LIHTC_Construction_Costs_March_2020.pdf.
- 15United States Census Bureau. 2019. “Annual Survey of State and Local Government Finance.” https://www.census.gov/programs-surveys/gov-finances.html.
- 16Segregation as measured by the divergence of the city’s demographics from the larger metropolitan region.
- 17United States Census Bureau. 2020. “American Community Survey: 2015-2019 5-Year Data.” https://www.census.gov/programs-surveys/acs/data.html.
- 18Ibid.
- 19For further analysis of these inequities as they relate to residential segregation, see: Stephen Menendian, Samir Gambhir, and Arthur Gailes, “The Roots of Structural Racism” (Berkeley, CA: Othering & Belonging Institute, June 21, 2021), https://belonging.berkeley.edu/roots-structural-racism.

