

Introduction1
This brief report continues our series investigating the extent of restrictive and exclusionary zoning across California. Previous reports include municipal, county and regional zoning maps, and connect key community characteristics (like rents, housing costs, and educational attainment) with the degree of restrictive zoning by jurisdiction and region. We are particularly interested in how exclusionary zoning results in racial and economic segregation within regions. These regional reports and the accompanying maps (and data) will ultimately become part of a statewide California Zoning Atlas, which itself will be part of a national zoning atlas.
Previous reports in this series have covered the nine-county San Francisco Bay Area, Greater Los Angeles, Sacramento, San Diego, and Monterey regions. In this series, we highlight profound relationships between restrictive zoning, racial composition, housing costs, educational and health outcomes, environmental conditions, and much more. Each report is accompanied by static and interactive maps cataloging the exact clusters of restrictive zoning at the city, county, and regional level.
This (sixth) regional report continues that research by focusing on Fresno county. Fresno county encompasses 15 incorporated municipalities and one unincorporated county area, and is home to about 1 million residents. Its most populous cities include Fresno (population: 564,000), Clovis (112,000), and Sanger (28,000).2 Geographically, Fresno county is located in the Central Valley, and is home to abundant and fertile agricultural land. The county produced agricultural products worth $5.7 billion in 2017, the highest of any county in the United States.3
As with previous analyses of the San Diego and Monterey regions, because there are fewer jurisdictions in the region compared to our first three regional analyses, and because of the unique and unusual characteristics of the jurisdictions here (for example, the existence of large swathes of unincorporated land as shown in Figure 1), we are truncating our analysis to summary descriptive statistics of restrictive zoning in the region. We will describe our main findings, and then compare our top-line findings for this region to those in our previous three regional reports. Only in our recommendations section (in which we identify the jurisdictions most in need of reform) will we delve into the harmful exclusionary effects (by race and class) of restrictive zoning.
As before, for this report we have produced county and municipal static zoning maps (17 in all): one map for each of the 15 municipalities, one for unincorporated areas in the county, and a county map containing all areas (incorporated as well as unincorporated). We are also creating an interactive map with a drop-down menu containing each municipality (coming soon).
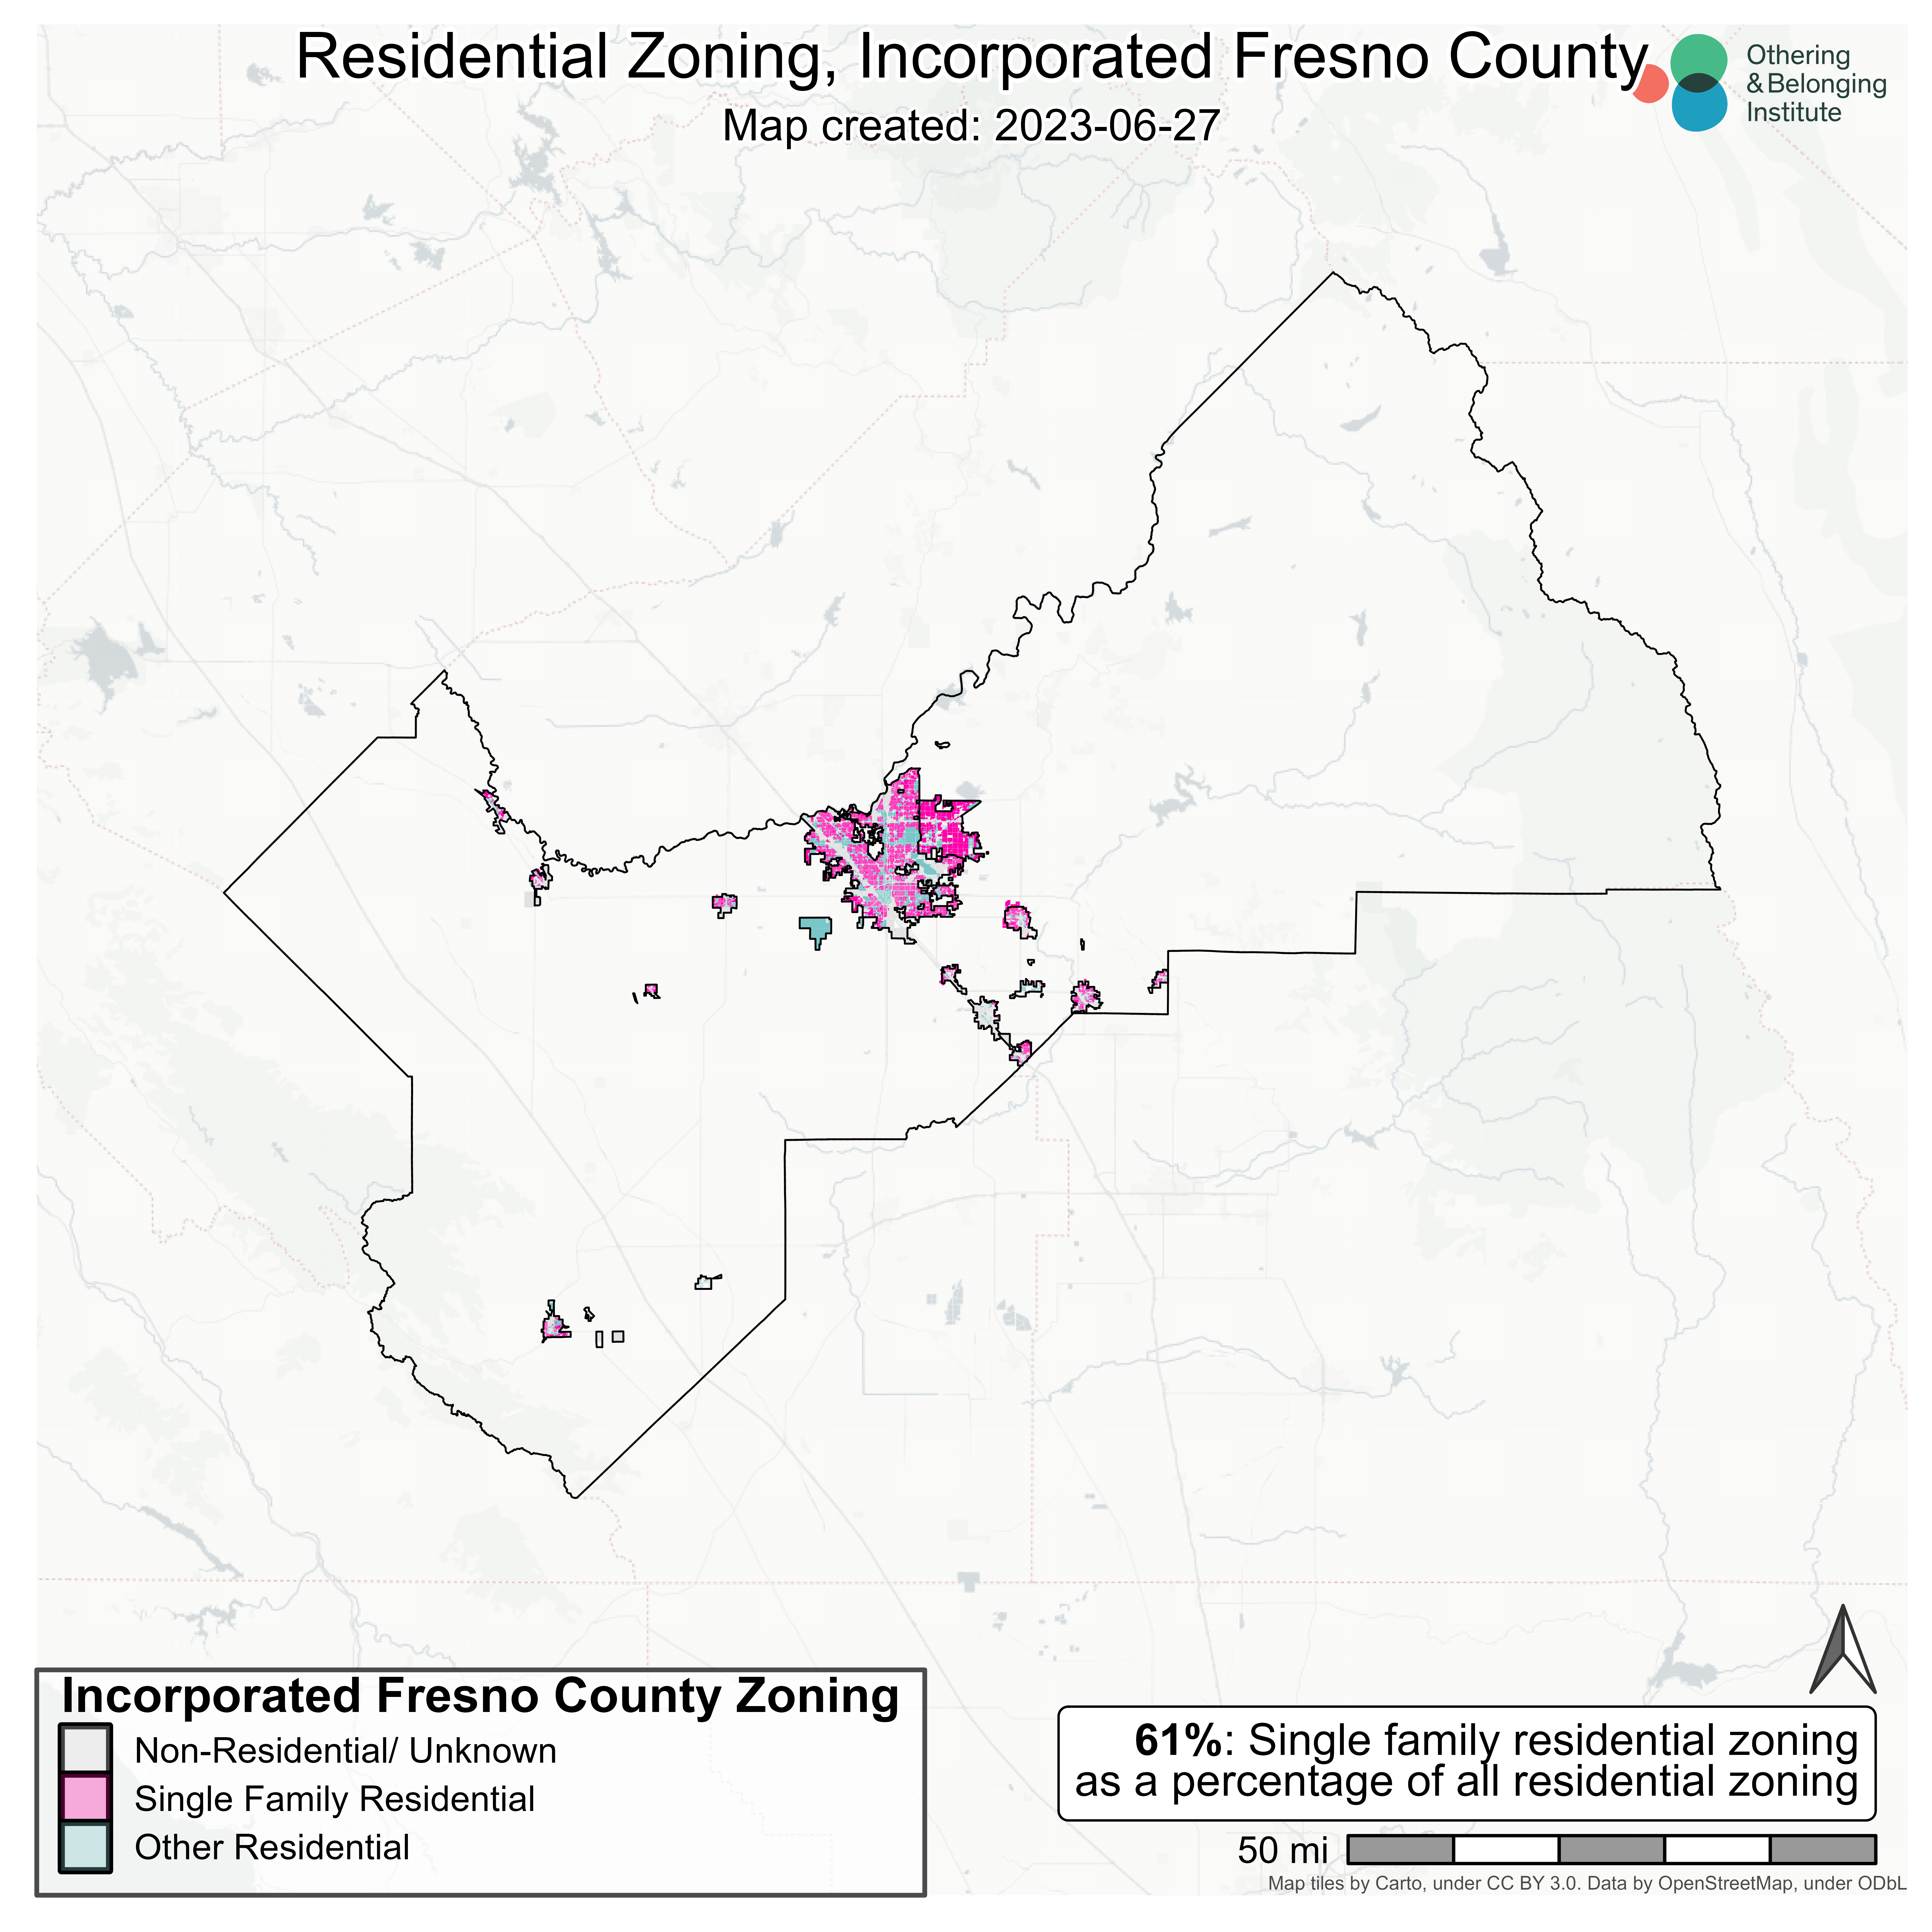
Each map illustrates the extent of single-family-only residential zoning, multi-family and mixed-use residential zoning, and non-residential zoning by area. It also indicates the percentage of single-family zoning relative to all residentially zoned areas, as well as the date at which the underlying zoning ordinance was accessed and the date the map was created. See Figures 1 and 2 below for zoning in Fresno county as a whole (encompassing both incorporated and unincorporated areas), and in incorporated areas, respectively.
Figure 1: Zoning in Fresno County (Incorporated and Unincorporated Areas)
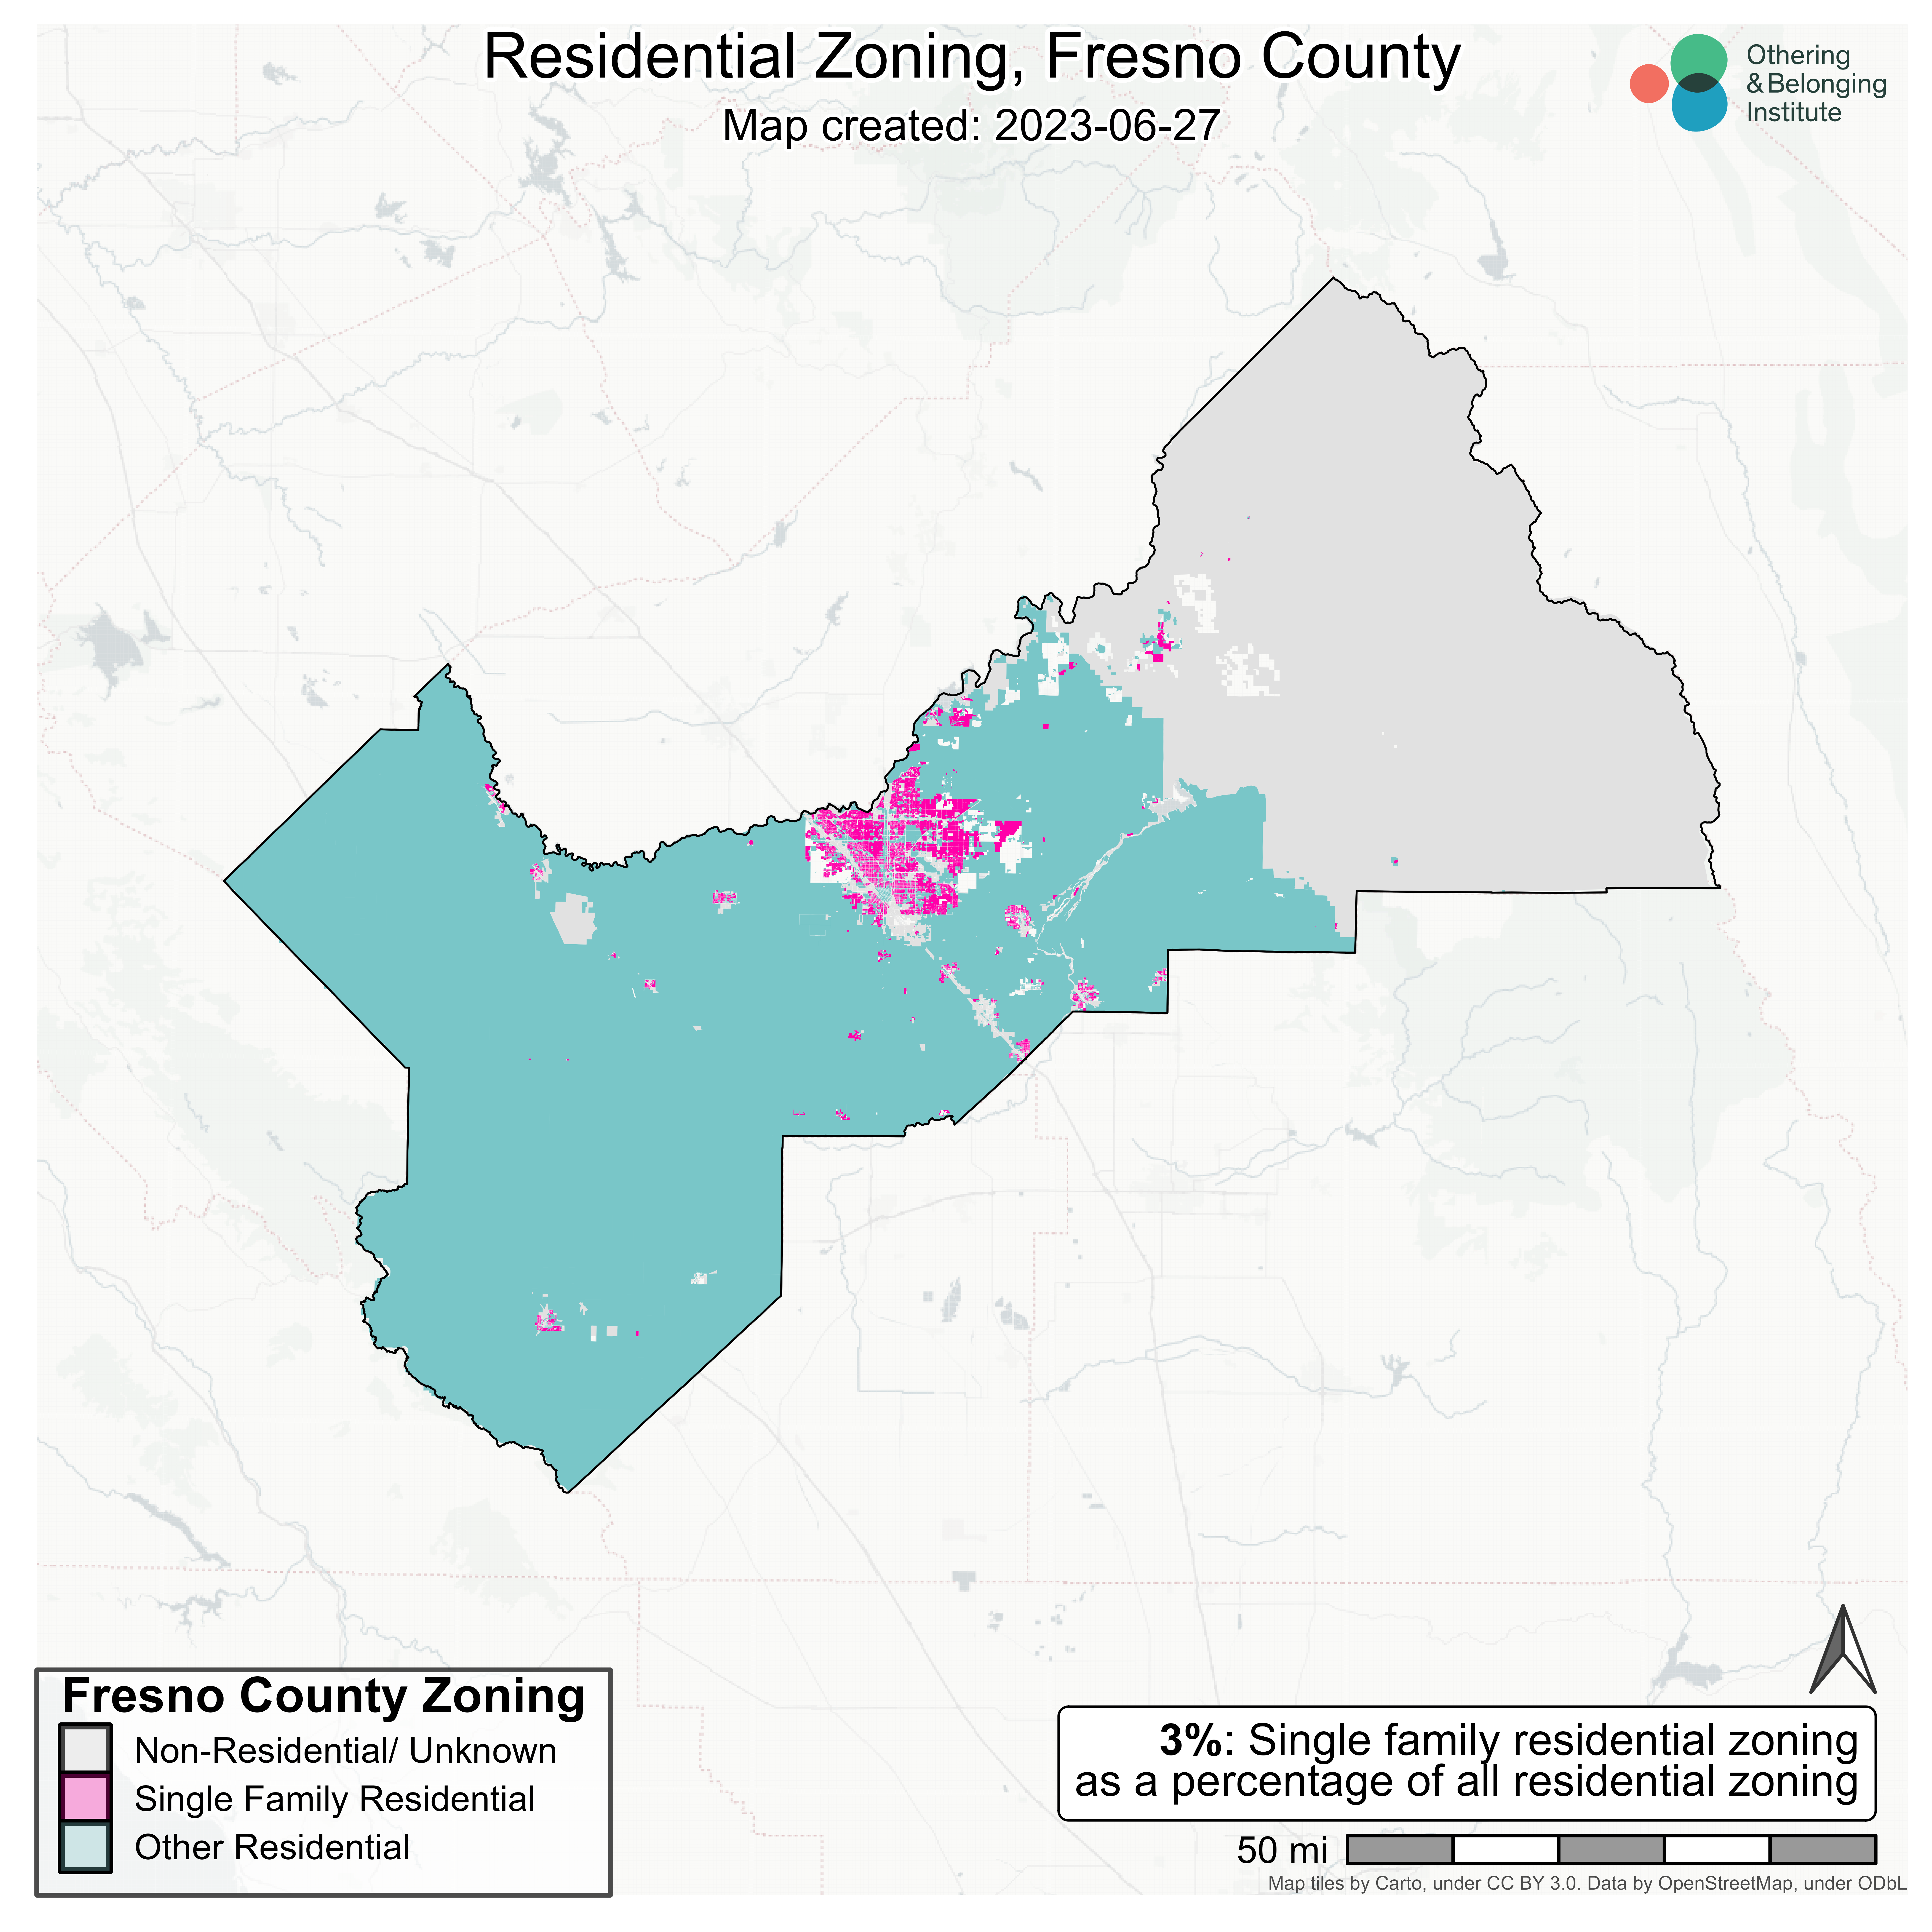
Figure 2: Zoning in Incorporated Fresno County
Our construction of the maps and analysis follows a similar methodology to that of our prior regional reports. Rather than reiterate the numerous challenges to creating zoning maps and our methodological approach, we direct your attention to the appendix to this report, where we summarize both.
An Overview of Single-Family Zoning in the Fresno region
We find that single-family-only zoning is strikingly smaller (in proportional terms) of residential zoning in Fresno than in the previous California regions we have analyzed. The scale of this difference is dramatic, and points to a successful shift towards multi-family residential zoning. In fact, incorporated Fresno’s percentage of residential land available for multi-family housing, at 25.36 percent, is the highest of all previously analyzed regions (see Table 1 below), followed by Los Angeles at 23.10 percent.
Table 1: Fresno Region Zoning vs. other California Regions
| Region | # of jurisdictions | % of SFZ of residential land | % SFZ of all Land | % of residential land available for multi-family housing | % of land available for multi-family housing |
|---|---|---|---|---|---|
| SF Bay Area | 101 | 85.00% | 47% | 14.90% | 2.7% |
| Los Angeles | 191 | 77.70% | 41% | 23.10% | 11.8% |
| Sacramento | 22 | 77.00% | 42% | 19.09% | 12.10% |
| San Diego | 18 | 74.74% | 39.7% | 21.70% | 10.78% |
| Monterey | 21 | 93.45% | 37.52% | 0.71% | 0.30% |
| Fresno | 16 | 2.95% | 1.85% | 0.28% | 0.17% |
| Fresno (Incorporated Areas only) | 15 | 56.28% | 26.06% | 25.36% | 11.71% |
Because unincorporated Fresno has markedly different statistics from the incorporated jurisdictions in the region, we present Fresno statistics in two rows in Table 1, combined, as incorporated and unincorporated Fresno, and separately just as incorporated Fresno. From either view, the data is strikingly different from the other regions we’ve surveyed and analyzed.
Specifically, we find that 56.28 percent of incorporated residential land in the county is reserved for single-family housing, and that only 26.06 percent of all incorporated land is zoned as such. Single-family zoning as a percentage of residential land is lower in unincorporated areas than within incorporated areas, a fact cataloged most starkly in Figure 1’s abundance of cyan (representing multi-family zoning).
Danielle Bergstom, the founder of Fresnoland, a nonprofit newsroom that covers local policy, has noted that Fresno “has been at the forefront of streamlining zoning” using by-right approvals, at least in Downtown Fresno, to augment housing supply.4
But, despite Fresno breaking new ground for the state in terms of retreating from high single-family zoning housing, it is important to keep in mind that unincorporated multi-family zoned areas are remote, undeveloped, and far away from population centers. Nonetheless, the disparity and difference from previous regions in our analysis is striking and worthy of further investigation and analysis.
Comparative Regional Analysis
Now that we have conducted similar analyses across the state, it is interesting to compare regions, as depicted in Table 1 above. As this table illustrates, Fresno county features the lowest percentage of residential land reserved for single-family zoning of all the regions we have studied so far by a significant margin.
While this is a positive development, it's also challenged by the magnitude of multi-family zoned parcels in remote, unincorporated Fresno which skews the county’s overall figure. Unincorporated Fresno is 47 times the size of Fresno county’s incorporated areas causing zoning policy there to skew regional numbers considerably. On the other hand, single-family zoning as a percentage of residential land in incorporated Fresno is 52.68 percent, more in line with statistics from previous regions but still lower and certainly worth acknowledging as a positive change.
Fresno county ranks fourth among California counties with the highest percentage of population below the poverty level at 19.5 percent.5 Other evidence also points to growing housing cost burdens in addition to well-known and stark urban as well as rural poverty, and spatial segregation.6 The City of Fresno, the county’s seat, is known to be majority-minority, and takes the title of “California’s poorest large city.”7
Zooming in further, the City of Fresno is home to racial inequalities stemming from historic redlining, the development of Highway 99 in the 1950s – called “Fresno’s Berlin Wall” – which tore Western Fresno from the rest of the city, and chronic and systemic underinvestment in areas populated by minorities. This has resulted in Northern Fresno's largely White area witnessing starkly better living conditions than South West Fresno, largely settled by Black, Latino, and Hmong populations. As an example, in just 15 miles, life expectancy varies by 20 years from South West Fresno (70 years) to North Fresno (90 years).
The COVID-19 pandemic spurred individuals to move to the county owing to relatively lower costs of living and homeownership; it was one of only five counties in California to gain population during the pandemic8 since rents and the share of unhoused people have both gone up.9 The National Low Income Housing Coalition finds that renters in nearly all zip codes in the City of Fresno – the county’s most populous city and California’s fifth most populous – must earn many times the state’s minimum wage to afford a two-bedroom rental home. In some zip codes, the hourly wage-to-rent multiple reaches as high as 2.3 (i.e., to rent an average two-bedroom house, workers must earn 2.3 times the state minimum wage).10 Another similar analysis from real estate knowledge platform, SmartAsset, finds that the City of Fresno ranks eighteenth on the nation’s list of “Most Housing Burdened Cities.”11
Given this, even though the county performs better than previous regions we have analyzed, the stakes for effective and continued zoning reform in Fresno could not be higher. Effective county-wide zoning reform can play a vital role in mitigating stark segregation, and offer relief from urban and rural poverty. Next, we identify cities in Fresno County that are suitable candidates for such reform.
Table 2: Key Single-Family Zoning Statistics
| % of residential land | % of all land | |
|---|---|---|
| Mean | 61.63% | 33.94% |
| Median | 64.06% | 37.17% |
| Maximum | 85.90% (Sanger) | 72.72% (Clovis) |
| Minimum* | 29.52% (Parlier) | 4.83% (Selma) |
*Excluding Fresno’s unincorporated areas
Identifying Cities for Reform
As in our previous regional reports, we attempt to identify cities that may be the stronger candidates for zoning reform in the region. In our previous reports, we applied several simple selection criteria to identify jurisdictions that would be excellent candidates for zoning reform. In addition to those same factors, we are also adding an analysis of the city’s racial and economic demographics relative to the region.
The criteria we have previously used to select jurisdictions that would serve the region by reforming their zoning regulations included:
1) The percentage of single-family-only zoned residential areas
The greater the proportion of single-family-only residential zoning, the more likely it is that a jurisdiction is excessively restrictive and should permit greater density. This indicator selects only jurisdictions with a high or extremely high level of single-family-only zoned areas.
2) The percentage of the jurisdiction that is designated as “high opportunity” on the state’s COG-based opportunity maps
The Tax Credit Allocation Committee’s official opportunity maps already guide the state’s allocation of federal subsidies for affordable housing, and for that reason are useful indicators for identifying jurisdictions with a high degree of opportunity.12 Jurisdictions with a greater share of high-opportunity neighborhoods are better targets for reform in relation to equity objectives. Here, we chose municipalities with 85 percent or higher neighborhoods designated high-opportunity areas.
3) Distance from regional economic centers (central business districts)
This indicator is a proxy for access to jobs. Upzoning areas that are remote or difficult to access makes far less sense than upzoning neighborhoods that are already accessible and proximate to jobs and businesses. Therefore, we excluded jurisdictions too remote from job centers as places to prioritize reform. We selected municipalities where the commute is 40 minutes or less from the nearest central business district. There are other, possibly more direct measures of job proximity, but this measure has the additional benefit of reflecting significant existing transit infrastructure. Central business districts are accustomed to accommodating large numbers of daytime workers. We apply this criteria both in terms of distance and travel time.
4) Poor performance with RHNA targets
The Regional Housing Needs Assessment (RHNA) requires that every jurisdiction in the state plan for housing at five different income levels: "very-low," "low," "moderate," "above-moderate," and “high.”13 Jurisdictions are required to zone for local needs, but in practice, jurisdictions do not meet their RHNA requirements.14 Jurisdictions that perform especially poorly with respect to RHNA targets for low and very-low income housing are excellent candidates for zoning reform because government agencies have already determined that they should have a greater share of affordable housing developments. Table 3 below displays our results.
Table 3: Jurisdictional Candidates for Zoning Reform and Selection Indicators
| Cities | Single Family % | % of Neighborhoods in High Opportunity Category | RHNA Low & Very Low Income Completion15 | Minutes from CBD | Miles from CBD16 |
|---|---|---|---|---|---|
| Fowler | 84% | 100% | 0% | 15.8 | 10.2 |
| Clovis | 84% | 91% | 0% | 14.9 | 8.3 |
| Sanger | 84% | 25% | 0% | 22.5 | 13.0 |
To summarize, we conclude that Fowler, Clovis, and Sanger are jurisdictions most urgently in need of zoning reform based on our four-factor criteria.
Notably, all three jurisdictions have met 0 percent of their RHNA targets, are close to the region’s central business district, and feature the region’s second-highest single-family zoning percentage at 84 percent.
This does not mean that other jurisdictions should not also consider it, but this suburban jurisdiction presents the most extreme case in the county. Clovis has a population of 124,000 people, and is majority White.17 While Clovis is part of the Fresno Metro area, Fowler and Sanger are suburban communities. The former is located around 10 miles south of the City of Fresno, is home to around 7,000 people, and is majority Latino (67 percent).18 The latter, Sanger, is located around 13 miles East of the City of Fresno, and home to around 26,000 people.19
In addition, Fowler follows Fresno county’s race and income statistics indicating high diversity but low incomes as compared to the California, and county averages. Table 4, below, compares Fowler in terms of race and income to the region, and the state as a whole.
Table 4: Jurisdictional Candidates by Race and Class20
| Jurisdiction | % White | % Black | % Latino | % Asian | Median Income | Median Home Values |
|---|---|---|---|---|---|---|
| California (state) | 34.26% | 5.28% | 40.15% | 14.97% | $84,097 | $573,20021 |
| Fresno County | 26.34% | 4.10% | 54.72% | 10.58%22 | $63,65623 | $288,10024 |
| Fowler | 20.24% | 1.25% | 66.85% | 9.49% | $59,663 | $268,200 |
| Clovis | 48.78% | 2.39% | 30.50% | 12.13% | $84,119 | $341,800 |
| Sanger | 12.19% | 0.69% | 82.12% | 3.03% | $52,349 | $257,900 |
As you can see, median income and median home values in Fowler and Sanger are much lower than the California average indicating poverty relative to the region and the state, translating into fewer opportunities to create wealth, especially in terms of homeownership. The division of race in these three cities is also notable. Sanger and Fowler are majority Latino, and home to lower median incomes of the three reform cities whereas Clovis is home to more racial diversity. This mix highlights the role zoning can play in wealth and income redistribution along racial lines in Fresno. This does not mean that zoning reform alone will do so and make these places more diverse, inclusive, and equitable, but it is a necessary first step.
Conclusion
As with our previous studies, the Fresno region’s residential areas feature significant single-family-only zoning, stifling the development of denser housing options, perpetuating racial and economic exclusion, and shaping access to opportunity for millions of Californians. Despite this, Fresno has the lowest relative proportions of such restrictive zoning of any region we’ve yet surveyed. This is a surprising and significant finding. It bears further investigation of why this came to be, and what lessons can be learned for other regions of the state.
This sixth regional report is the final one in this series of detailed investigations of the extent of restrictive and exclusionary zoning across specific regions of California. As indicated in the Monterey report, we are now working towards the statewide zoning atlas whose outputs are expected to be a statewide map, and a citywide databases containing zoning information. We expect to publish these outputs sometime in 2024. We will then create a summary analysis for the entire state, and publish the state’s remaining zoning maps.
This report also accompanies a GitHub repository containing the data used for this analysis. Similar data from our previous reports is now accessible as well. If you explore the data, or if you have any questions, please email us at HousingOBI@berkeley.edu.
APPENDIX: CHALLENGES & METHODOLOGY
Challenges
There are many daunting research challenges to studying municipal zoning. Foremost among them is the lack of consistent classifications or base formulae for zoning designations from which they may be derived. Zoning codes are generally dense, technical, and difficult to access. While there may be strong similarities in zoning taxonomies across jurisdictions with land use authorities, the particulars of each zoning code are often idiosyncratic to the jurisdiction. Certain designations may mean different things in different jurisdictions. This means that studying regional zoning patterns requires tedious and time-intensive effort to produce accurate data.
There are shortcuts researchers can use to gather data, but they lack precision. The most common and widely relied upon shortcut is the use of survey instruments (e.g. the Wharton Regulatory Land Use Index). We summarized notable zoning surveys, going back to the 1970s, and their respective strengths and limitations, in our Bay Area report.25 Although there are a number of other proposed methodological shortcuts, including restricting analysis to a sample of cities using American Community Survey samplings of housing units within cities, or drawing inferences about zoned density from property tax records, the vast majority of research conducted on this issue relies upon these survey instruments.26
While these surveys may be generally useful, there is evidence to suggest that their results contain systematic errors, partly due to the inaccurate perception of the survey respondents.27 These surveys also suffer from lack of reliability, since, in many cases, respondents fail to complete the survey, creating holes in the datasets.28 These instruments are also limited and tend to focus on the largest jurisdictions, meaning that smaller municipalities are less likely to be included. This may be another source of systematic bias in such data, since smaller municipalities may have a greater share of restrictive zoning.
Another challenge to studying zoning is that zoning ordinances and codes do not necessarily indicate actual zoning, especially for planned developments. Planned development is typically a designation that allows for more flexible or dynamic zoning and land use, where planners anticipate or intend future development. The intended use for such parcels may not be defined in the municipal zoning code, meaning that it has to be observed directly.
A related problem is that zoning codes do not always reflect the built environment, and vice versa. This is probably the single biggest source of confusion regarding our zoning maps, as evidenced from inquiries we have received about them. Our maps and analyses are of zoning, not the built environment. While the actual built environment may be the most relevant piece of information for some purposes (such as researchers or policymakers who are primarily concerned with the production of housing), our research is focused on better understanding how zoning designations themselves shape or correlate with certain community characteristics and life outcomes.
So-called “non-conforming uses,” which create a divergence between the built environment and zoning laws, exist for many reasons. Some developments, especially older ones, may have been constructed before zoning codes were adopted or prior to a down-zoning of the neighborhood to prevent new, higher density developments. Developers of more recent developments may petition for, and receive, a “spot variance,” which is permission to build at a higher density or taller than what is permitted by ordinance. Certain state laws, like density bonus laws, may similarly create override mechanisms that generate non-conforming structures. One cannot easily scan an environment and accurately infer a zoning designation.
Methodology
Because we are specifically interested in the effects and/or correlates of restrictive zoning itself, and most of the zoning codes were idiosyncratic across municipalities, for purposes of this report, we simplified zoning designations into three broad categories: Single Family Residential, Other Residential, and Non-Residential/Unknown, defined as follows:
Single Family Residential is land designated for detached, single-family residential land use (one or two dwelling units per parcel of land) in both low and high density. This includes single-family homes and two-family detached dwellings, and usually includes single-family zones, low-density zones, agriculture zones (if single-family homes are permitted) or estate zones. The zone is not classified as single-family residential if it only permits the following: caretaker’s residence, employee housing, or live-work unit.
- Single Family Residential is land designated for detached, single-family residential land use (one or two dwelling units per parcel of land) in both low and high density. This includes single-family homes and two-family detached dwellings, and usually includes single-family zones, low-density zones, agriculture zones (if single-family homes are permitted) or estate zones. The zone is not classified as single-family residential if it only permits the following: caretaker’s residence, employee housing, or live-work unit.
- Other Residential includes both multi-family residential and mixed-use residential.
- Multi-family residential is land designated to allow for multiple dwelling units per parcel of land. This includes apartment buildings, duplexes, triplex, fourplex, townhouses, condos, mobile home parks, and two-family attached dwellings. Additionally, if a zone’s intent allows for both single-family homes and any of the multi-family housing above, it is sorted into the multi-family category. This category does not include employee housing and student housing.
- Mixed-Use Residential is land designated to blend multiple uses that includes residential use. This includes mixed-use commercial zones permitting residential use, zones allowing multi-family buildings with commercial spaces (e.g., on the group floor), and zones where residential use and other non-residential uses such as commercial or industrial uses are both permitted.29
- Non-Residential is land that is designated for non-residential uses. This includes parks and open space, commercial, industrial, and public land. Non-developable land was removed from the overall land area, including water, waterways, marshland, and highways or streets.
Municipal zoning code documents are the primary source to identify each zoning category for each city, describe the purpose of each, and list what is permitted to be built in each of these zones. We utilized these documents for each city to recode each zone into the typology listed above. Based on city ordinances for each unique zone in each municipality, we recorded the type of housing development permitted and conditionally permitted as follows:
P: permitted as right. We did not include building types that were permitted for accessory use only.
C: conditionally permitted; requires review; requires minor use permit
We prioritized and focused on the intent and the purpose of the zone to sort the zones into one of the three categories: non-residential/unknown, single-family, and other residential. For example, a residential zone intended for both single-family and multi-family developments would be classified in the other residential category (which includes multi-family zones), even if multi-family is only conditionally permitted. This is because the zone’s intention was for both single-family and multi-family developments.
When the intent and purpose of the zone was unclear, we classified the zone based on what is permitted in the zone. For example, consider a “general residential” zone that does not specify whether it is strictly for single-family homes in its intent. If it permits single-family homes but only conditionally permits multi-family homes, it would be classified in the single-family category. And if it permits both single-family homes and multi-family homes, it would be classified in the other residential category. Since we prioritized the zone’s stated intent and purpose in the city ordinance, we would only rely on the permitted use if the intent and purpose was unclear.
We accessed parcel-level zoning data primarily from shapefile repositories maintained by individual municipalities, in addition to the repositories maintained by The California Governor’s Office of Planning and Research (OPR).30 We applied our classification of simplified zoning categories to the zones found in these zoning shapefile for each city.
Once we obtained the zoning shapefile, we created a list of all zoning codes available within the shapefile. We used the description of each zone in the municipal code document, and re-coded each of those to one of the three categories listed above. We then applied our simplified typology to each of the parcels in the shapefile. We mapped the data to display this typology.
We realize that our simplified taxonomy of myriad zoning designations into three categories (in order to draw out the degree to which single-family-only zoning predominates residential areas) conceals many other aspects of zoning codes that impede or restrict development or certain types of developments. For example, height limitations, setback requirements, discretionary reviews, parking requirements and the like can all inhibit density, even in multi-family residential or mixed-use zones. For that reason, in constructing this tranche of maps, we have separately created a database of additional zoning characteristics for each jurisdiction, which we will release at a future point in completing a statewide zoning atlas for California. Until then, our focus is on single-family-only residential zoning as the principal form of restrictive and exclusionary zoning.
Additional notes on methodology are below.
Quality check procedures: Human errors could impact the quality of the analysis so it was important to establish data quality checking protocols to reduce any human errors. We followed these procedures at different stages of data collection and classifying our zoning categories.
Once the zoning codes were extracted from the shapefiles and were re-coded to our three simplified zoning categories, another team member conducted a spot check to ensure the extraction and coding was done properly and with internal consistency. We cross-checked our final maps against the zoning maps provided by the city to ensure our processing was accurate.
Though attempts were made to minimize any human error while interpreting various zoning codes and recoding those to our simplified categories, it was beyond our capacity to check the input data for accuracy. We were not able to check that the zoning shapefiles used for this analysis had the data entered correctly. We solicit any inputs or suggestions from the general public or city departments to highlight any inconsistencies in identifying the correct zoning categories and/or share updated zoning data to ensure our mapping and analysis are accurate.
***
The California Governor’s Office of Planning and Research (OPR) makes no warranty, representation or guarantee as to the content, sequence, accuracy, timeliness, or completeness of any of the data provided herein. This data has been compiled from a variety of sources, collected and maintained for different purposes, at different times. This data was compiled and analyzed by OPR through grant funding provided by the U.S. Department of Defense Office of Local Defense Community Cooperation (OLDCC).
This information should not be used as a substitute for legal, accounting, real estate, business, tax, or other professional advice. It should not be used as a substitute for information sourced directly from local planning authorities. The User expressly agrees that the use of the data provided herein is at the User’s sole risk.
In no event shall OPR be liable for any claim, damages or other liability, whether in an action of contract, tort or otherwise, arising from, out of or in connection with the data or the use or other dealings in the data.
- 1The authors would like to thank Joshua Cantong, Data Analyst at the Othering and Belonging Institute for their valuable insights and contributions. We also extend gratitude to the Center for Regional Change at UC Davis, to Prof. Catherine Brinkley, Clancy McConnell, and to their team of students, namely Aleksandra Kalnozola, Anthony La, Miri Kim, and Tara Safavian for helping collect zoning data for the Fresno region.
- 2U.S. Census Bureau; American Community Survey, 2020 American Community Survey 5-Year Estimates; generated by Shahan Shahid Nawaz; using R (tidycensus); <https://data.census.gov/cedsci/> (8 April 2020).
- 3U.S. Department of Agriculture, 2017 Census of Agriculture County Profile: Fresno County, California, United States Department of Agriculture National Agricultural Statistics Services (2017), https://www.nass.usda.gov/Publications/AgCensus/2017/Online_Resources/County_Profiles/California/cp06019.pdf.
- 4Danielle Bergstrom et al., “Legalize Everything: Lessons From Fresno on Housing Affordability,” panel, moderated by Ben Christopher, CalMatters, June 15, 2023, video, 57:00, https://events.calmatters.org/fresno-housing.
- 5U.S. Census Bureau, “Poverty in California by County in 2021,” United States Census Bureau, accessed September 10, 2023, https://data.census.gov/table?q=poverty+in+california+by+county+in+2021&g=040XX00US06$0500000&tid=ACSST1Y2021.S1701&moe=false&tp=true
- 6Reis Thebault, “Fresno’s Mason-Dixon Line,” The Atlantic, August 20, 2018, https://www.theatlantic.com/politics/archive/2018/08/fresnos-segregation/567299/.
- 7Thebault, “Fresno’s Mason-Dixon Line.”
- 8Tim Sheehan, “While California’s population dropped, more people came to Fresno. Here’s the data,” The Fresno Bee, May 7, 2021, https://www.fresnobee.com/news/local/article251240099.html.
- 9Dani Anguiano, “How one of California’s cheapest cities became unaffordable: ‘the housing market is broken’,” The Guardian, November 6, 2021, https://www.theguardian.com/us-news/2021/nov/06/fresno-housing-prices-rent-california.
- 10“Two-Bedroom Housing Wage by Zip Code,” National Low Income Housing Coalition, accessed September 7, 2023, https://nlihc.org/oor/zip?code=93710.
- 11Anja Solum, “Where Residents Are Most Severely Housing Cost-Burdened – 2022 Edition,” SmartAsset, July 28, 2022, https://smartasset.com/data-studies/where-residents-are-most-severely-housing-cost-burdened-2022.
- 12This opportunity map uses the same methodology as the state’s TCAC Opportunity Map, but all tracts within Councils of Governments (COGs) are scored against each other. Tracts that do not fall within a COG are scored against tracts within their county. By comparison, the TCAC opportunity map uses TCAC regions as the reference geography. The TCAC/HCD map also scores rural areas separately because rural affordable housing developments compete in a separate funding pool, but such a distinction is not made here.
- 13“Regional Housing Needs Assessment,” Sacramento Area Council of Governments, https://www.sacog.org/regional-housing-needs-allocation-rhna.
- 14Heather Bromfield and Eli Moore, Unfair Shares: Racial Disparities and the Regional Housing Needs Allocation Process in the Bay Area, (Berkeley, CA: Haas Institute for a Fair and Inclusive Society, 2017), http://belonging.berkeley.edu/sites/default/files/haasinstitute_unfairshares_rhnabayarea_publish.pdf.
- 15Division of Housing Policy Development, “Annual Progress Report Permit Summary Table (K2 - AN542),” RHNA 5th Cycle Full Summary, (Sacramento, CA: California Department of Housing and Community Development, 2019), https://www.hcd.ca.gov/community-development/housing-element/docs/annual_progress_report_permit_summary.xlsx. For a grade ranking of cities by RHNA performance, see Nikie Johnson and Jeff Collins, “Report Card: California Cities, Counties Failing Again on Affordable Housing Goals,” Orange County Register, January 31, 2021, https://www.ocregister.com/2021/01/31/report-card-california-cities-counties-failing-again-on-affordable-housing-goals/.
- 16Central Business District Coordinates Dataset (2013), distributed by Daniel Hartley, https://www.danielaaronhartley.com/.
- 17U.S. Census Bureau, “Clovis City, California” QuickFacts, accessed September 10, 2023, https://www.census.gov/quickfacts/fact/table/cloviscitycalifornia.
- 18U.S. Census Bureau, “Fowler City, California,” QuickFacts, accessed September 10, 20232, https://www.census.gov/quickfacts/fowlercitycalifornia.
- 19U.S. Census Bureau, “Sanger City, California,” QuickFacts, accessed September 10, 2023, https://www.census.gov/quickfacts/fact/table/sangercitycalifornia.
- 20These figures are based on 2021 American Community Survey 5-year estimates.
- 21U.S. Census Bureau, “Median value of owner-occupied housing units, 2017-2022 – California,” QuickFacts, accessed September 10, 2023, https://www.census.gov/quickfacts/fact/table/CA/HSG495221.
- 22Population totals and ratios from: U.S. Census Bureau, “B03002, Hispanic or Latino Origin by Race,” United States Census Bureau, accessed September 10, 2023, https://data.census.gov/table?t=Hispanic+or+Latino:Race+and+Ethnicity&g=050XX00US06019&tid=ACSDT1Y2021.B03002.
- 23U.S. Census Bureau, “Fresno County, California,” United States Census Bureau, accessed September 10, 2023, https://data.census.gov/profile/Fresno_County,_California?g=050XX00US06019.
- 24U.S. Census Bureau, “DP04: Selected Housing Characteristics,” United States Census Bureau, accessed September 10, 2023, https://data.census.gov/table?g=050XX00US06019&tid=ACSDP5Y2021.DP04.
- 25For greater detail on notable zoning surveys, see footnote 4 in Stephen Menendian et al., "Characteristics of Exclusionary Communities" in Single-Family Zoning in the San Francisco Bay Area (Berkeley, CA: Othering & Belonging Institute, 2020), https://belonging.berkeley.edu/single-family-zoning-san-francisco-bay-area.
- 26See report section “Difficulties with Zoning Research and Limitations of Existing Zoning Datasets” in Menendian et al., "Characteristics of Exclusionary Communities," focused on the paragraphs that contain footnotes 5-9. For an example of a report presenting zoning figures using the ACS sampling, see: Western Economic Services LLC, 2015 Suffolk County: Analysis of Impediments to Fair Housing Choice, (Suffolk County Department of Economic Development and Planning, 2015), 39, https://suffolkcountyny.gov/Portals/0/formsdocs/ecodev/Community%20Development/AI%20final%20draft%202015.pdf?ver=2015-10-22-115354-200. As part of the research we conducted for this report, we compared the ACS sampling of the percentage of single-family residential units in the greater LA region with our manually collected zoning data. Given that the unit used for the ACS survey is in housing units as built, the results are very different from ours where we used the unit of residential land as zoned. Here is a link to the scatterplot, which illustrates the difference, and should be a warning to researchers relying on such shortcuts.
- 27Menendian et al., “Characteristics of Exclusionary Communities," citing Moira O’Neill, Giulia Gualco-Nelson, and Eric Biber, Comparing Perceptions and Practice: Why Better Land Use Data is Critical to Ground Truth Legal Reform, (Berkeley, CA: The Terner Center for Housing Innovation, 2019), https://ternercenter.berkeley.edu/blog/comparing-perceptions-land-use-data.
- 28Sara C. Bronin, “Zoning by a Thousand Cuts: The Prevalence and Nature of Incremental Regulatory Constraints on Housing,” Cornell Journal of Law and Public Policy (2021): 23, https://papers.ssrn.com/sol3/papers.cfm?abstract_id=3792544.
- 29The approach used in the present study differs slightly from our Bay Area single-family zoning study mentioned earlier. In our Bay Area report, mixed-use commercial zones were categorized as part of the “Non-residential” category if the zones were dominated by commercial uses regardless of whether residential uses are allowed. In our present study, commercial mixed-use zones are classified as “Other residential” if these zones permit residential uses according to the city ordinance, regardless of the dominant uses as suggested by the built environment. The rationale behind this divergence is our intention for the results in the present study to reflect the zoning code text even more directly, instead of basing it on the built environment, as was the approach we used in a few ambiguous mixed-use zones in our Bay Area study. We do not believe that this significantly changes the overall results or the comparability of the maps, but we note it nonetheless.
- 30The California Governor’s Office of Planning and Research (OPR) and the U.S. The Department of Defense Office of Local Defense Community Cooperation (OLDCC) provided the zoning data for OPR’s research.