Introduction*
Racial segregation is a complex, multi-faceted phenomenon that shapes the life chances of individuals based upon their racial identity, and thereby is the root cause of inter-group racial inequality. Residential racial segregation, in particular, spatially arranges and structures access to a range of services, amenities, public goods and other resources, including schools, jobs, public transportation and infrastructure, health care providers, healthy food, and much more. This series investigates the problem of racial segregation in the San Francisco Bay Area using original research and novel methodological tools.
Part 1 of this series was the first published report to illustrate the degree of residential racial segregation across the San Francisco Bay Area for multiple racial groups simultaneously. Using a relatively novel measure of segregation, we were able to calculate and map the level of segregation in every census tract in the nine-county Bay Area, and to represent that segregation relative to the region as a whole, to each of the nine counties, and to the two major metropolitan areas, all in a way that accounted for each of the major racial groups simultaneously.
Using this measure of segregation, we were able to identify communities that would be regarded as traditionally “segregated,” such as predominately non-white communities in historically disadvantaged neighborhoods, as well as identify neighborhoods in predominantly white communities that were just as segregated. As we said in Part 1, “Non-white and white segregation are reciprocal; they are flip sides of the same coin.” This approach, however, may obscure particular forms of segregation or extreme cases that would be revealed by using a more traditional measure. For that reason, the next brief in this series will juxtapose several measures of segregation to provide a more comprehensive portrait of segregation in the Bay Area.
Since the release of Part 1 of our report, the Association of Bay Area Governments has released a complete list of the most ‘diverse’ cites in the Bay Area, with a demographic breakdown of each city using the same classification system as this series. As Part 1 of this series illustrated, however, diversity and integration are not the same thing. Many diverse cities, such as Oakland, San Francisco, and Berkeley are nonetheless very segregated at the neighborhood level.
As we saw in the first part in this series, segregation runs deep and wide through the San Francisco Bay Area. Nonetheless, it is one of the more diverse regions of the country, with large and historic communities of white people, Black people, Latinos, and Asians. A broad view of segregation can mask specific racial demographic patterns within the region. To address that problem, in this part of our series, we will present and describe demographic patterns for five major ethno-racial groups, both presently and historically.1 In some cases, the maps we will introduce in this brief even better illustrate the degree of racial isolation and concentration experienced by different groups than the segregation maps.
We wish to emphasize that racial demographics and racial segregation are not the same thing, although they are often conflated or represented as the other.2 Many well-meaning efforts purporting to map racial segregation are often merely racial demographic maps rather than illustrating racial segregation itself. Other efforts to map segregation itself are only able to represent segregation levels for just two groups at a time, such as Black-white segregation. The maps we created for Part 1 of this series overcame these deficiencies by mapping segregation itself and for multiple groups simultaneously.
Unlike the first report in this series, which examined the level of racial segregation by geography, this report is focused on racial demographics rather than racial segregation. Organized into five sections each focused on a different racial or ethnic group, this report will describe racial demographic patterns in the Bay Area as a way of contextualizing the patterns of racial segregation examined in Part 1. Although there are many published reports describing racial demographics in the Bay Area, most of those efforts were undertaken to understand the issue of racial demographics in relation to some specific problem, such as rates of foreclosures, employment, or health. Our report is focused exclusively on racial demographics and demographic change, and is therefore more comprehensive in that regard.
The Bay Area is a vibrant region of more than 7 million people. This report includes both a static look at contemporary racial demographics as well as an examination of demographic changes over time. Each section of this report reviews the extant demographic realities within the Bay Area as a region for each racial group, and then within specific counties to illustrate the nature of the recent demographic change. We will describe historically significant events that have shaped these patterns, and we will list the most populous cities in each county for each racial group.
In addition to line graphs that illustrate changing demographics in relative and absolute terms, where useful, we will present “population change” maps that vividly illustrate these patterns. For each racial group, we will present two maps illustrating racial demographic change. First, we will map regional demographic change for that group for the region as a whole. For African Americans, we will show regional change from 1980 to 2010. For Asians, we will show regional change from 2000 to 2010. For Latinos, we will show regional change from 1990 to 2010. And for whites we will show regional change from 1990 to 2010. We will then contextualize this reality with a look at patterns of racial isolation and concentration. We will complement these observations with a description of the historical context in which these changes occurred.
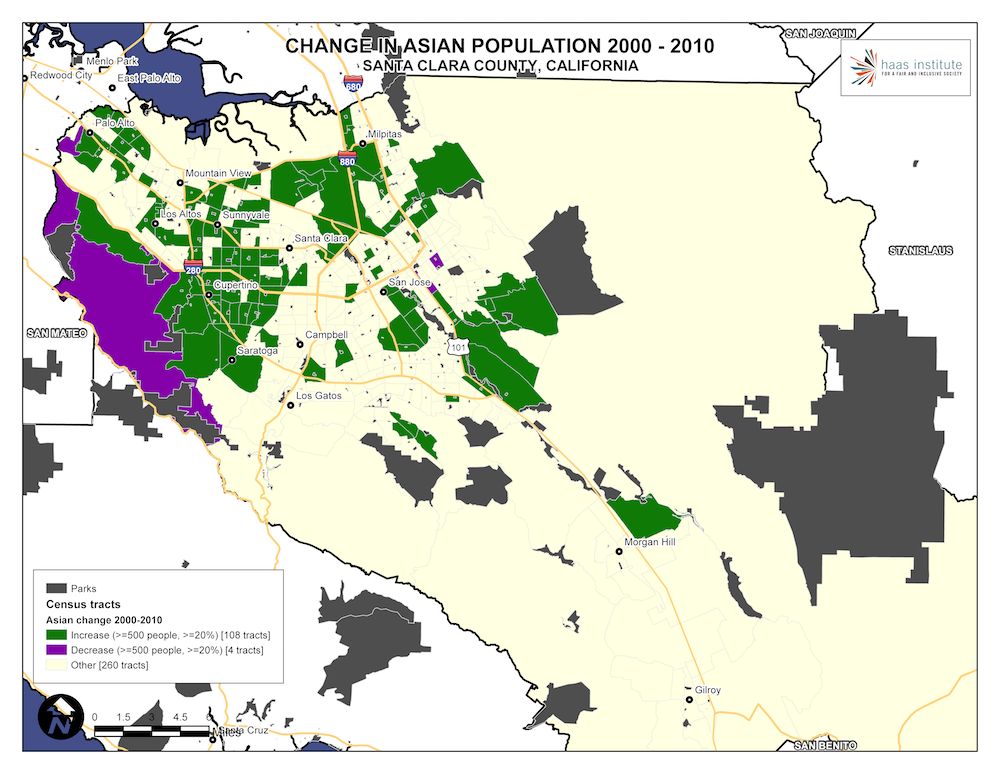
Secondly, we will “zoom in” to a particular county that especially and most vividly illustrates these demographic changes. For African Americans we will look at Alameda County. For Asians, we will look at Santa Clara County. For Latinos, we will look at Contra Costa County. For whites, we will look at San Francisco County. Again, we will offer specific observations where possible.
As always, we welcome your questions or feedback on this report or this series at belonging@berkeley.edu. Some important matters, in addition to citations, are reserved for endnotes, so please review those as needed.
African Americans in the Bay Area
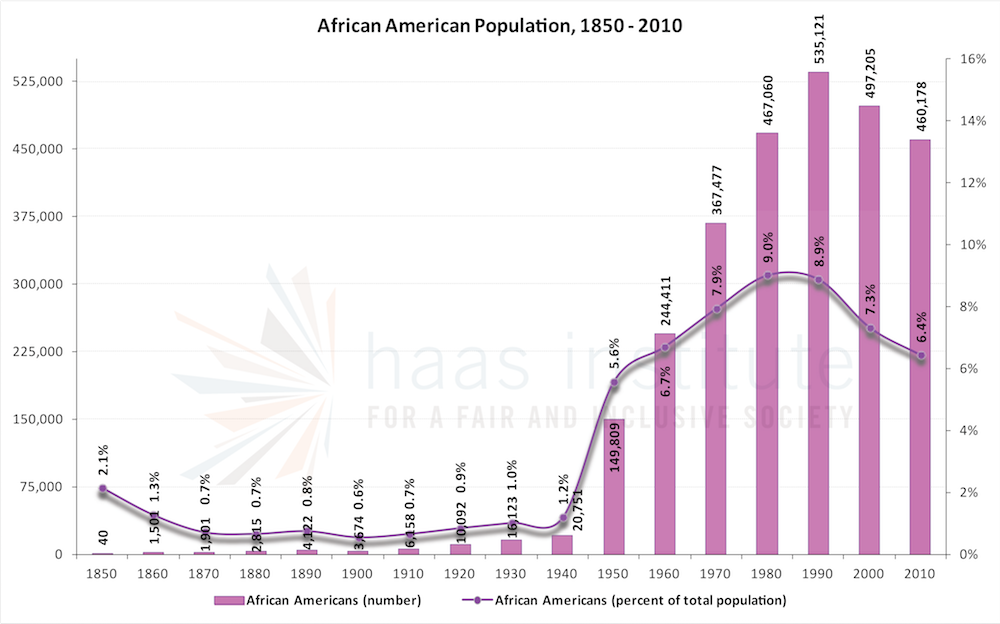
African Americans are a significant, but declining portion of the population of the San Francisco Bay Area, in both absolute and relative terms. As of 2010, there were slightly more than half a million African Americans in the Bay Area, down from the peak of nearly 550,000 in the 1990s, and constituted 6.4 percent of the overall population.
The following line graph and bar chart illustrates the changes in the composition of African Americans in absolute and relative numbers. As the graph indicates, the numbers of African Americans rose significantly during the middle decades of the twentieth century, and have declined slightly in absolute numbers, even as their numbers fall even further in relative terms.
African Americans moved into the Bay Area in large numbers during the second wave of the Great Migration, which lasted roughly from 1940 to 1970. The largest wave occurred not simply because of industrialization writ large, but because of the war mobilization and massive federal investment in shipbuilding and other war-related industries. This drew African Americans to the region, primarily from Louisiana, Arkansas, and Texas.3
African Americans settled in San Francisco, Oakland, Richmond, and other places near the war corridor. This corridor, which runs from Richmond through Berkeley and Oakland, was historically the “center of black life in the Bay Area.”4 Despite the migration of so many African Americans to the Bay Area in the post-war period, these workers were sharply restricted where they were permitted to live by force, fraud, and law. This was the determinative factor in creating segregation in the Bay Area.5 In addition, however, other forms of segregation reinforced the general pattern. Antioch, for example, was a “sundown town”—a place where African Americans were unwelcome after dark.6
African Americans bore the brunt of the federal and local exclusionary tactics, including steering by real estate agencies, racial covenants, and federal housing policy. For example, the federal government created a segregated Black housing project for Black war workers in the Fillmore district, while white war workers were housed elsewhere in the city. By the 1970s, African Americans lived primarily in Oakland, Richmond, East Palo Alto, Pittsburg, Vallejo, and designated neighborhoods in San Francisco, such as Bayview/Hunter’s Point. Richmond’s Iron Triangle, East Oakland, West Oakland, and Bayview/Hunter’s Point were regional examples of inner-city neighborhoods starved of resources, and then hemmed in by racial housing policies.
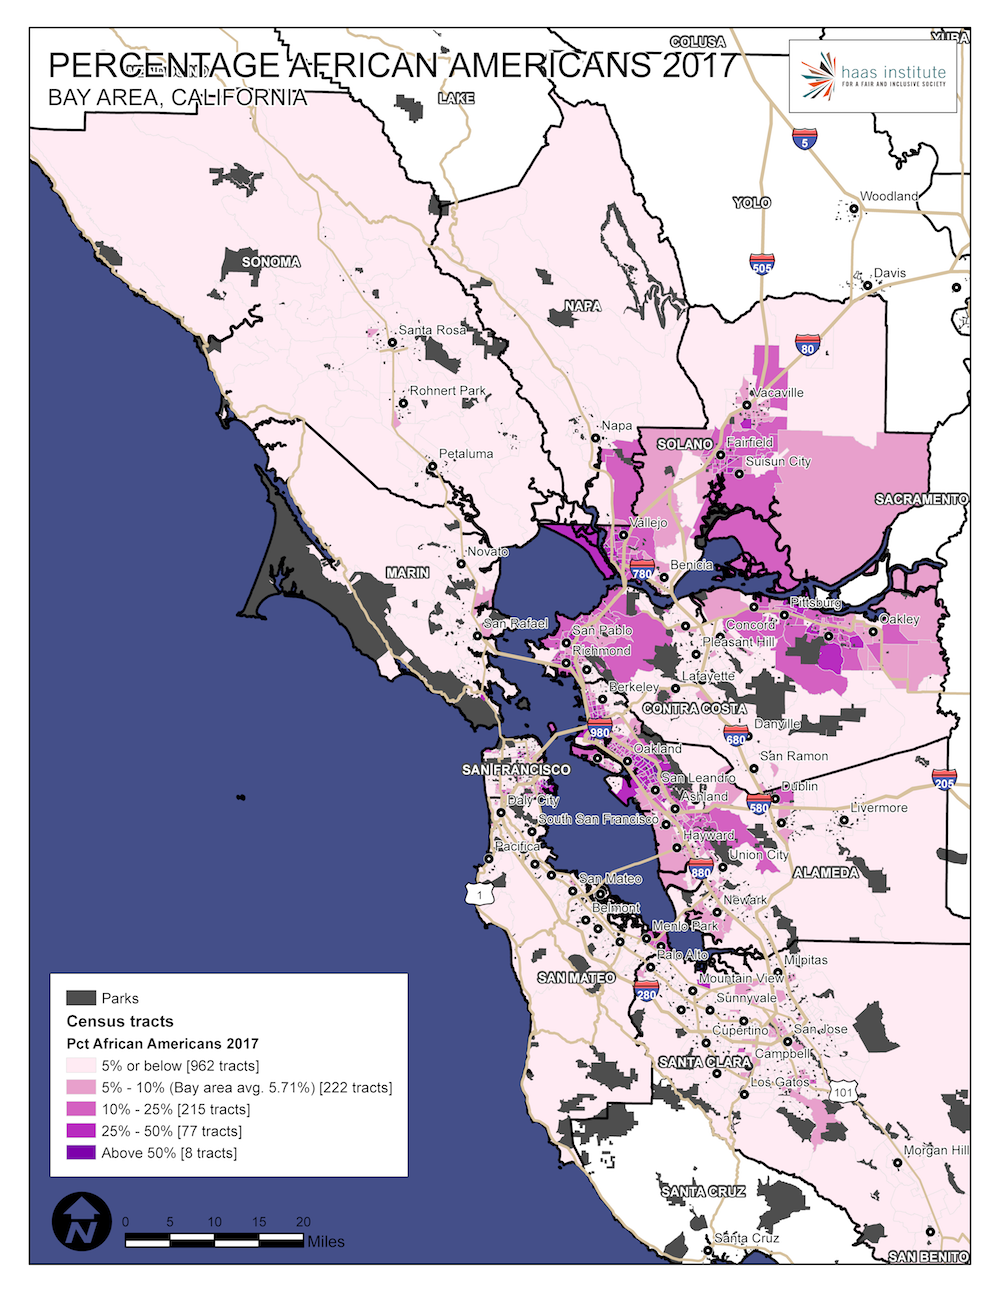
As the map below illustrates, and as noted in Part 1 of this series, African Americans are concentrated in a relatively small number of census tracts and neighborhoods, where they were permitted to live before the passage of the federal Fair Housing Act, or in inner-ring suburbs, into which they subsequently moved. The following map illustrates the distribution of African Americans in the region.
Roughly one-fifth of African Americans in the Bay Area are concentrated in highly-segregated Black neighborhoods in which they make up at least 20 percent of the population. But nearly 40 percent of African Americans live in neighborhoods that are between 0-5 percent Black. The remaining 40 percent live in relatively integrated neighborhoods that are 6-20 percent Black.
As suggested above, the cities with the highest proportion of African Americans in the Bay Area are Oakland (23.6 percent), Vallejo (20.5 percent), Antioch (19.7 percent), Suisun City (20.7 percent) and Richmond (20.2 percent). The cities with the highest proportion of African Americans relative to their population in their respective county are:
-
Alameda County (10.2 percent): Oakland (23.6 percent)
-
Contra Costa County (7.79 percent): Richmond (20.2 percent)
-
Marin County (1.68 percent): Sausalito (2.6 percent)
-
Napa County (2.16 percent): American Canyon (8.0 percent)
-
San Mateo County (2.24 percent): East Palo Alto (10.69 percent)
-
Santa Clara County (2.44 percent): Santa Clara (3.4 percent)
-
Solano County (13.31 percent): Suisun City (20.7 percent)
-
Sonoma County (1.61 percent): Cotati (2.7 percent)
As noted above, African Americans were sharply circumscribed in the post-war years in where they were permitted to live. Marin in particular stands out as an especially exclusionary county. As illustrated in Part 1, virtually the entirety of the inhabited parts of the county is segregated. There are, however, a few places with a long history of exclusion that are disproportionately African American. Marin City, a town near Sausalito, is nearly 27 percent African American as of 2017.
As a general rule, though, the South Bay has comparatively fewer African Americans than the northern and eastern Bay Area counties, and that remains true today as it did historically. Santa Clara County, with the largest population in the Bay Area at nearly 2 million people, had barely 40,000 Black residents as of 2010. And as small as this was, it was a decline of 20 percent since 1990.
One of the challenges for investigating racial demographics of the Bay Area is understanding the paradox of both persistence and change. As noted, many of the neighborhoods that are most heavily Black are those that were historically permitted for African-American migrants from the South. Yet, there has also been tremendous demographic change over the past few years, and preceding decades. For example, although African Americans moved into the Fillmore District of San Francisco (called the “Harlem of the West”) during and after the Japanese internment, and as part of the aforementioned federal housing project, they were pushed out in large numbers during urban renewal in the 1960s and 1970s.7 Redevelopment and highway construction targeted Black neighborhoods, as it did elsewhere in the country.8 The Black population of San Francisco peaked in 1970, at about 13.4 percent of the population, or about 96,000 people. There were about half as many Black residents in 2010, despite the growth of the city.
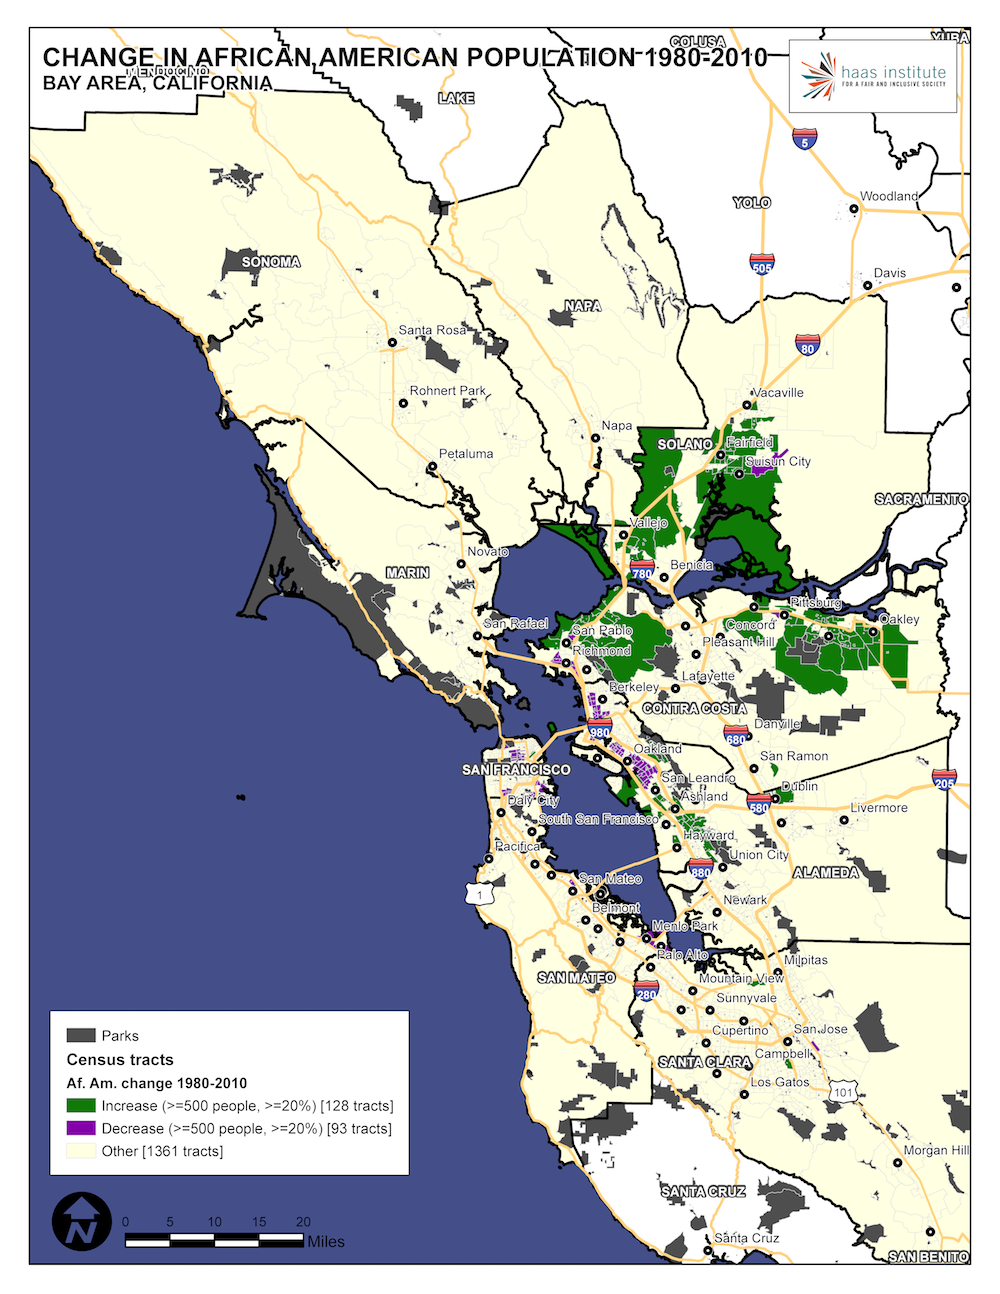
The East Bay battles over racial exclusion were just as intense. The East Bay was a battleground over fair housing ordinances opposed by real estate interests, neighborhood associations, and other organized opposition to Black movers as well as other state and local referenda that might promote or impede integration.9 For example, in 1973, Alameda adopted “Measure A,” a post-Fair Housing ordinance that prohibited construction of apartment buildings, with a recognition that the African Americans were less likely to own homes in Alameda compared to other groups.10 Nonetheless, by the 1960s, African Americans successfully settled in places like East Oakland, but were followed by Latino and Asian immigrants, which have continued to change the demography of those communities. The map below helps us begin to understand these changes by mapping the changes in the Black population from 1980 to 2010.
As we can see, the areas of most significant increase in Black population in this period are in the northern and eastern reaches of the Bay Area, including places like east Contra Costa County and southern Solano County. The neighborhoods with the greatest decrease in population are places like East and West Oakland.11 This fits a larger and ongoing narrative of African American displacement and gentrification, although some of this movement was pull, rather than push, as Black families moved into suburban neighborhoods.12
While cities like Piedmont had roughly the same percentage of African Americans in 2010 as they did in 1970, places like San Leandro have seen a large number of Black people moving in. In general, most of the places that African Americans moved toward from these historical areas were proximate, or nearby, those neighborhoods. However, this is no longer a general rule, as African Americans moving out of historically Black neighborhoods are now moving into far flung areas.13 In the exurban cities that saw the greatest relative population growth in the twenty-first century there are large numbers of African Americans. This includes places like Fairfield, Stockton, Tracy, and San Joaquin County.
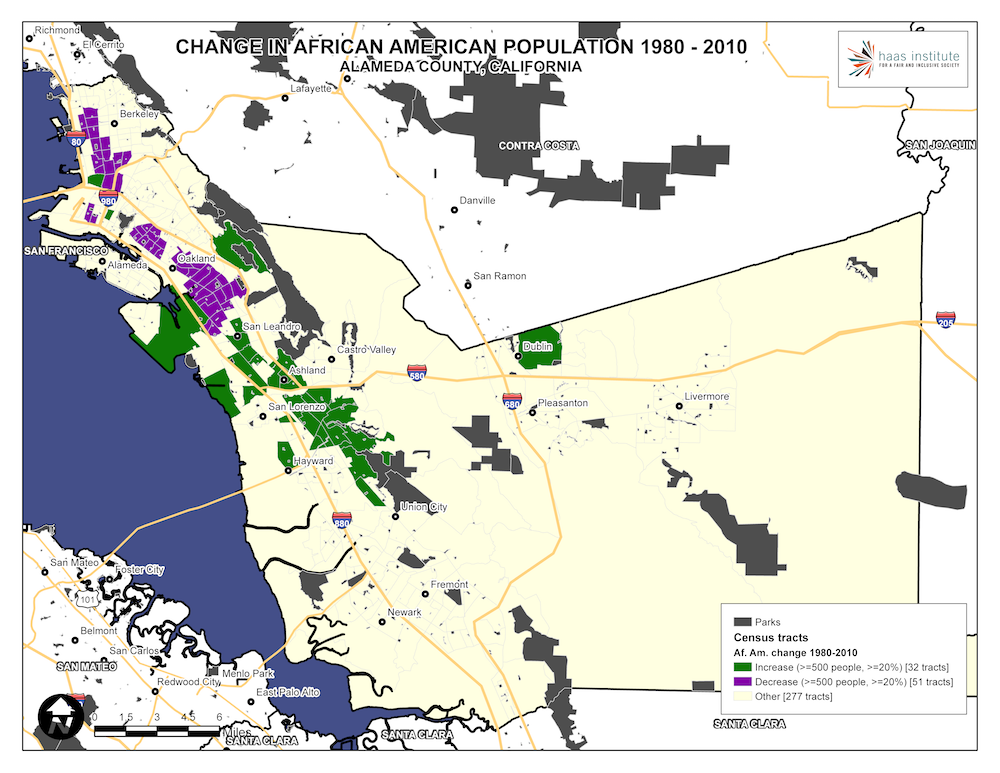
In fact, between 1970 and 2010, more than a million people moved from the western part of the Bay Area to far eastern counties beyond the nine-county Bay Area region. These changes are especially visible—and stark—when seen at the county level. San Joaquin’s increase in African Americans mirrors the decline in San Francisco. The following map, illustrating changes from 1970 to 2010 in Alameda County, shows how African Americans have moved to the suburbs in enormous numbers, while also declining in traditionally Black neighborhoods.
While the changes within Contra Costa are just as stark, Alameda County illustrates the basic dynamic of out-migration, displacement, and resettlement within a single county. The African-American population has declined significantly in the core neighborhoods in Oakland, even as African Americans, through a combination of push and pull, have moved further down into and toward the 580, 680, and 880 triangle. This shows that African Americans are moving further toward the periphery of the region.
Asian Americans in the Bay Area
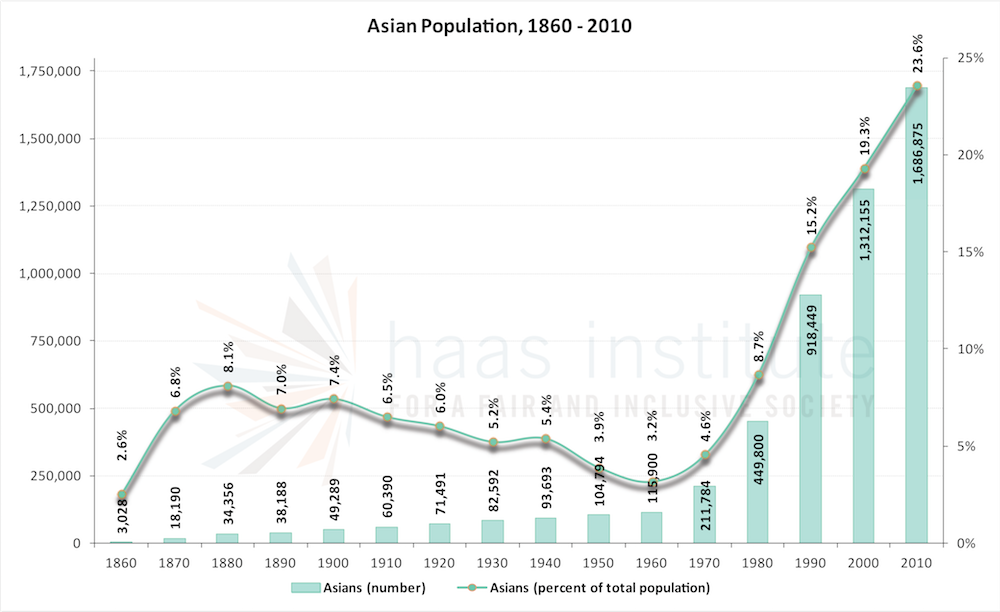
The Asian-American population in the San Francisco Bay Area has the highest rate of growth of any racial group in recent decades to become one of the largest groups in the region. As of 2010, there were nearly 1.7 million Asians in the Bay Area, constituting nearly 24 percent of the overall population. Asians are the second largest ethno-racial group, and may well become the largest in coming years.
Asian Americans are a large and diverse grouping, but also one that is essential to understanding the demographics of the Bay Area.14 The Asian-American experience in the San Francisco Bay Area is a complex, and multi-faceted history. The first major wave of Asians to the Bay Area was during the Gold Rush and working on the transcontinental railroad in the nineteenth century, as seen in the chart above, with a large increase between 1860 and 1970, and another significant increase in the decade after. These populations were met with racial hostility and animosity.
During the late-nineteenth century, anti-Chinese sentiment resulted in conflict and extremely restrictive regulations and norms, often enforced with violence, about where Asian Americans could live and in which occupations they could work. For example, the city and county of San Francisco enacted zoning laws that restricted where laundries could be operated, based on recognition that they were primarily a Chinese business.15 Although this law was struck down by the Supreme Court in 1886, it was only one part of a larger discriminatory pattern. With the passage of the federal Chinese Exclusion Act in 1882, and other restrictive immigration laws, these patterns set a long historical trajectory that is still visible today.
In fact, the impetus for these acts arose from anti-immigrant sentiment in the Bay Area. Demagogues like San Francisco’s labor leader Denis Kearney called for the expulsion of Chinese immigrants, despite being an immigrant from Ireland himself.16 He is also known to have led violent uprisings against Chinese residents.17 Kearney took credit for making the “Chinese issue” a national issue that helped lead to the federal Chinese Exclusion Act.18 Critically, Asian populations grew in absolute numbers in the pre-war and inter-war period even as their relative numbers fell, as can be seen in the chart above.
Similarly, anti-Japanese sentiment crested during World War II, when federal policy interned tens of thousands of Japanese-American citizens in detention camps.19 This resulted in the confiscation of a large part the housing stock in the Fillmore District in San Francisco. This period included a spate of discriminatory state laws, including restrictions on owning land and fishing privileges, which curtailed the rights of California citizens of Asian descent.20
Although Pilipino migration occurred and accelerated in the aftermath of the Spanish-American war, a second, large wave of migration occurred in the second half of the twentieth century, and a third, smaller wave is visible today. The biggest change began in the 1960s, with the Immigration Act, which removed restrictions and allowed a large influx of South Asian and East Asian immigrants to move to the United States. This is evidence in the large absolute and relative increases in the chart above. As a result, a number of historical neighborhoods received a large number of first-generation immigrants, while third- and fourth-generation immigrants moved elsewhere. For example, South Asians, Chinese, and Koreans made Milpitas and Cupertino almost two-thirds Asian by 2010.21
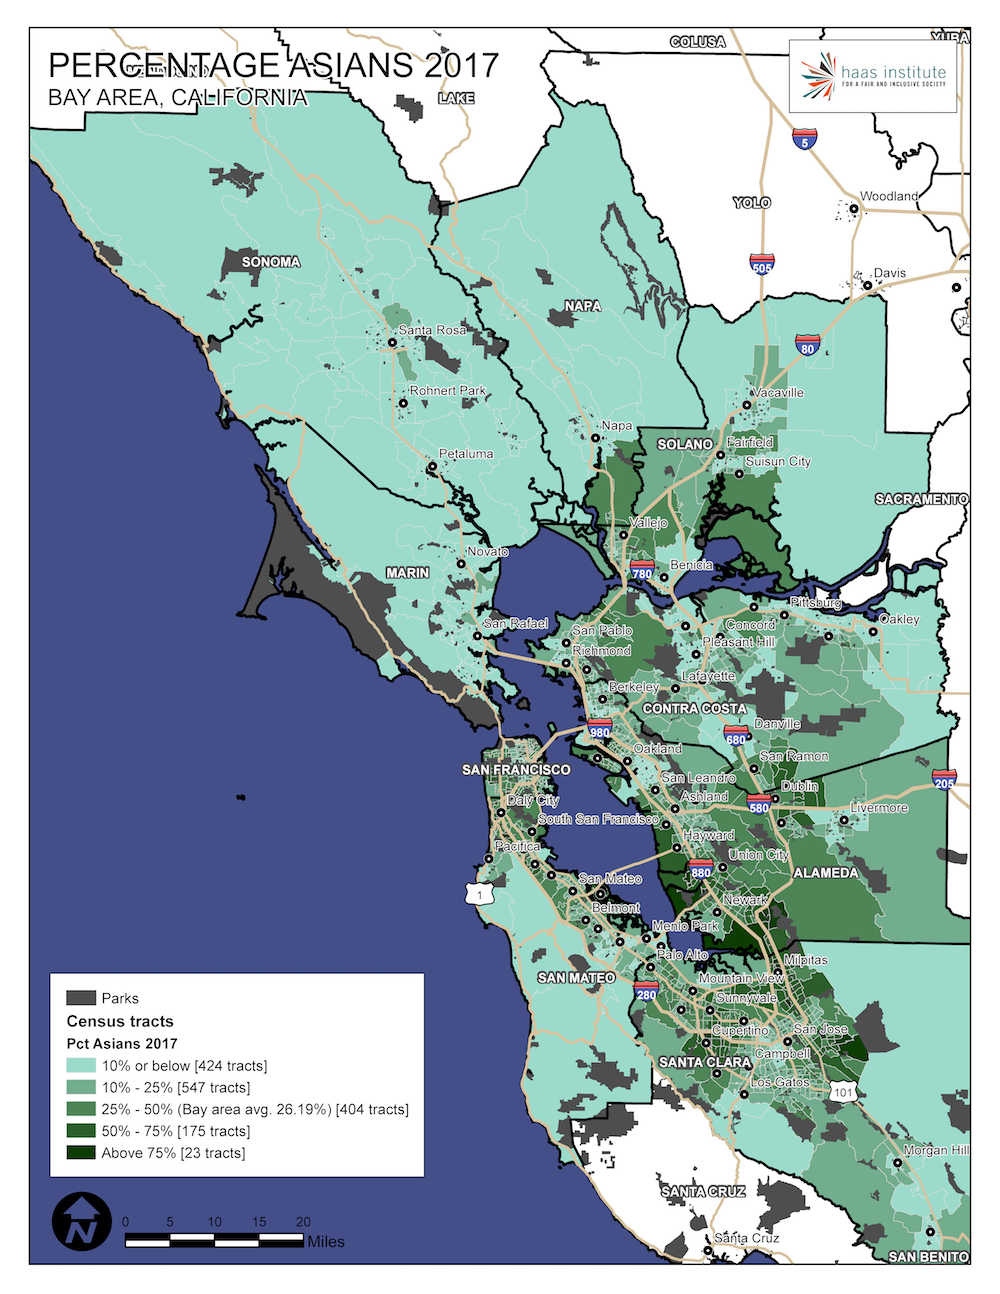
The following map illustrates the demographic distribution of Asian Americans in the SF Bay Area. It reflects both patterns of historical settlement as well as more recent migratory patterns.
As this map illustrates, Asian Americans are visibly present in most areas of the region, unlike African Americans, which are between 0-3 percent in many communities. On the other hand, Asian Americans are far from evenly distributed. Rather, there is an especially extreme concentration of Asians in some parts of the region.
The concentration of Asian Americans occurs not only in historically-restricted and culturally significant Chinatowns of San Francisco and Oakland, but also in various East Bay and North Bay communities such as Hiddenbrooke, Hunter Ranch, Chinatown, Ardenwood, Baylands and Albrae. Asian Americans constitute an outright majority of a number of Bay Area cities, including Fremont, Union City, Milpitas, and Daly City. In fact, Daly City has the largest number of Asian Americans in the continental United States.
Cities with the highest proportion of Asian Americans in the Bay Area are Milpitas (66.5 percent), Cupertino (66.4 percent), Fremont (57.3 percent), Daly City (56.3 percent) and Union City (53.0 percent). Cities with the highest proportion of Asian Americans relative to their population in their respective county are:
-
Alameda County (30.0 percent): Fremont (57.3 percent)
-
Contra Costa County (16.7 percent): Hercules (48.1 percent)
-
Marin County (6.0 percent): Novato (7.0 percent)
-
Napa County (8.0 percent): American Canyon (35.1 percent)
-
San Mateo County (28.2 percent): Daly City (56.3 percent)
-
Santa Clara County (36.3 percent): Milpitas (66.5 percent)
-
Solano County (15.6 percent): Vallejo (23.1 percent)
-
Sonoma County (4.0 percent): Rohnert Park (5.5 percent)
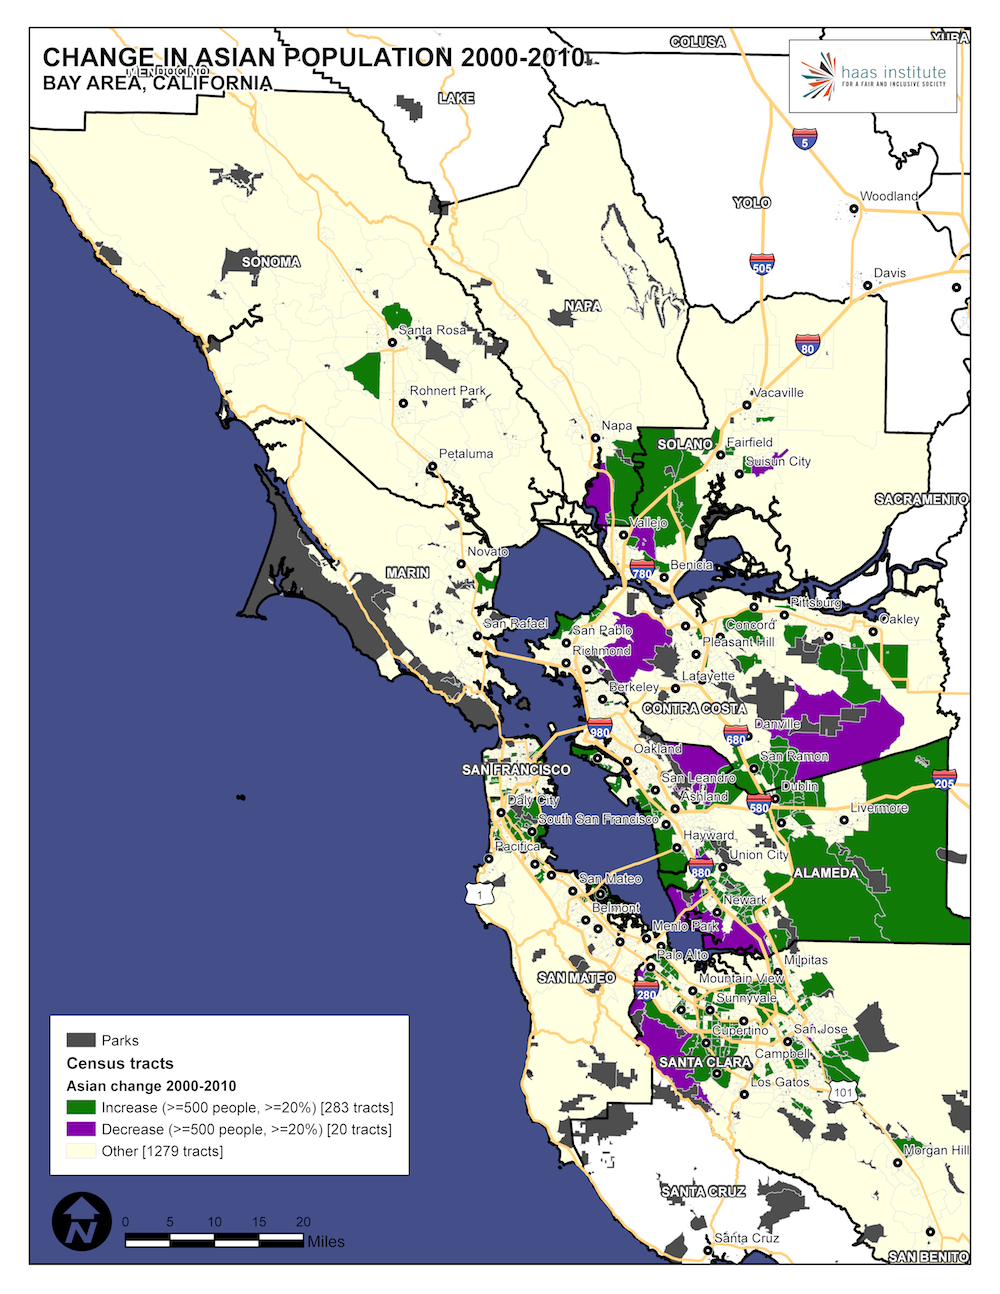
To better understand the recent demographic shifts, the following map illustrates changes from 2000 to 2010 in Asian-American residency.
As this map shows, the most pronounced changes have been massive increases in Asian populations toward certain communities, especially in Silicon Valley, working in technology. This most recent wave of change is most visible in the map below, showing the change in the Asian population from 2000 to 2010.
Latinos in the Bay Area
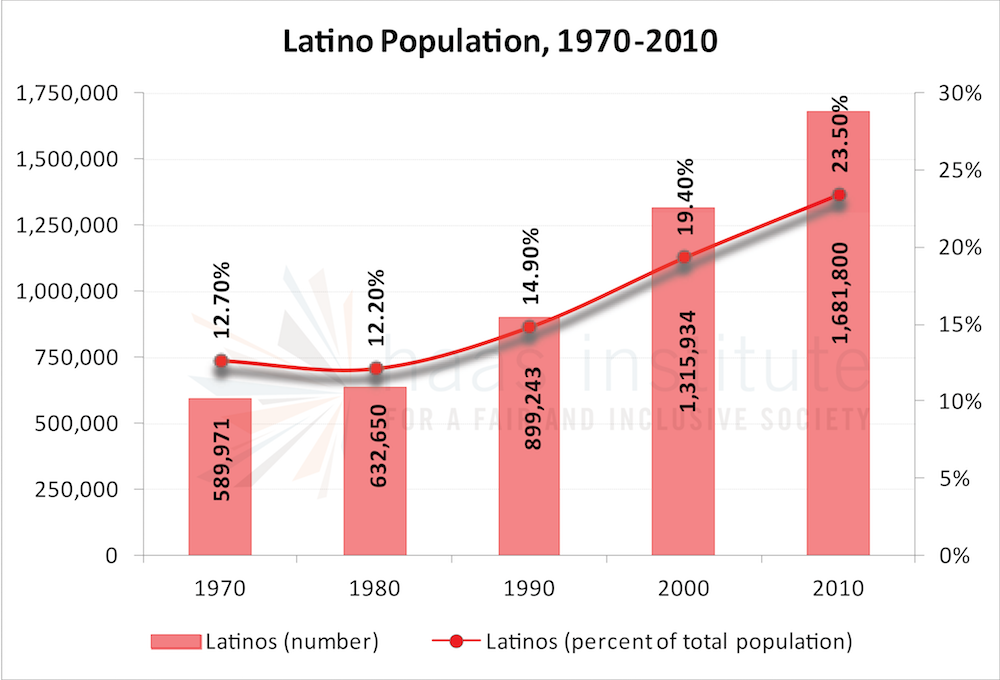
The Latino population has grown steadily but surely in recent decades, peaking at more than 1.6 million as of 2010, at nearly 25 percent of the regional population. The Latino population grew fastest between 1990 and 2000, at nearly 50 percent growth but has risen at a rate of 42 percent between 2000 and 2010. The following charts illustrate these population shifts in both absolute and relative terms from 1970 to 2010.
Along with Native Americans, people of Latin descent were the earliest inhabitants of the Bay Area. Because California was part of Mexican territory until 1848, Mexican outposts dotted the area, and Chicano farmers and families lived in the region. In fact, the name California derives from the term “Californio,” which means people of Spanish or Mexican descent who lived in California.
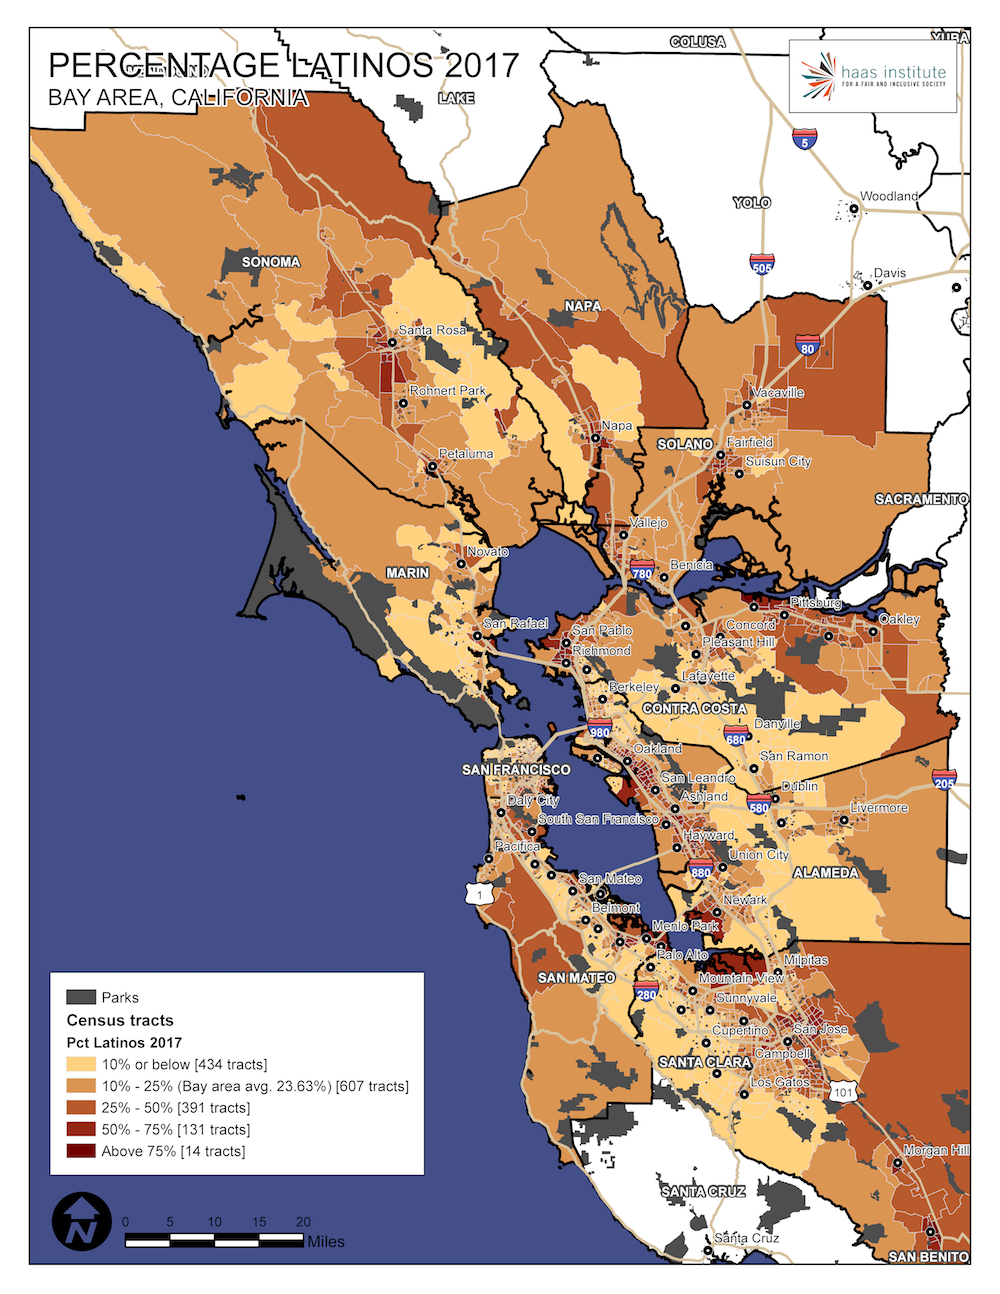
Below is the regional map that illustrates the distribution of Latinos throughout the region.
Latinos have the highest demographic presence in Santa Clara County, although there are substantial numbers of Latinos throughout the Bay Area. Although there are substantial numbers of Latinos in most of the Bay Area counties, there are surprisingly few places where Latinos are a majority. Cities with the highest proportion of Latinos in the Bay Area are East Palo Alto (63.2 percent), San Pablo (60.7 percent), Gilroy (60.6 percent), Calistoga (47.5 percent) and Dixon (42.7 percent). The cities with the highest proportion of Latinos relative to their population in their respective county are:
-
Alameda County (22.5 percent): Hayward (40.4 percent)
-
Contra Costa County (25.7 percent): San Pablo (60.7 percent)
-
Marin County (16.1 percent): San Rafael (29.7 percent)
-
Napa County (34.3 percent): Calistoga (47.5 percent)
-
San Mateo County (24.5 percent): East Palo Alto (63.2 percent)
-
Santa Clara County (25.6 percent): Gilroy (60.6 percent)
-
Solano County (26.5 percent): Dixon (42.7 percent)
-
Sonoma County (27.0 percent): Healdsburg (33.7 percent)
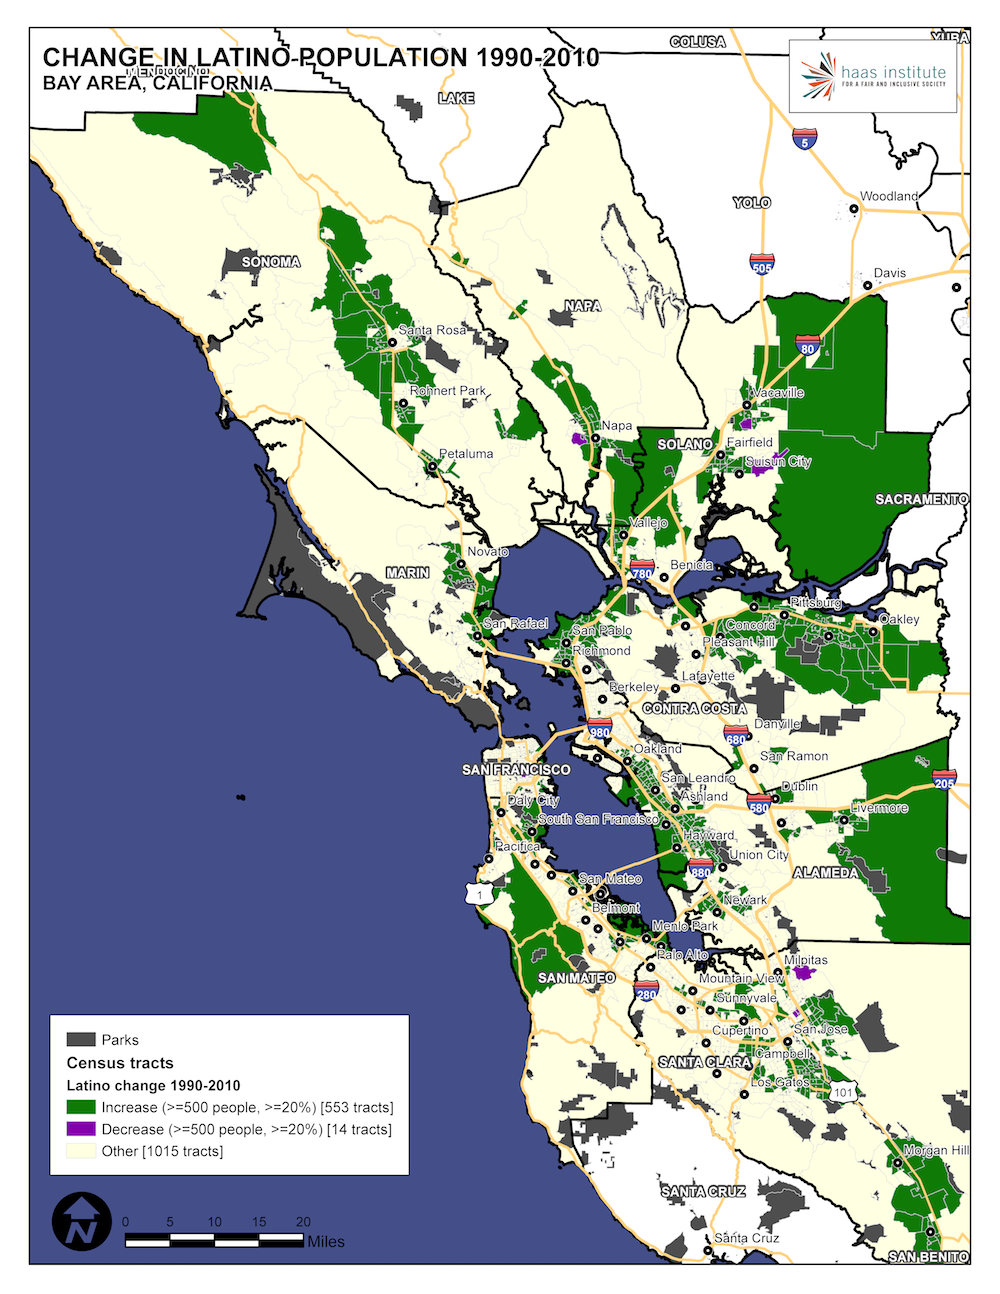
The following map illustrates the change in Latino population from 1990 to 2010.
Despite their historic presence, Latino communities have grown in particular areas, such as part of Canal Waterfront in San Rafael, part of Hookston neighborhood in Concord city, and a neighborhood in Napa city, East San Jose, among others.
It is difficult to draw generalizations about these patterns. Racialized employment patterns both in agriculture as well as low-wage service jobs and contract workers may help explain some of these demographic changes.
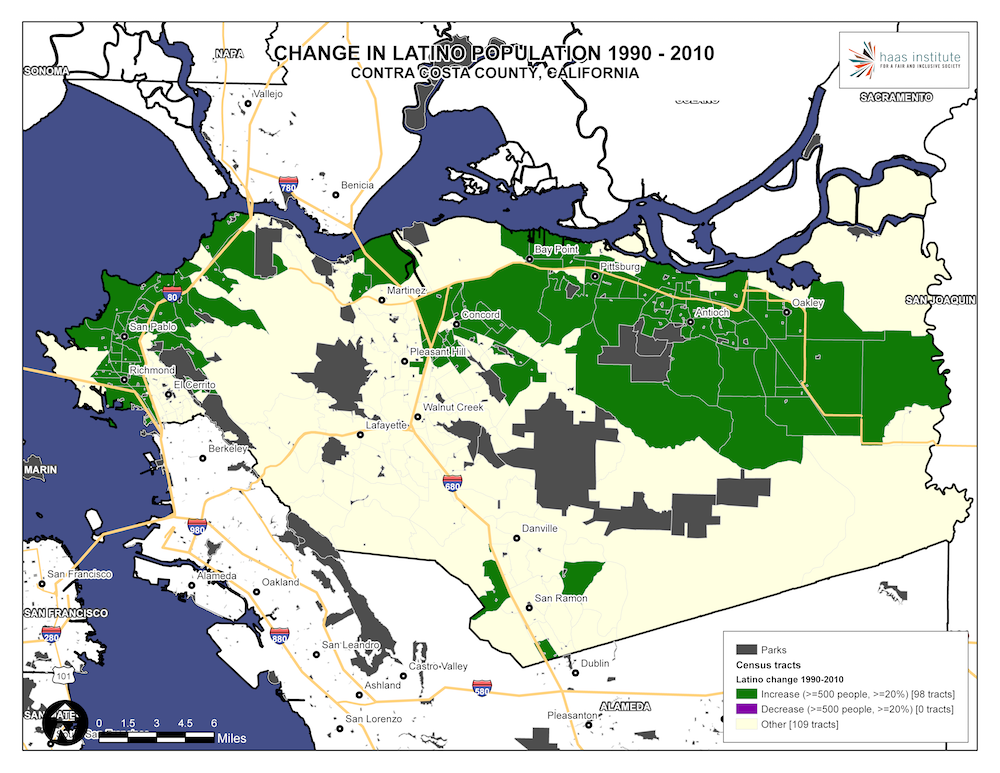
A closer look at Contra Costa County reveals the tremendous influx of Latinos just in the last several decades, with 100 percent increases in census tracts across the county, from Richmond to San Joaquin.
Contra Costa County, remarkably, has the highest growth rate of any county in the Bay Area for Latinos in recent decades. This map illustrates that growth with huge increases in both the eastern and western span of the county along Highway 4.
Whites in the Bay Area
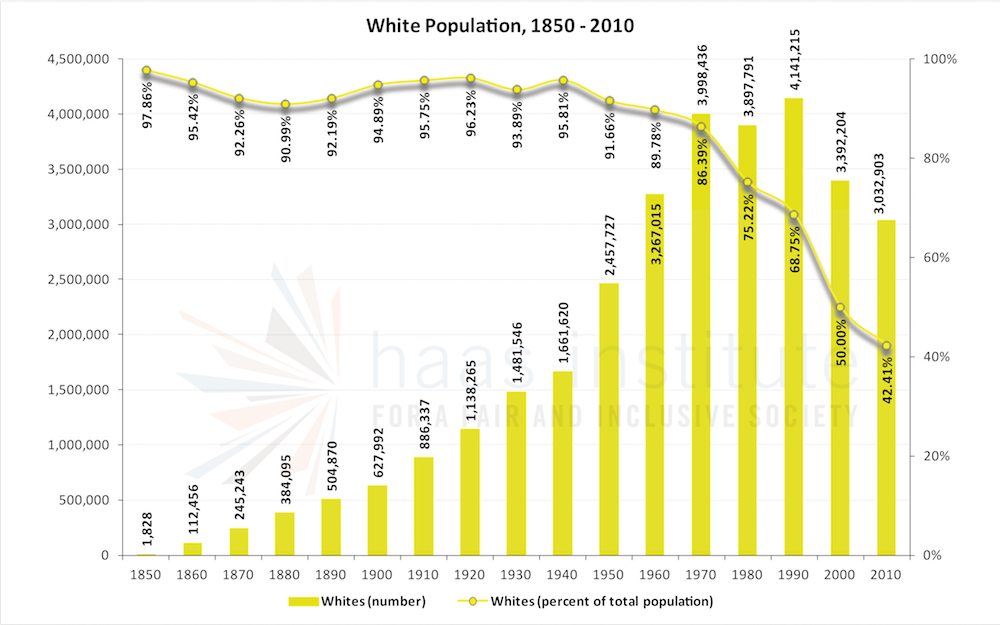
The white population of the Bay Area was under 4 million as of the 2010 census, at just above 40 percent of the population. The proportion of whites living in the Bay Area has declined in both absolute and relative numbers in recent decades, although the direction has been uneven.
As the chart below illustrates, the number of whites peaked in absolute numbers at nearly 4.15 million in 1990, and has declined ever since. But the rate of relative decline has been even more precipitous, falling by nearly 40 percent from 2000 to 2010. But as the decline in absolute numbers illustrates, this is more attributable to overall population growth in that period than an absolute decline in whites overall.
California was part of the territory ceded by Mexico to the United States under the Treaty of Guadalupe Hidalgo, which ended the Mexican-American war, a war that Ulysses S. Grant regarded as “unjust.”22 The treaty of 1848 led to statehood in 1850, but not before the 1849 Gold Rush brought more than 90,000 migrants to the area. Although this migration was enormously diverse, for an area that was primarily a mix of Native American tribes, Mexican outposts and settlers, the Gold Rush changed the demography of the region. It brought migrants not only from other parts of the United States, but from all over the world. One estimate has that half of the arrivals were born outside of North America. They came from the British Isles, Peru, Chile, France, Germany, and all over Europe, as well as Australia, New Zealand, China, and the Philippines.23 It was during this period that significant numbers of whites would arrive.
Although many people fled the region after the earthquake of 1906, and the rate of population growth slowed in the first half of the twentieth century, the Bay Area remained one of the most populous western regions in the United States, reaching over a million people between 1910 and 1920. The war effort led to a 50 percent increase in population growth overall. As of late 1970, whites were nearly 90 percent of the population of the Bay Area, although they are now only a plurality.
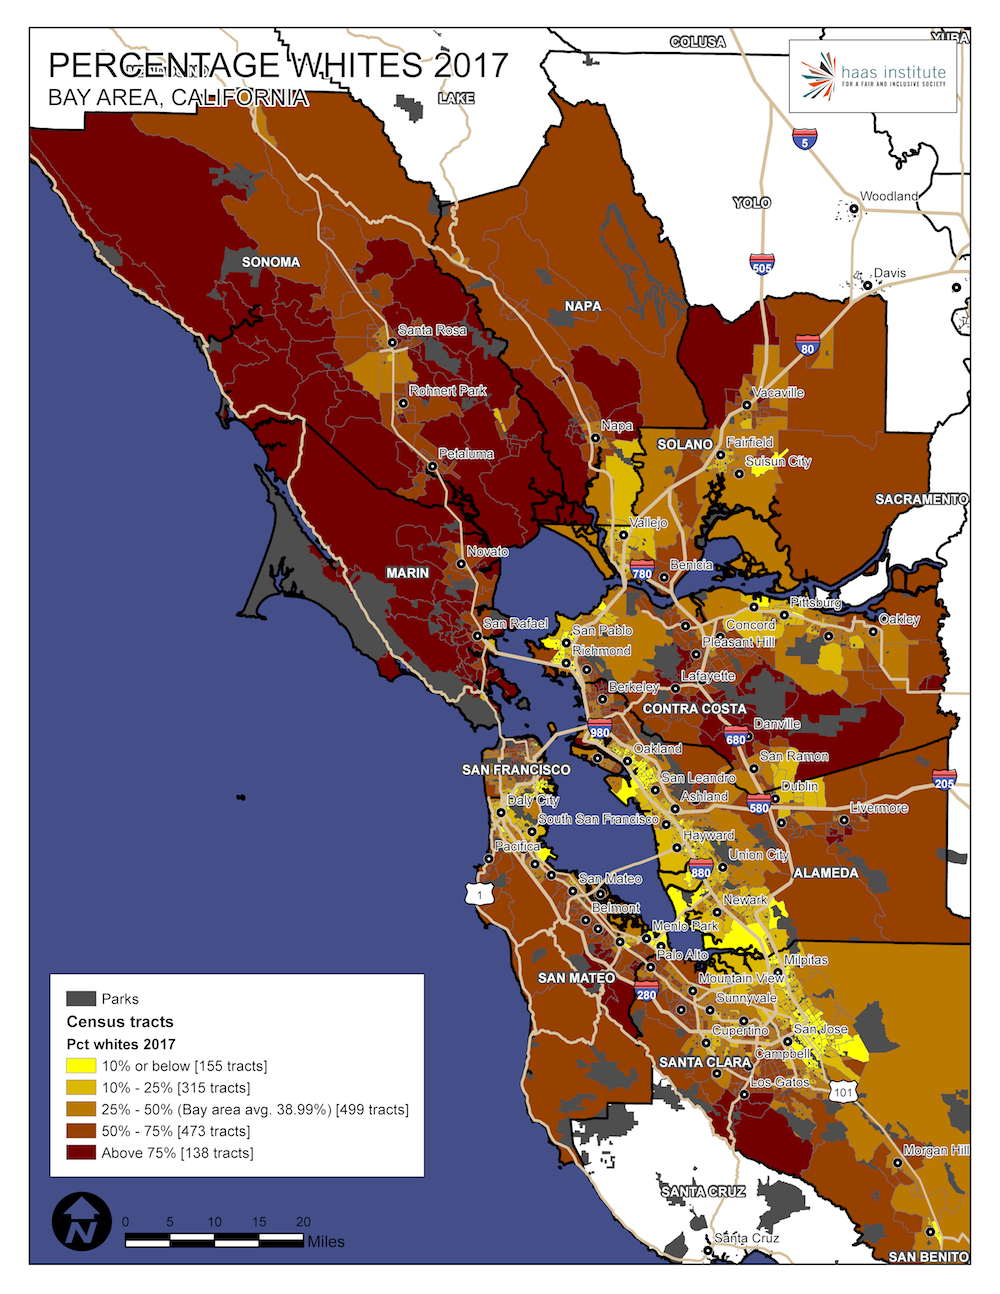
Below is the regional map that illustrates the distribution of whites throughout the region.
Whites make up a majority of the eastern Bay Area counties, and are a majority of Napa, Marin and Sonoma counties. Even in diverse counties like Contra Costa and Alameda, whites are a majority in cities such as Walnut Creek, Concord, Lafayette, Moraga, Pleasant Hill, Martinez, Berkeley, Pleasanton, and Livermore.
Cities with the highest proportion of whites in the Bay Area are Belvedere (87.6 percent), Sausalito (84.9 percent), Mill Valley (83.4 percent), Sebastopol (83.2 percent) and Yountville (82.2 percent), and the cities with the highest proportion of whites relative to their population in their respective county are:
-
Alameda County (31.3 percent): Piedmont (70.3 percent)
-
Contra Costa County (43.6 percent): Lafayette (76.7 percent)
-
Marin County (70.3 percent): Belvedere (87.6 percent)
-
Napa County (52.3 percent): Yountville (82.2 percent)
-
San Mateo County (39.0 percent): San Carlos (69.8 percent)
-
Santa Clara County (31.4 percent): Monte Sereno (76.6 percent)
-
Solano County (37.9 percent): Rio Vista (76.7 percent)
-
Sonoma County (62.1 percent): Sebastopol (83.2 percent)
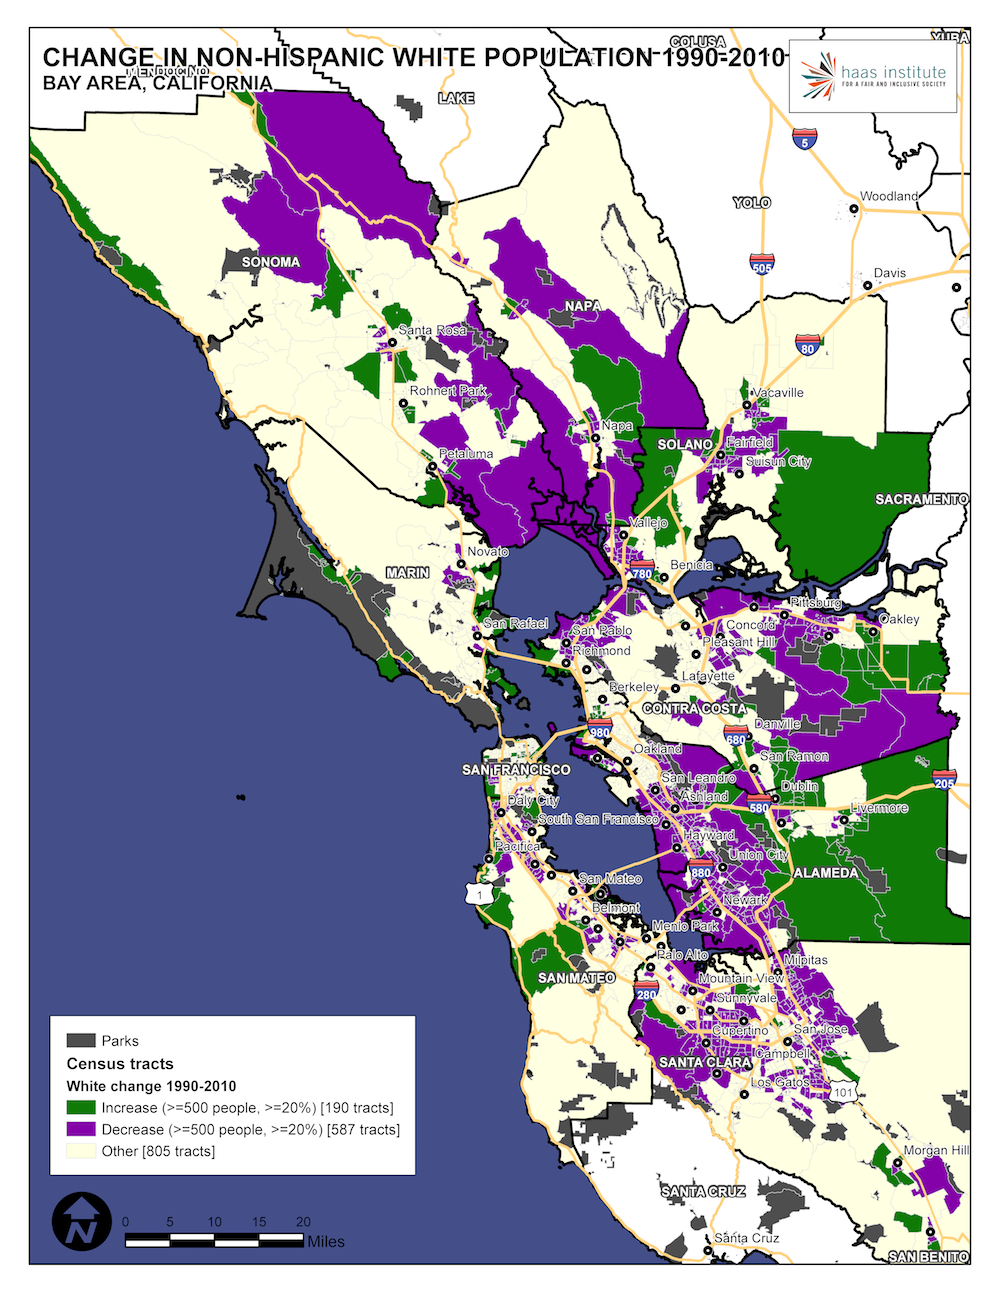
The map below shows changes in the white population between 1990 and 2010.
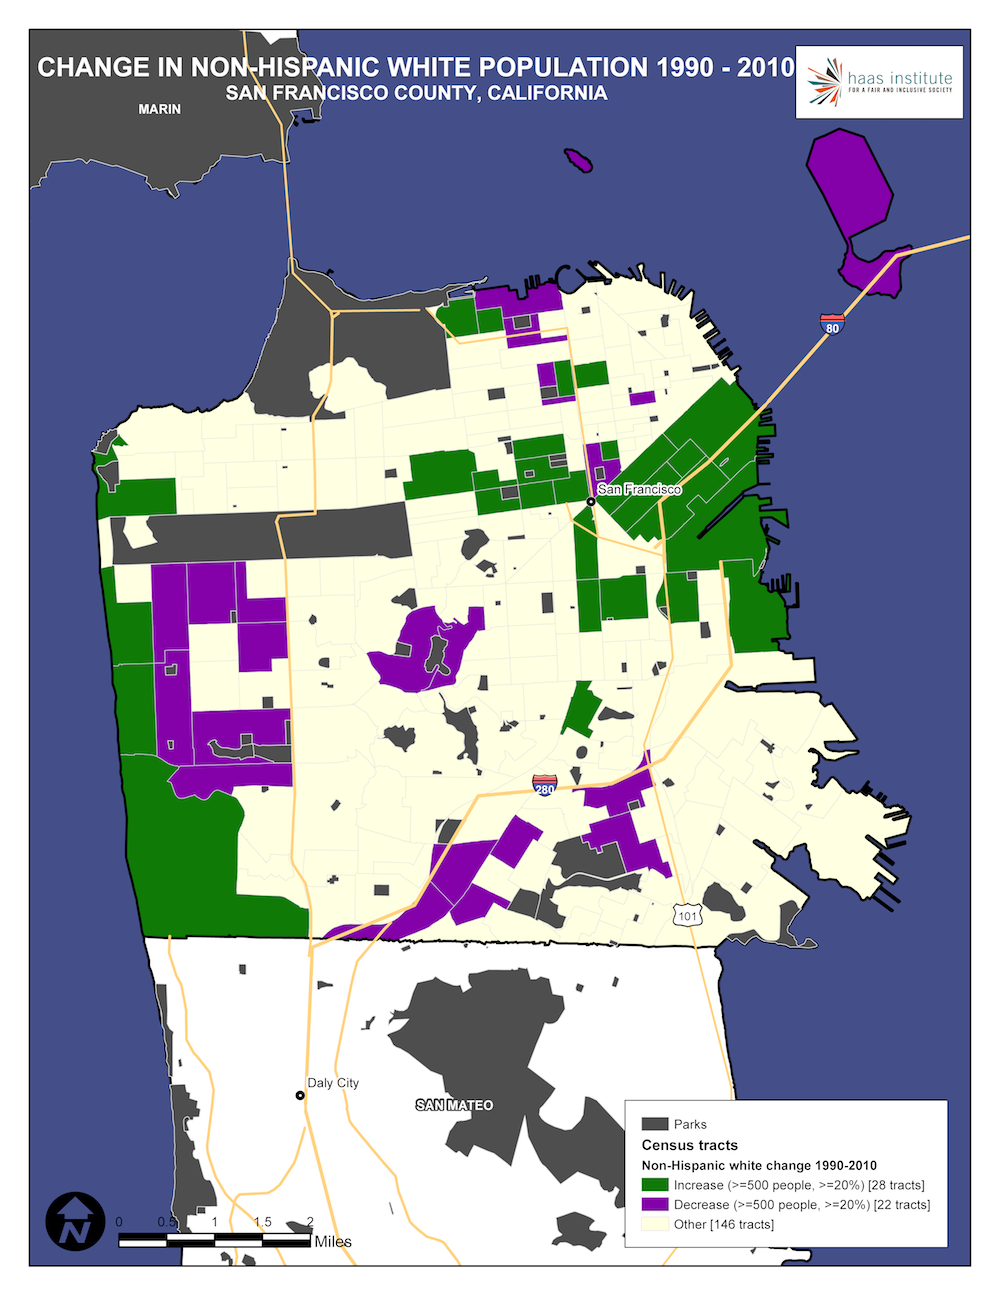
As elsewhere, part of the story of white demographic change has been the story of white flight, and then the return of whites to the urban cores since 2000. This is especially visible in the overall changes in San Francisco County and City from 1990 to 2010, as illustrated below:
Native Americans
Despite being the original inhabitants of the Bay Area, Native American populations have, through force, violence, and expulsion, been reduced to less than half a percent of the overall population in the Bay Area, and just over 20,000 people as of 2010. The following chart tells the story.
The story of the Bay Area’s racial demography would be incomplete without an examination of Native American populations. There were many Native American tribes in the land that would become the state of California, but the Ohlone villages in particular populated what is now Oakland and other parts of the East Bay. In addition, there were many sacred sites, including Shell mounds, that now lend an area of Emeryville its name.
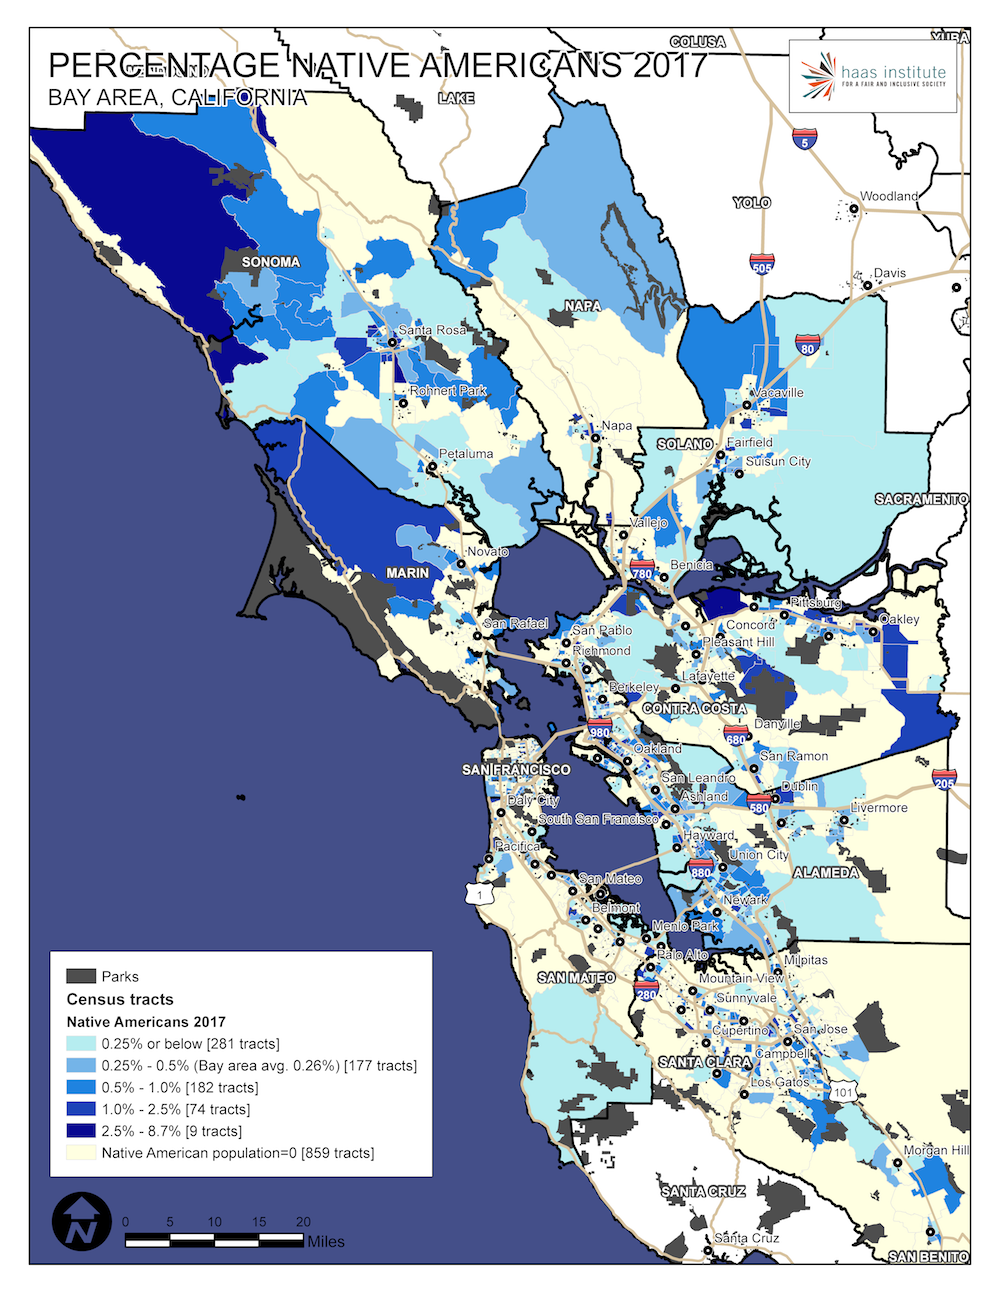
As important as the history of Native Americans are in the area, their relatively small numbers make this them a more challenging group to analyze. The following maps illustrate the distribution of Native Americans across the nine-county Bay Area region:
Using 2017 ACS estimates, cities with the highest proportion of Native Americans in the Bay Area are Cloverdale (4.44 percent), Oakley (0.90 percent), American Canyon and Santa Rosa (0.83 percent), Clayton (0.64 percent) and Menlo Park (0.54 percent). The cities with the highest proportion of Native Americans relative to their population in their respective county are:
-
Alameda County (0.33 percent): San Leandro (0.50 percent) [County and city numbers reliable]
-
Contra Costa County (0.23 percent): Oakley (0.90 percent) [County numbers reliable]
-
Marin County (0.18 percent): Sausalito (0.28 percent)
-
Napa County (0.27 percent): American Canyon (0.83 percent)
-
San Mateo County (0.18 percent): Menlo Park (0.54 percent)
-
Santa Clara County (0.20 percent): Saratoga (0.51 percent) [County numbers reliable]
-
Solano County (0.24 percent): Suisun City (0.36 percent)
-
Sonoma County (0.66 percent): Cloverdale (4.44 percent) [County numbers reliable]
Sonoma has the largest Native American population, at two-thirds of a percent, but the numbers are so small that only four counties have reliable estimates using 2017 data.
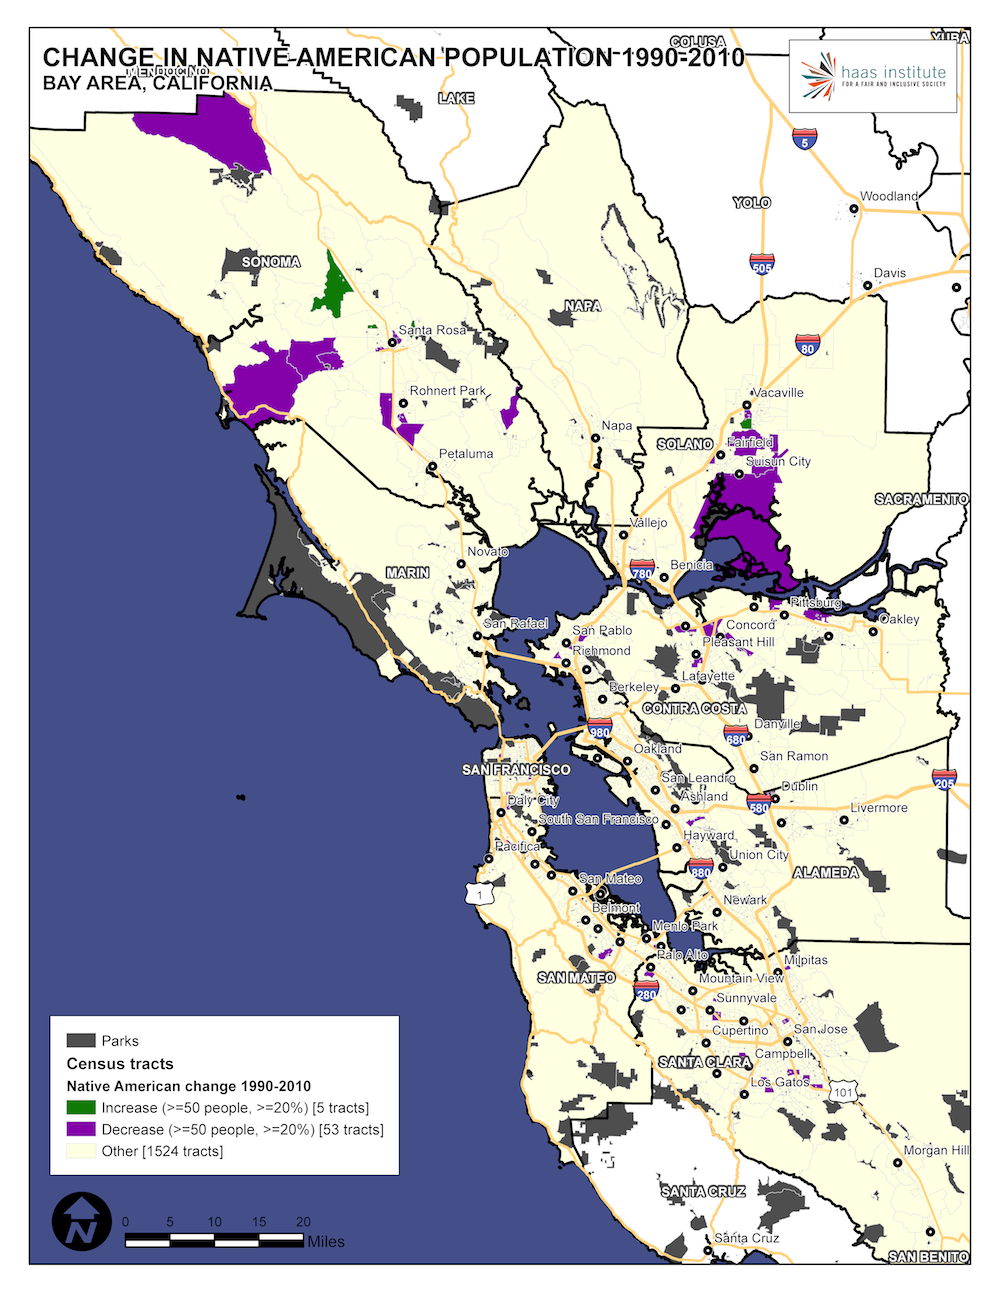
The following map illustrates demographic changes of Native Americans in the Bay Area from 1990 to 2010:
- *The authors would like to thank Phuong Tseng for creating the demographic line and bar charts, and gathering all of the data as well.
- 1We follow convention used in Part I of this series regarding the classification of the major ethno-racial groups, with one exception. We recognize that racial and ethnic categories are contested and politically fraught, but adopt this taxonomy for ease of analysis and simplicity in discussion. The exception is that, in this brief, we add “Native American and Alaskan Native,” which we will abbreviate to “Native American” for the remainder of this report. See: Stephen Menendian and Samir Gambhir, “Racial Segregation in the San Francisco Bay Area” (Berkeley, CA: Haas Institute for a Fair and Inclusive Society, October 29, 2018), n3, https://belonging.berkeley.edu/racial-segregation-san-francisco-bay-area#footnote3_wepq2tz.
- 2This is an area of persistent confusion among many scholars and advocates. Racial demographics, alone, cannot indicate the degree or level of segregation that exists in an area. For example, knowledge of the demographic breakdown of a particular community cannot tell you how racially segregated that community is. However, with enough contextual information, including regional or metropolitan demographics, certain demographic information can indirectly suggest the degree of segregation in on area. But it is not the same thing as measuring segregation itself.
- 3Alex Schafran, The Road to Resegregation: Northern California and the Failure of Politics (Berkeley, CA: University of California Press, 2018), 25.
- 4 Schafran, 30.
- 5Richard Rothstein, The Color of Law: A Forgotten History of How Our Government Segregated America (New York: Liveright, 2017), 29.
- 6Schafran, The Road to Resegregation, 9; See also: James W. Loewen, Sundown Towns: A Hidden Dimension of American Racism (New York: Touchstone, 2006).
- 7Todd Whitney, “A Brief History of Black San Francisco,” Crosscurrents (San Francisco, CA: KALW, February 24, 2016), https://www.kalw.org/post/brief-history-black-san-francisco.
- 8See: Thomas J. Sugrue, The Origins of the Urban Crisis: Race and Inequality in Postwar Detroit (Princeton, NJ: Princeton University Press, 2005).
- 9Diego Aguilar-Canabal, “The Deplorable Politics Behind Article 34,” The Bay City Beacon, September 9, 2018, https://www.thebaycitybeacon.com/politics/the-deplorable-politics-behind-article/article_d5421448-b4ba-11e8-9847-6fb4a6f5cf5c.html; See also: Daniel Martinez HoSang, Racial Propositions: Ballot Initiatives and the Making of Postwar California (Berkeley: University of California Press, 2010).
- 10Rasheed El Shabazz. “A History Lesson: Tenants V. Alameda.” Renewed Hope Housing Advocates (blog), October 7, 2014. http://renewedhopehousing.org/180/.
- 11For additional demographic analyses, see: Tony Roshan Samara, “Race, Inequality, and the Resegregation of the Bay Area” (Oakland, CA: Urban Habitat, November 2016), https://urbanhabitat.org/sites/default/files/UH%20Policy%20Brief2016.pdf ; Philip Verma, Dan Rinzler, and Miriam Zuk, “Rising Housing Costs and Re-Segregation in Alameda County” (University of California, Berkeley: Urban Displacement Project, September 2018), http://www.urbandisplacement.org/sites/default/files/images/alamedafinal9_18.pdf.
- 12See: Kathleen Richards, “The Forces Driving Gentrification in Oakland,” East Bay Express, September 19, 2018, https://www.eastbayexpress.com/oakland/the-forces-driving-gentrification-in-oakland/Content?oid=20312733.
- 13 See endnote 11.
- 14We recognize the problems in grouping such a large and diverse number of people into a single ethno-racial category. But limited data makes disaggregating this category, especially historically, extremely difficult. Yick Wo v. Hopkins, 118 U.S. 356 (1886)
- 15Yick Wo v. Hopkins, 118 U.S. 356 (1886).
- 16See: Beth Lew-Williams, The Chinese Must Go: Violence, Exclusion, and the Making of the Alien in America (Cambridge, MA: Harvard University Press, 2018).
- 17 Chris Carlsson, “The Workingmen’s Party & The Denis Kearney Agitation,” FoundSF, 1995, http://www.foundsf.org/index.php?title=The_Workingmen%E2%80%99s_Party_%26_The_Denis_Kearney_Agitation.
- 18Andrew Gyory, Closing the Gate: Race, Politics, and the Chinese Exclusion Act (Chapel Hill: University of North Carolina Press, 1998), 130–34.
- 19Erica Loberg, “Japanese Internment in San Francisco,” FoundSF, 2014, http://www.foundsf.org/index.php?title=The_Workingmen%E2%80%99s_Party_%26_The_Denis_Kearney_Agitation.
- 20Takahashi v. Fish & Game Commission, 334 U.S 410 (1948).
- 21Schafran, The Road to Resegregation, 160.
- 22Grant stated, “For myself, I was bitterly opposed to the measure, and to this day regard the war, which resulted, as one of the most unjust ever waged by a stronger against a weaker nation.” Ulysses Simpson Grant, Memoirs and Selected Letters: Personal Memoirs of U.S. Grant, Selected Letters 1839-1865, ed. Mary Drake McFeely (New York: Library of America, 1990), 41.
- 23Kevin Starr and Richard J. Orsi, eds., Rooted in Barbarous Soil: People, Culture, and Community in Gold Rush California (Berkeley: University of California Press, 2000); Cited in: Schafran, The Road to Resegregation, 25.

