
Introduction*
Segregation is one of our nation’s most enduring and intractable problems. More than 60 years since the Supreme Court’s landmark Brown v. Board of Education decision denounced racial segregation in primary and secondary public schools, and 50 years since the enactment of the federal Fair Housing Act, our neighborhoods and schools have yet to reflect the rich diversity of our nation as a whole. In far too many cases, racial segregation is as severe or worse today than a generation ago. Racially segregated neighborhoods and schools are visible in every part of the United States.
Segregation seems embedded in our nation’s fabric while, simultaneously, the United States has become a more diverse country. Paradoxically, demographic changes since the 1960s complicate our understanding of segregation. The San Francisco Bay Area is a case in point.1 The Bay Area is roughly 39 percent white, 6 percent Black, 26 percent Asian, 24 percent Latino and 5 percent "other," including Native American, Pacific Islander, and multi-racial.2 While the region is overall diverse, there are few neighborhoods or cities in the region that reflect that diversity. Racial diversity within the region, however, makes measuring and understanding the patterns of racial segregation more challenging.3 The most popular and widely used measures of segregation only measure segregation between two racial groups at a time.4
Given the seriousness of the problem of racial segregation as a cause of racial inequality and the complexities in understanding the nature of this problem, the Haas Institute is launching a series of briefs that will attempt to illuminate these patterns and demystify the reality of segregation in the San Francisco Bay Area. Many organizations have published maps that indicate the distribution of specific racial groups across space.5 Sometimes, these racial composition maps are used to suggest the level or changes in racial residential segregation.6 In some of our own reports, we have produced maps that illustrate the percentage of people of color or people of particular racial groupings throughout the Bay Area to imply as much.7 But racial composition and racial segregation are not the same thing. This is the first report, to our knowledge, that will map and illustrate residential racial segregation itself for multiple racial groups simultaneously within the Bay Area. We attempt to fill a gap in the reporting on race in the Bay Area by refocusing on this important but difficult issue.
In this first brief, we present a series of detailed maps illustrating segregation across the region, within each of the nine Bay Area counties, and in its major metropolitan areas. Our goal is that readers in the Bay Area, for the first time, will have a clear portrait of the reality and extent of the racial segregation in their communities. We will highlight and discuss the varying levels of residential racial segregation within the region and show which communities and neighborhoods are the most segregated, and the most integrated.8 Unfortunately, integrated communities are the exception that proves the rule, as we will show. Only a handful of cities in region are both diverse and highly integrated.
In our second brief we will disaggregate and untangle patterns of segregation into specific patterns of racial demographics. We will examine the unique patterns of racial distribution in the San Francisco Bay region, and across major metropolitan areas. In particular, part two of this series will illustrate the distribution of white, Black, Latino, and Asian populations across each large metropolitan area and many counties. We will also examine specific areas of racial clustering and concentration, not simply segregation, and examine how these demographic changes have occurred over time. Thus, we will better understand how patterns of residential change, migration and displacement contribute to segregation today and as a matter of historical fact.
Our third brief will focus on the complicated issue of how best to measure segregation, with a review that describes various measures of racial segregation used by demographers, geographers, and social scientists, including the dissimilarity index, the isolation and exposure indices, as well as more novel measures that are both quantitative and qualitative. We will weigh their advantages and disadvantages, and explain why we settled on the Divergence Index as the best measure for the Bay Area. In the process, we will compare results from different indices to form a more vivid and rounder portrait of segregation in the Bay Area. Part three will then examine longitudinal patterns of segregation using some of those measures over time within the Bay Area, using different segregation metrics to better describe how these patterns have changed over time. Each measure is a partial glimpse into a multi-faceted reality. Only by juxtaposing the best measures can we best understand the underlying reality of racial segregation.
The fourth brief will explain the significance of the problem of segregation, and delve more deeply into the harms of segregation. Without being exhaustive, we will briefly survey an immense social science literature. We will illustrate how racial segregation is a principal mechanism that isolates too many people of color, especially children, from life-enhancing resources, and is a critical determinant of racial inequality in areas such as educational performance and attainment, health outcomes, and upward economic mobility.9 Segregation, as we will show, is not just a separation of particular groups of people from each other, but from opportunity and resources. As such, segregation is the root cause of racial inequality in the United States.
The fifth and final brief in this series will suggest and advance a number of policy principles that have the potential to alleviate the problem of segregation and reduce measurable segregation. This brief will examine the Bay Area's projected level of racial residential segregation going forward, and suggest targets for changing that trajectory. Segregation is the product of historical and contemporary policy and systems/structures, as well as private action. Without describing specific bills or measures, the focus of this brief will be to offer specific policy principles that have the potential to improve the enduring problem of segregation.
Our immediate purpose in this brief is to illustrate vividly patterns of segregation within the Bay Area utilizing compelling maps and data analysis, thereby drawing greater and more detailed attention to a problem that has remained stubbornly persistent. We also provide the divergence index calculations by census tract to facilitate applied research using our data. Our hope is that these maps and our accompanying analysis will convey an undeniable fact of life in the San Francisco Bay Area, and by doing so will spur and advance policy and advocacy discussions on how to mitigate or ameliorate them.
Segregation in the Bay Area
The San Francisco Bay Area, like most of the United States, is deeply segregated. The Bay Area is visibly segregated at the regional, county, metropolitan, municipal, and neighborhood levels. Each of the nine counties as well as the two major “Metropolitan Statistical Areas” (MSAs) is marked by high levels of racial segregation.10 To illustrate this, we present the following maps of the Bay Area using a multi-racial measure of segregation using data from 2010 decennial census, supplemented, with data from the more recent American Community Survey (ACS) estimates where noted.11
To measure and represent segregation spatially, we employ the Divergence Index, a decomposable measure of segregation which measures the difference between the overall proportion of a group in a region and the proportion of each group in a local area within that region.12 Unlike many other measures of segregation, the Divergence Index can measure a region’s segregation for multiple racial groups simultaneously. A comparison of this measure with alternative measures of segregation will be presented in the third brief in this series.
Immediately below is a map of the entire Bay Area. This map illustrates the degree of racial segregation across the region. The region, and each of the county and MSA maps presented in this brief, are shaded into three categories illustrating the degree of segregation measured for that geography: high, moderate, or low. In each map, census tracts are shaded based upon their divergence index score.13 Each map also contains a pie chart indicating the racial breakdown of the larger geography presented. In the county and MSA maps, some tracts are encircled by a boundary color indicating a racial group that predominates, corresponding to the pie chart.
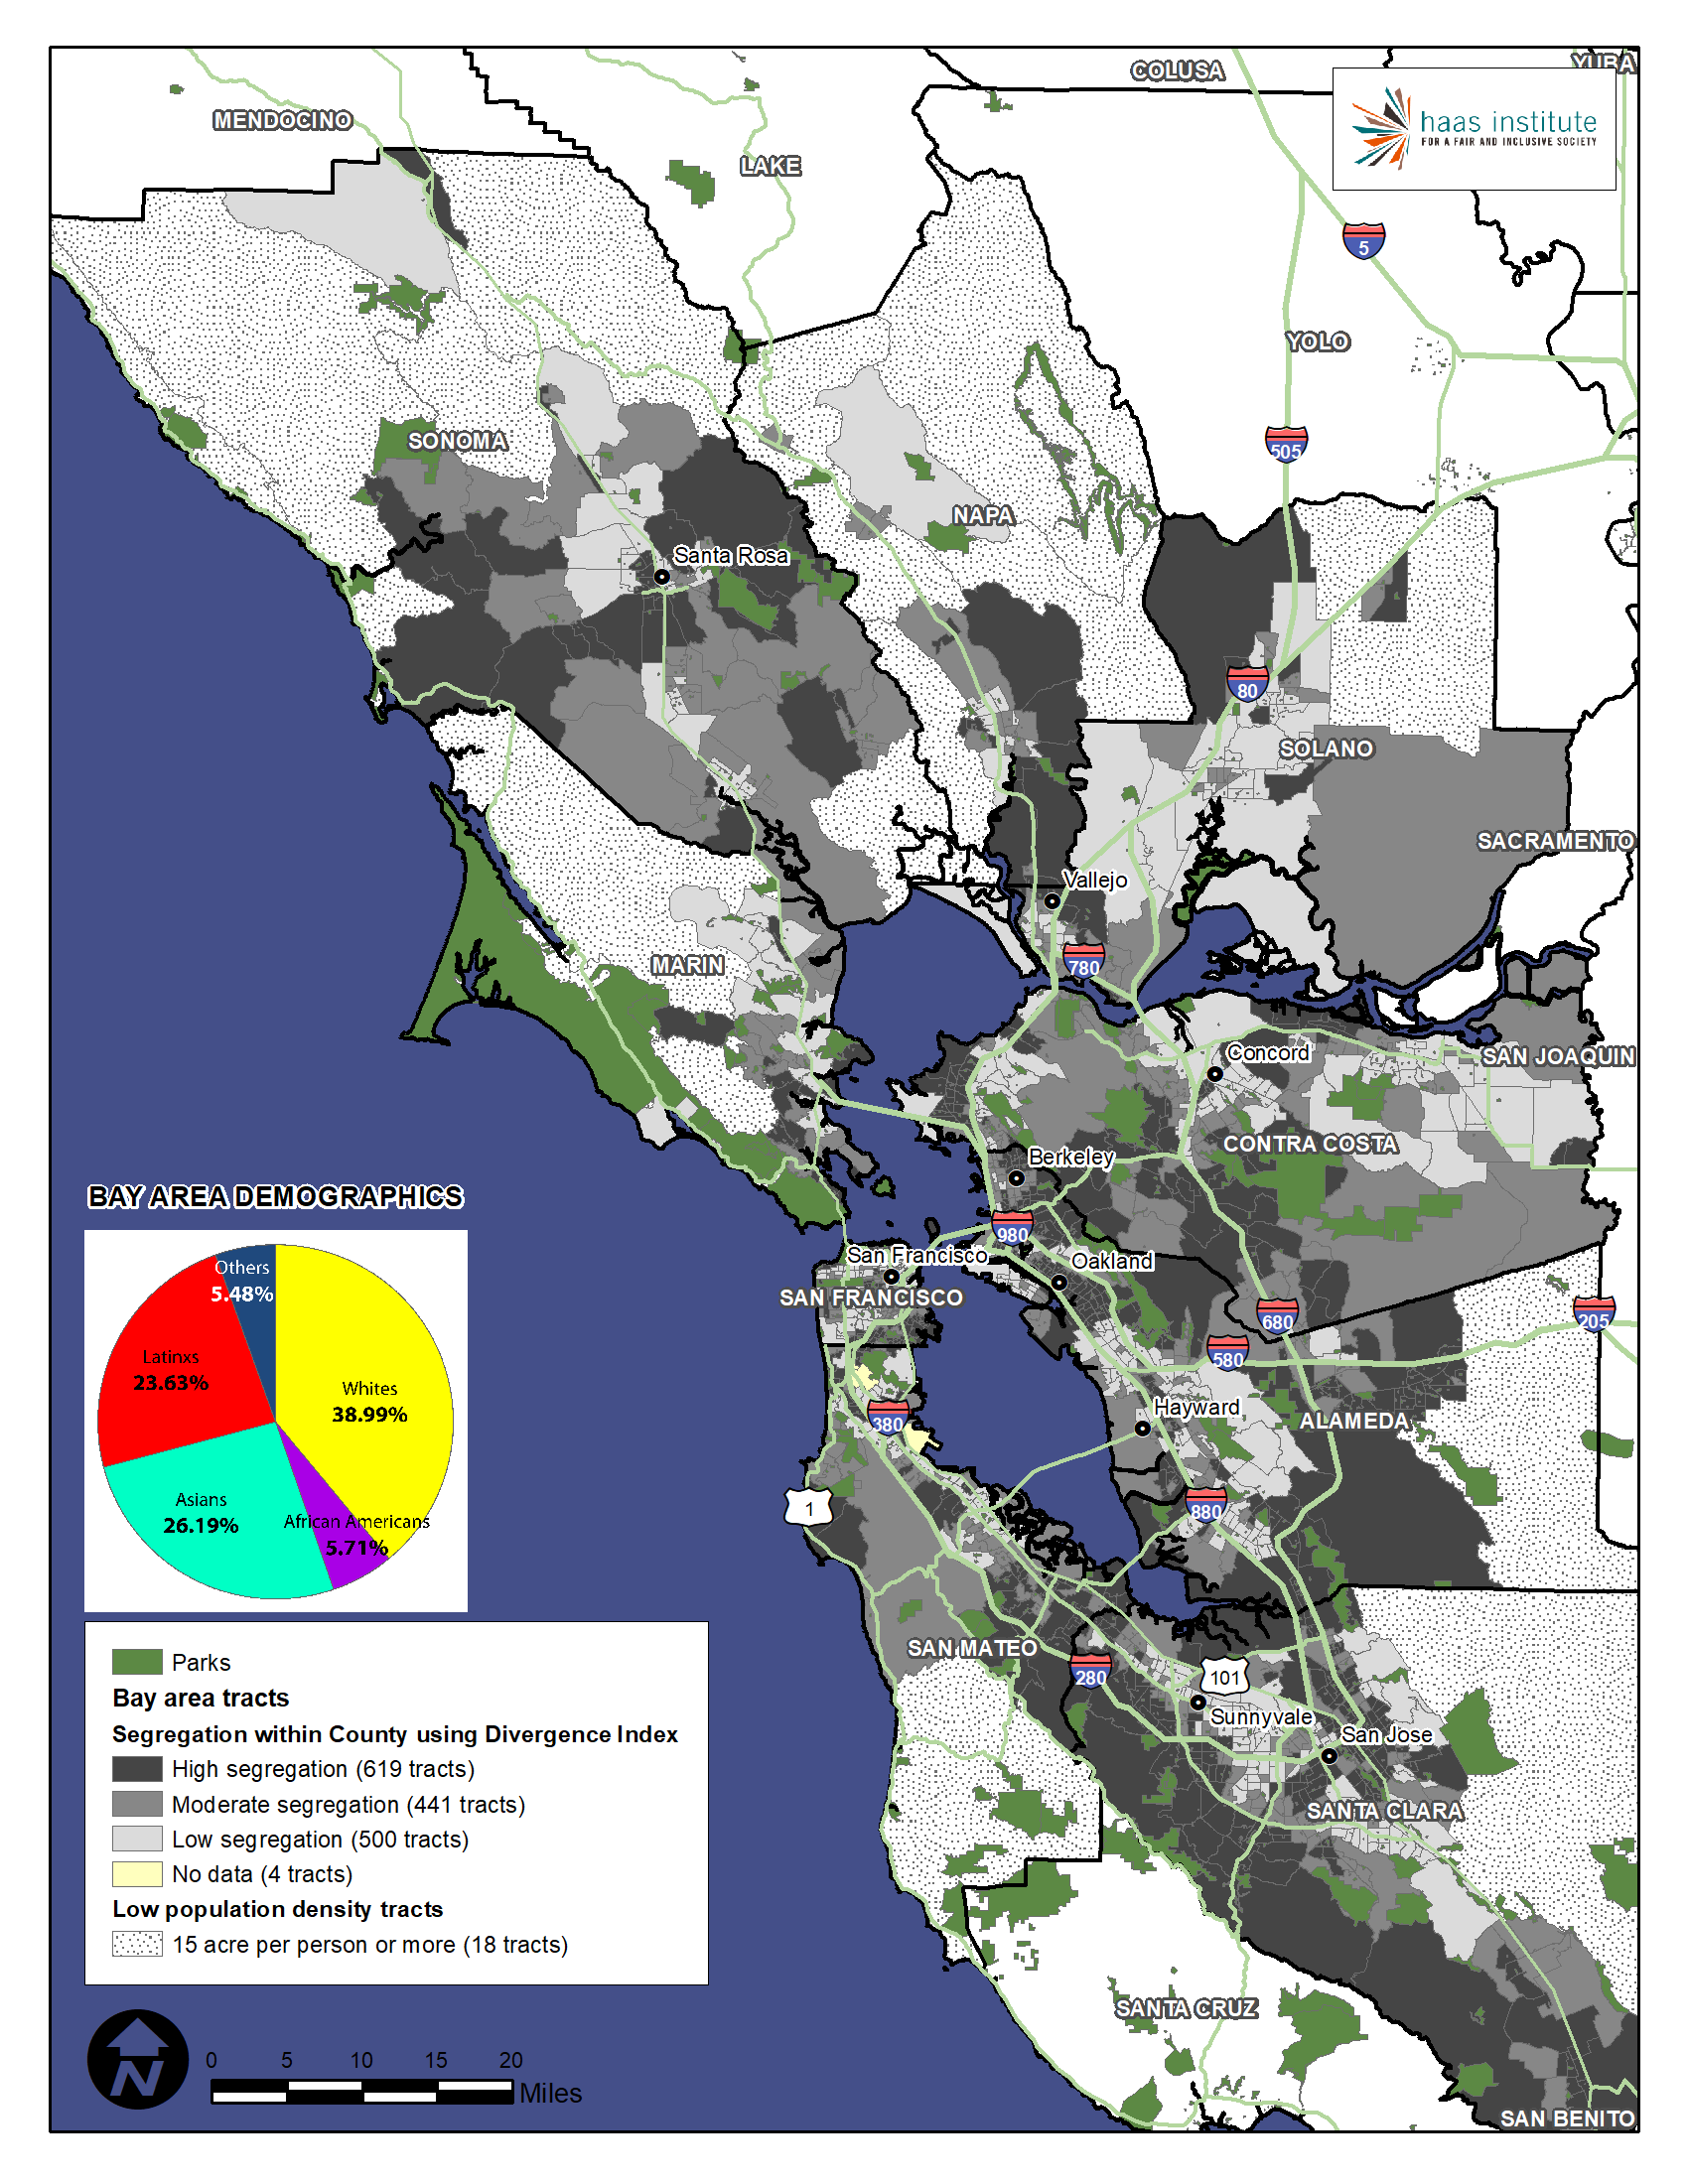
The San Francisco Bay Area is a racially, geographically, and economically diverse region of more than seven million people and more than 100 incorporated municipalities contained within nine counties. The demographic profiles and levels of racial diversity in each of the counties vary considerably from the region as a whole, especially those further from the core of the region or major urban centers. For that reason, the regional map above and the individual county maps below illustrate the divergence between census tracts and each county as a whole rather than census tracts and the entire region as a whole.14 This allows us to observe the degree of divergence from a more appropriate context, especially for the whiter and more rural counties.15
As the map above suggests, we find racial segregation in every county and MSA in the region.16 Despite the racial diversity that exists through most of the Bay Area, segregated neighborhoods exist in every part of the region, from north to south, and east to west. As we will indicate, far too few census tracts in the region resemble the populations in the Bay Area as a whole, let alone of the counties or MSAs in which they reside.
As a byproduct of this research, we found two general forms of segregation in the region: inter-municipal and intra-municipal. Most of the traditionally recognized “segregated neighborhoods,” where people of color were historically restricted on account of redlining and other forms of housing discrimination, are typically found within the larger, broadly diverse municipalities such as San Francisco, Oakland, San Jose, and mid-sized cities such as Berkeley and Richmond. The displacement of many people of color from these communities and the corresponding in-migration of white families over the last twenty years has diversified the municipal populations in these cities, but has not always resulted in more integrated neighborhoods.17 Thus, although these cities are diverse in aggregate, they tend to contain some of the most racially segregated non-white neighborhoods in the Bay Area.
Much of the racial segregation observed in the Bay Area, on the other hand, exists between municipal boundaries. That is, the segregation of one group into a particular municipality or maintenance of historically segregated residential patterns has as a corollary the segregation of many members of other racial groups into other racially segregated cities and or neighborhoods in other cities. Inter-municipal or inter-district segregation is why, as many educational experts have noted, American schools remain stubbornly segregated.18 This also why, although a majority of the most highly segregated neighborhoods for people of color are found in the largest cities in the region, the most segregated white neighborhoods are in small or mid-sized cities.
Although only suggested by the above map, we find that whites are the most segregated racial group in the region.19 Although whites are just under 40 percent of the population of the Bay Area, 184 census tracts (of 1582) are more than 75 percent white, 359 tracts are more than 66 percent white, and 663 tracts are more than 50 percent white. Some of this is explained by the fact that the more rural counties of Marin, Sonoma, and Napa have proportionally much larger white populations than counties such as Contra Costa, Alameda and San Francisco. But whites are the most segregated group even in counties where they are a racial plurality and/or a minority, and have less exposure to members of other racial groups than any other racial group has to each other.20
It may seem strange to describe whites as the most segregated racial group, but it is a byproduct of the segregation of people of color. The more effective whites are at segregating themselves from people of color, the more segregated people of color will be overall. The segregation of non-whites into disproportionately non-white neighborhoods results in whites residing in disproportionately whiter neighborhoods. Non-white and white segregation are reciprocal; they are flip sides of the same coin. The fact that whites are the most segregated racial group reflects this, but it also suggests that people of color are less segregated from each other than they are from whites.
Although Asians are just 26 percent of the population of the Bay Area, they are a majority of the population is 181 census tracts, more than 66 percent in 50 census tracts, and compose 75 percent or more in 18 census tracts.
Latinos are 24 percent of the population in the Bay Area, but are 50 percent or more of the population 143 census tracts, more than 66 percent of the population in 50 census tracts, and more than 75 percent of the population in 20 census tracts.
African Americans are just 6 percent of the population of the Bay Area, but are more than 25 percent of the population in 93 census tracts, more than 40 percent of the population in 40 census tracts, and more than 50 percent of the population in 18 census tracts. African Americans are the most racially concentrated group in the Bay Area, with 75 percent of the Bay Area’s Black residents residing in just 26 percent of the region’s census tracts.
As we will show in future briefs, these patterns of racial segregation are not “natural,” or simply the result of individual housing preferences, but the byproduct of exclusionary policies as well as private housing discrimination. The extreme segregation of whites into cities such as Piedmont, Lafayette, Atherton, Menlo Park, and Walnut Creek is the result of processes that also segregate people of color in other places. As a result, for example, African-Americans are segregated into neighborhoods such as Hunter’s Point in San Francisco, and East Oakland and West Oakland, as you can see in the Alameda County map below.
Segregation by County in the Bay Area
Alameda County
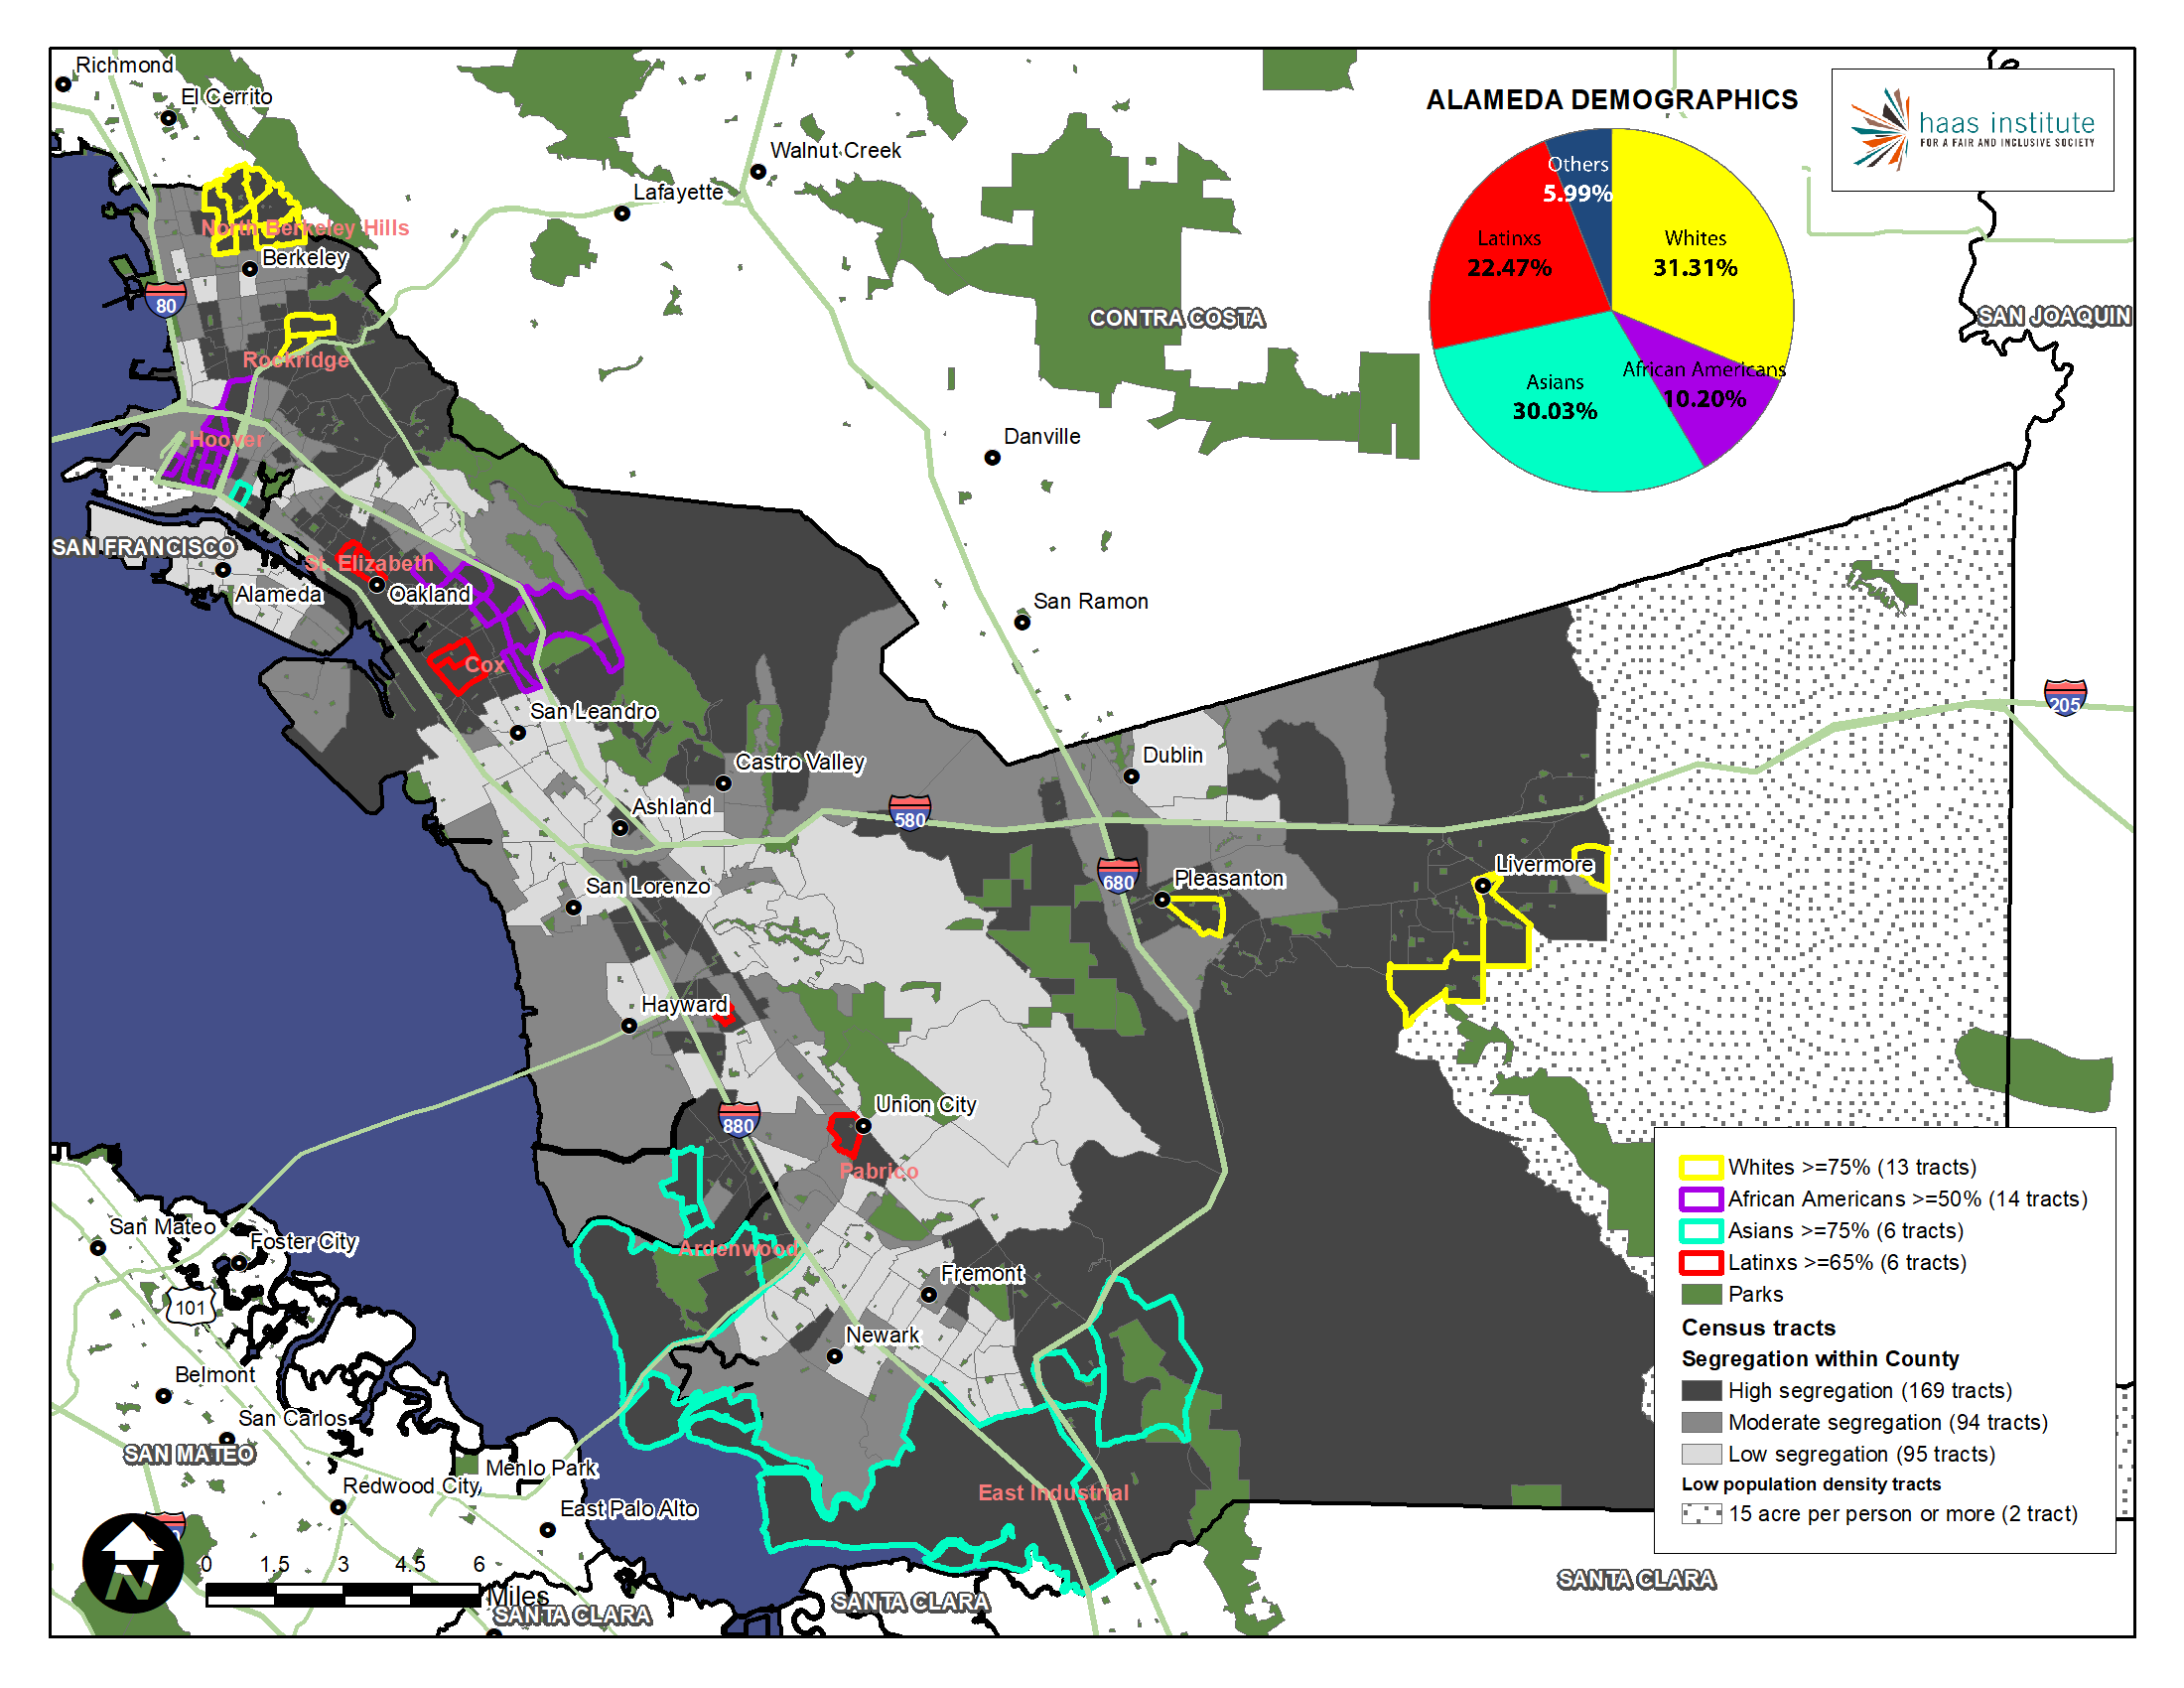
Featuring one of the most vibrant and diverse metropolitan areas in the nation, Alameda County contains the city of Oakland and surrounding suburbs and much of what is regarded as “the East Bay.” Yet, as this map vividly illustrates, its racial diversity is not reflected in most of the communities within the county. Less than one in five census tracts reflect the demographics of the county for any racial group. Just 19 percent of its tracts have a similar proportion of white people to the county's population. For Latinos, Asian, and Black people, those percentages are 19 percent, 15 percent, and 18 percent, respectively.
Overall, the diversity of the county is spread into particular, racially identifiable cities and enclaves within the county. Only a few places like Newark, which is 26 percent white, 30 percent Asian, 5 percent black, and 34 percent Latino, and San Leandro (26 percent white, 37 percent Asian, 8 percent black, and 22 percent Latino) approximates the demographics of the county as a whole. Dublin and Emeryville are among the more integrated cities, although they are predominantly and more heavily white.
Cities such as Piedmont just north of Oakland, and Pleasanton and Livermore in the eastern reaches of the county typify the heavily white suburb, with populations that are roughly two-thirds white (30 percent greater than the county as a whole), 1-3 percent Black, and the remainder Latino and/or Asian. As we will see in the next brief in this series, these patterns of racial segregation are historical in nature, and not of recent origin.
The cities of Albany, Alameda, Castro Valley are (moderately) segregated and predominantly white, although less intensely than the cities just mentioned, largely on account of heavier Asian minority populations. These cities are roughly 44-48 percent white, with 19-27 percent Asian, and 13-20 percent Latino, and 4-9 percent black.
Cities like Fremont and Union City in the southern and southwestern part of the county illustrate another expression of segregation. Asians constitute 61 percent of the demographics of Fremont, with whites at 19 percent, and Latinos at 13 percent, and just 2 percent African-American. Union City is 56 percent Asian, 15 percent white, 5 percent black, and 18 percent Latino. Both cities are diverse, but also with strong Asian majorities and therefore segregated. Hayward similarly expresses this type of segregation, but with a heavy Latino plurality.
Although most of the segregation within Alameda County is inter-municipal -- meaning that the segregation of whites and non-whites is reciprocal, a number of cities exhibit a strong degree of intra-municipal or neighborhood segregation. Although the city of Oakland is exceptionally diverse (27 percent white, 15 percent Asian, 28 percent Latino, 23 percent Black), it contains some of the most segregated neighborhoods in the Bay Area. As the map above illustrates, African Americans in particular are racially segregated in the eastern flatlands of Oakland and west Oakland, while the Oakland hills are disproportionately white. In fact, 8 of the 10 most segregated census tracts in the entire Bay Area for African Americans are located in Alameda County.21
The city of Berkeley also reflects this basic pattern, while not as diverse as Oakland. Berkeley is 52 percent white, and 48 percent people of color, but the white population is segregated into the northern part of the city, and a sizable racially segregated Black population wedged into census tracts in the southern part of the city. This pattern, like most of the segregation found in the Bay Area, is a continuation of historical patterns set decades ago.22
Contra Costa County
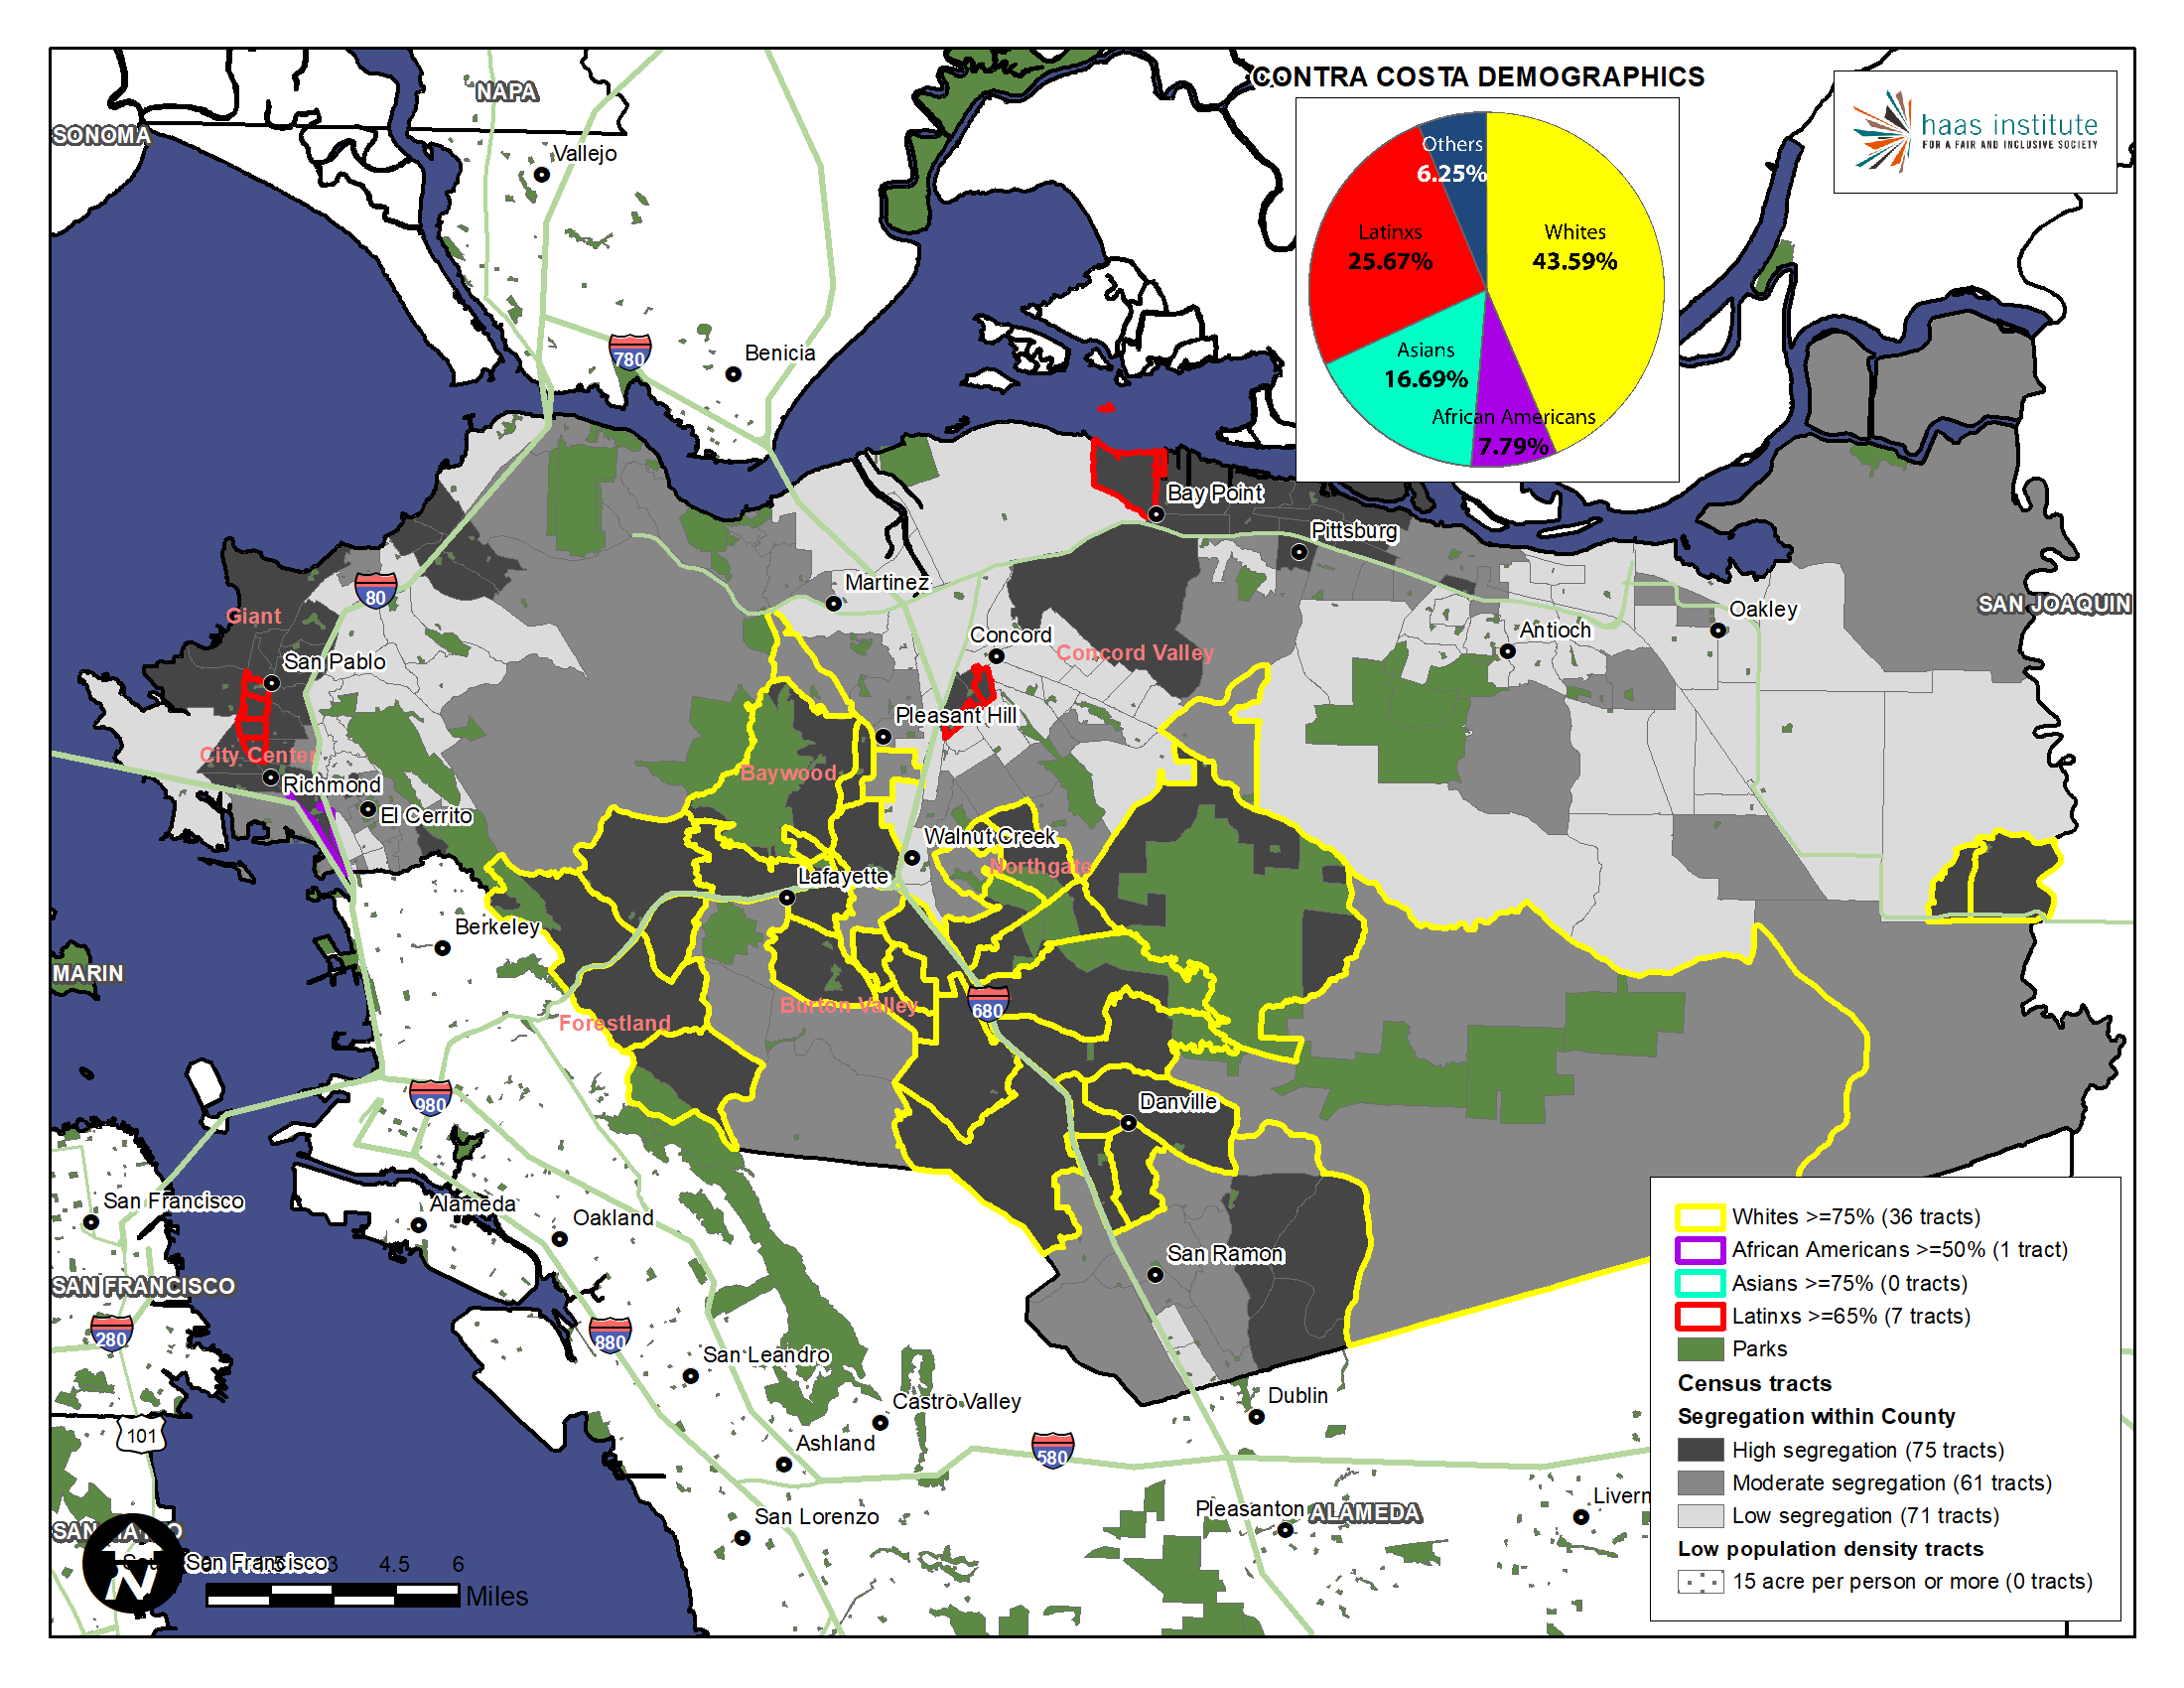
Contra Costa County is home to nearly two dozen cities of varying size and demographics.23 Like Alameda County, it is a county of stark racial segregation. Just 20 percent of its tracts have a similar proportion of white people to the county's population. For Latinos, Asian, and Black people, those percentages are 16 percent, 20 percent, and 9 percent, respectively.
The most segregated and heavily white cities in the county are Walnut Creek, Lafayette, and Martinez, which epitomize the affluent white suburb. In fact, two of the most racially segregated white neighborhoods in the entire Bay Area are located in Walnut Creek, which is 63 percent white. Martinez is 69 percent white, and Lafayette is a scale topping 77 percent white, a remarkable instance of white exclusivity.
Along with these three cities, the communities of Clayton, Danville, Moraga, Pleasant Hill, and Orinda are also segregated, heavily-white cities. These cities are 63-78 percent white, 1-3 percent Black, 6-11 percent Latino, and 7-20 percent Asian. These are followed by the less intensely segregated, but still heavily white cities such as Concord and Brentwood, which are 52-53 percent white, 3-6 percent Black, 8-14 percent Asian, and 26-27 percent Latino.
At the extreme western side of the county is the city of Richmond and the unincorporated area of North Richmond. Richmond is home to the Chevron refinery, but was also a hub for factory workers during World War II, and recruited thousands of African Americans to its shipyards. Richmond’s neighborhoods are highly segregated by race, especially for Latinos and African Americans. Although the Black population has declined in numbers substantially in recent years, partly as a result of displacement and gentrification, Richmond is currently 18 percent African American, 17 percent white, 13 percent Asian, and 48 percent Latino.
Richmond, like Pittsburg and San Pablo, are segregated communities that are heavily Latino, much like Hayward in Alameda County. San Ramon and Hercules are the most segregated, but predominantly Asian communities in Contra Costa County, and the analogs to Fremont and Union City in Alameda County
Pinole is the most integrated city in Contra Costa County, with a population that is 35 percent white, 26 percent Latino, 22 percent Asian, and 8 percent Black. Antioch, the second largest city in the county, is the next most integrated, although more heavily Black and Latino, with a population that is 26 percent white, 34 percent Latino, 19 percent Black, and 13 percent Asian. These communities are the near mirror opposites of cities in the eastern and central reaches of the county.
Santa Clara County
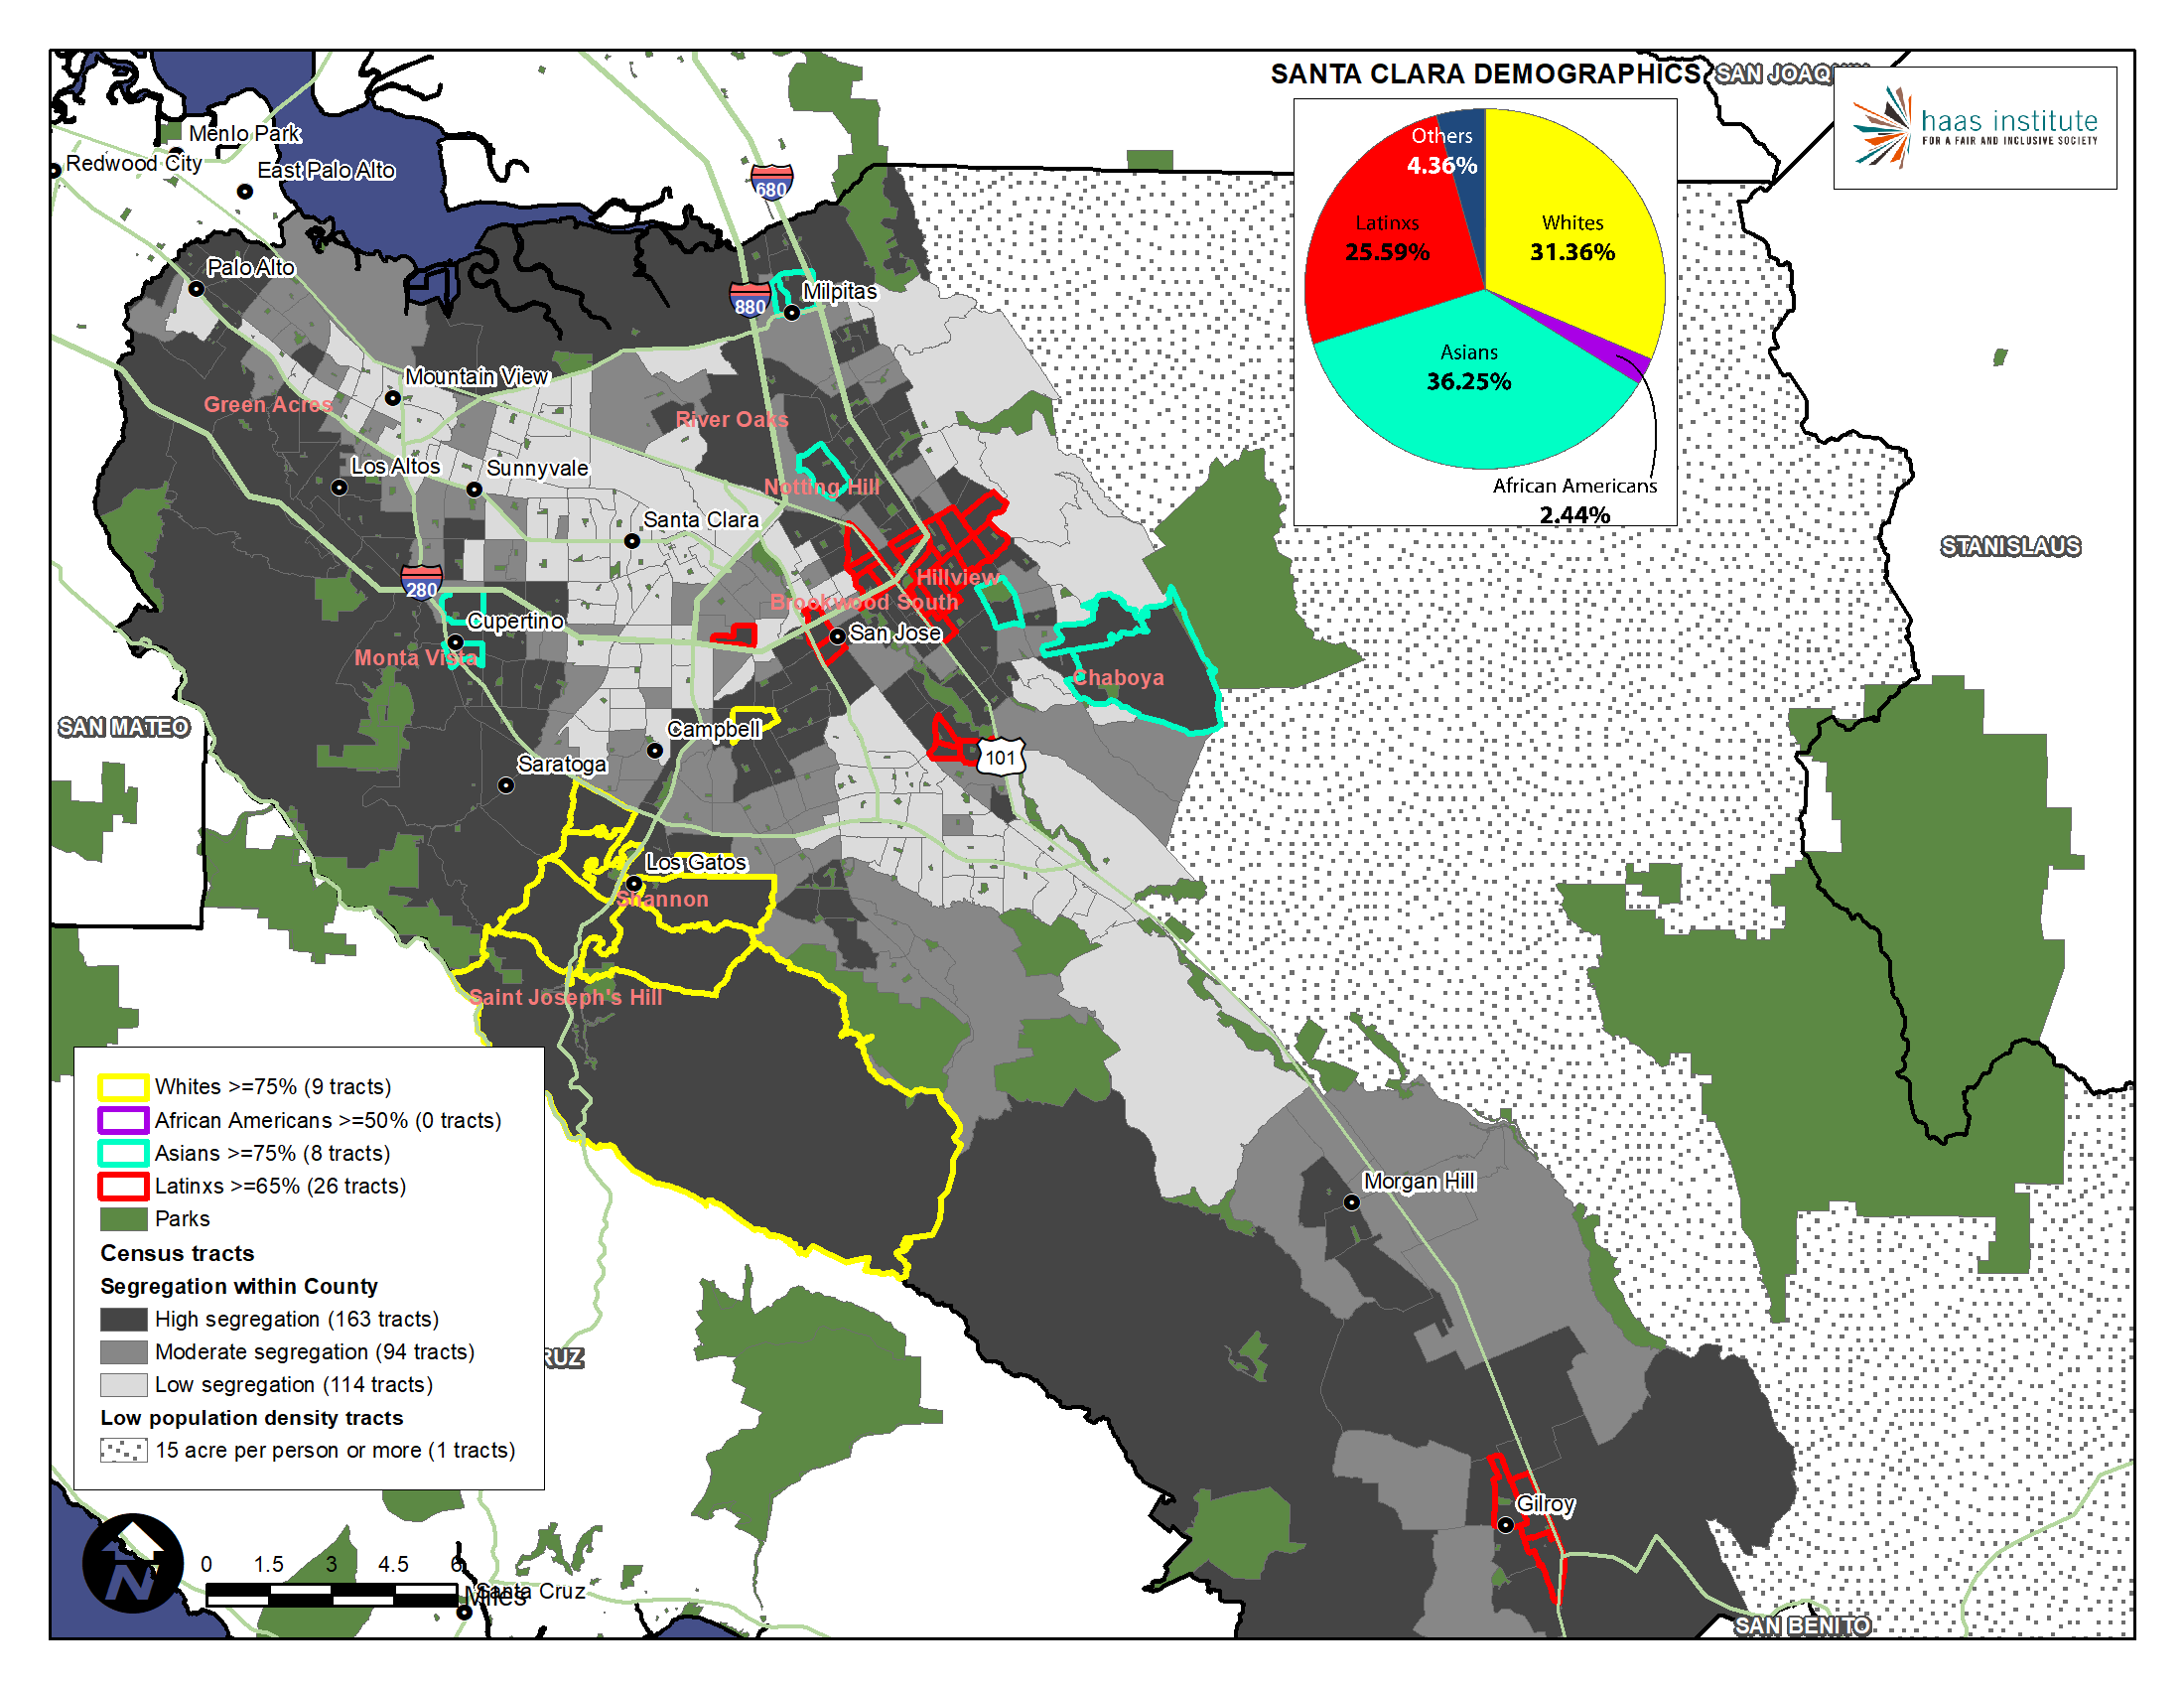
Home to Silicon Valley, Santa Clara County is one of the most economically prosperous counties in the United States. It is also home to many traditional working-class communities and neighborhoods and even contains rural communities such as Gilroy. Given the diversity of people residing in Santa Clara County, its neighborhoods and communities remain remarkably segregated. In fact, two of ten the most segregated Latino neighborhoods in the entire Bay Area are in Gilroy.
In general, however, each racial group is about equally segregated from one another within Santa Clara County. Just 19 percent of its tracts have a similar proportion of white people to the county's population. For Latinos, Asian, and Black people, those percentages are 19 percent, 19 percent, and 20 percent, respectively.
San Jose is one of the largest and most diverse cities in the Bay Area. Its population is 26 percent white, 32 percent Latino, 35 percent Asian, and 3 percent Black. However, like Oakland, its neighborhoods do not reflect the diversity found across the metropolitan region, let alone within the city limits. Two of the census tracts in north San Jose are among the five most segregated for Asians in the entire Bay Area. Latinos are also incredibly segregated into the neighborhoods of San Jose. Six of the 10 most segregated neighborhoods in the entire Bay Area for Latinos are found in Santa Clara County, in places like Gilroy and the environs of San Jose.
Monte Sereno city, Los Gatos, Los Altos, Los Altos Hills, Campbell, and Palo Alto are the most segregated, heavily white cities in the county, with populations that range from 55-78 percent white, 0-2 percent black, 2-18 percent Latino, and 14-33 percent Asian. They are followed by predominantly white, but more Asian cities like Morgan Hill and Saratoga.
Gilroy is a highly segregated and 60 percent Latino community in the southeastern part of the county, while Milpitas and Cupertino are mirror opposites for Asians, but with 62 and 66 percent Asian populations, respectively.
There is no truly integrated city in Santa Clara County like Pinole or Newark in Contra Costa and Alameda counties, but the most diverse and integrated cities are Mountain View, Santa Clara, and Sunnyvale.
San Francisco County
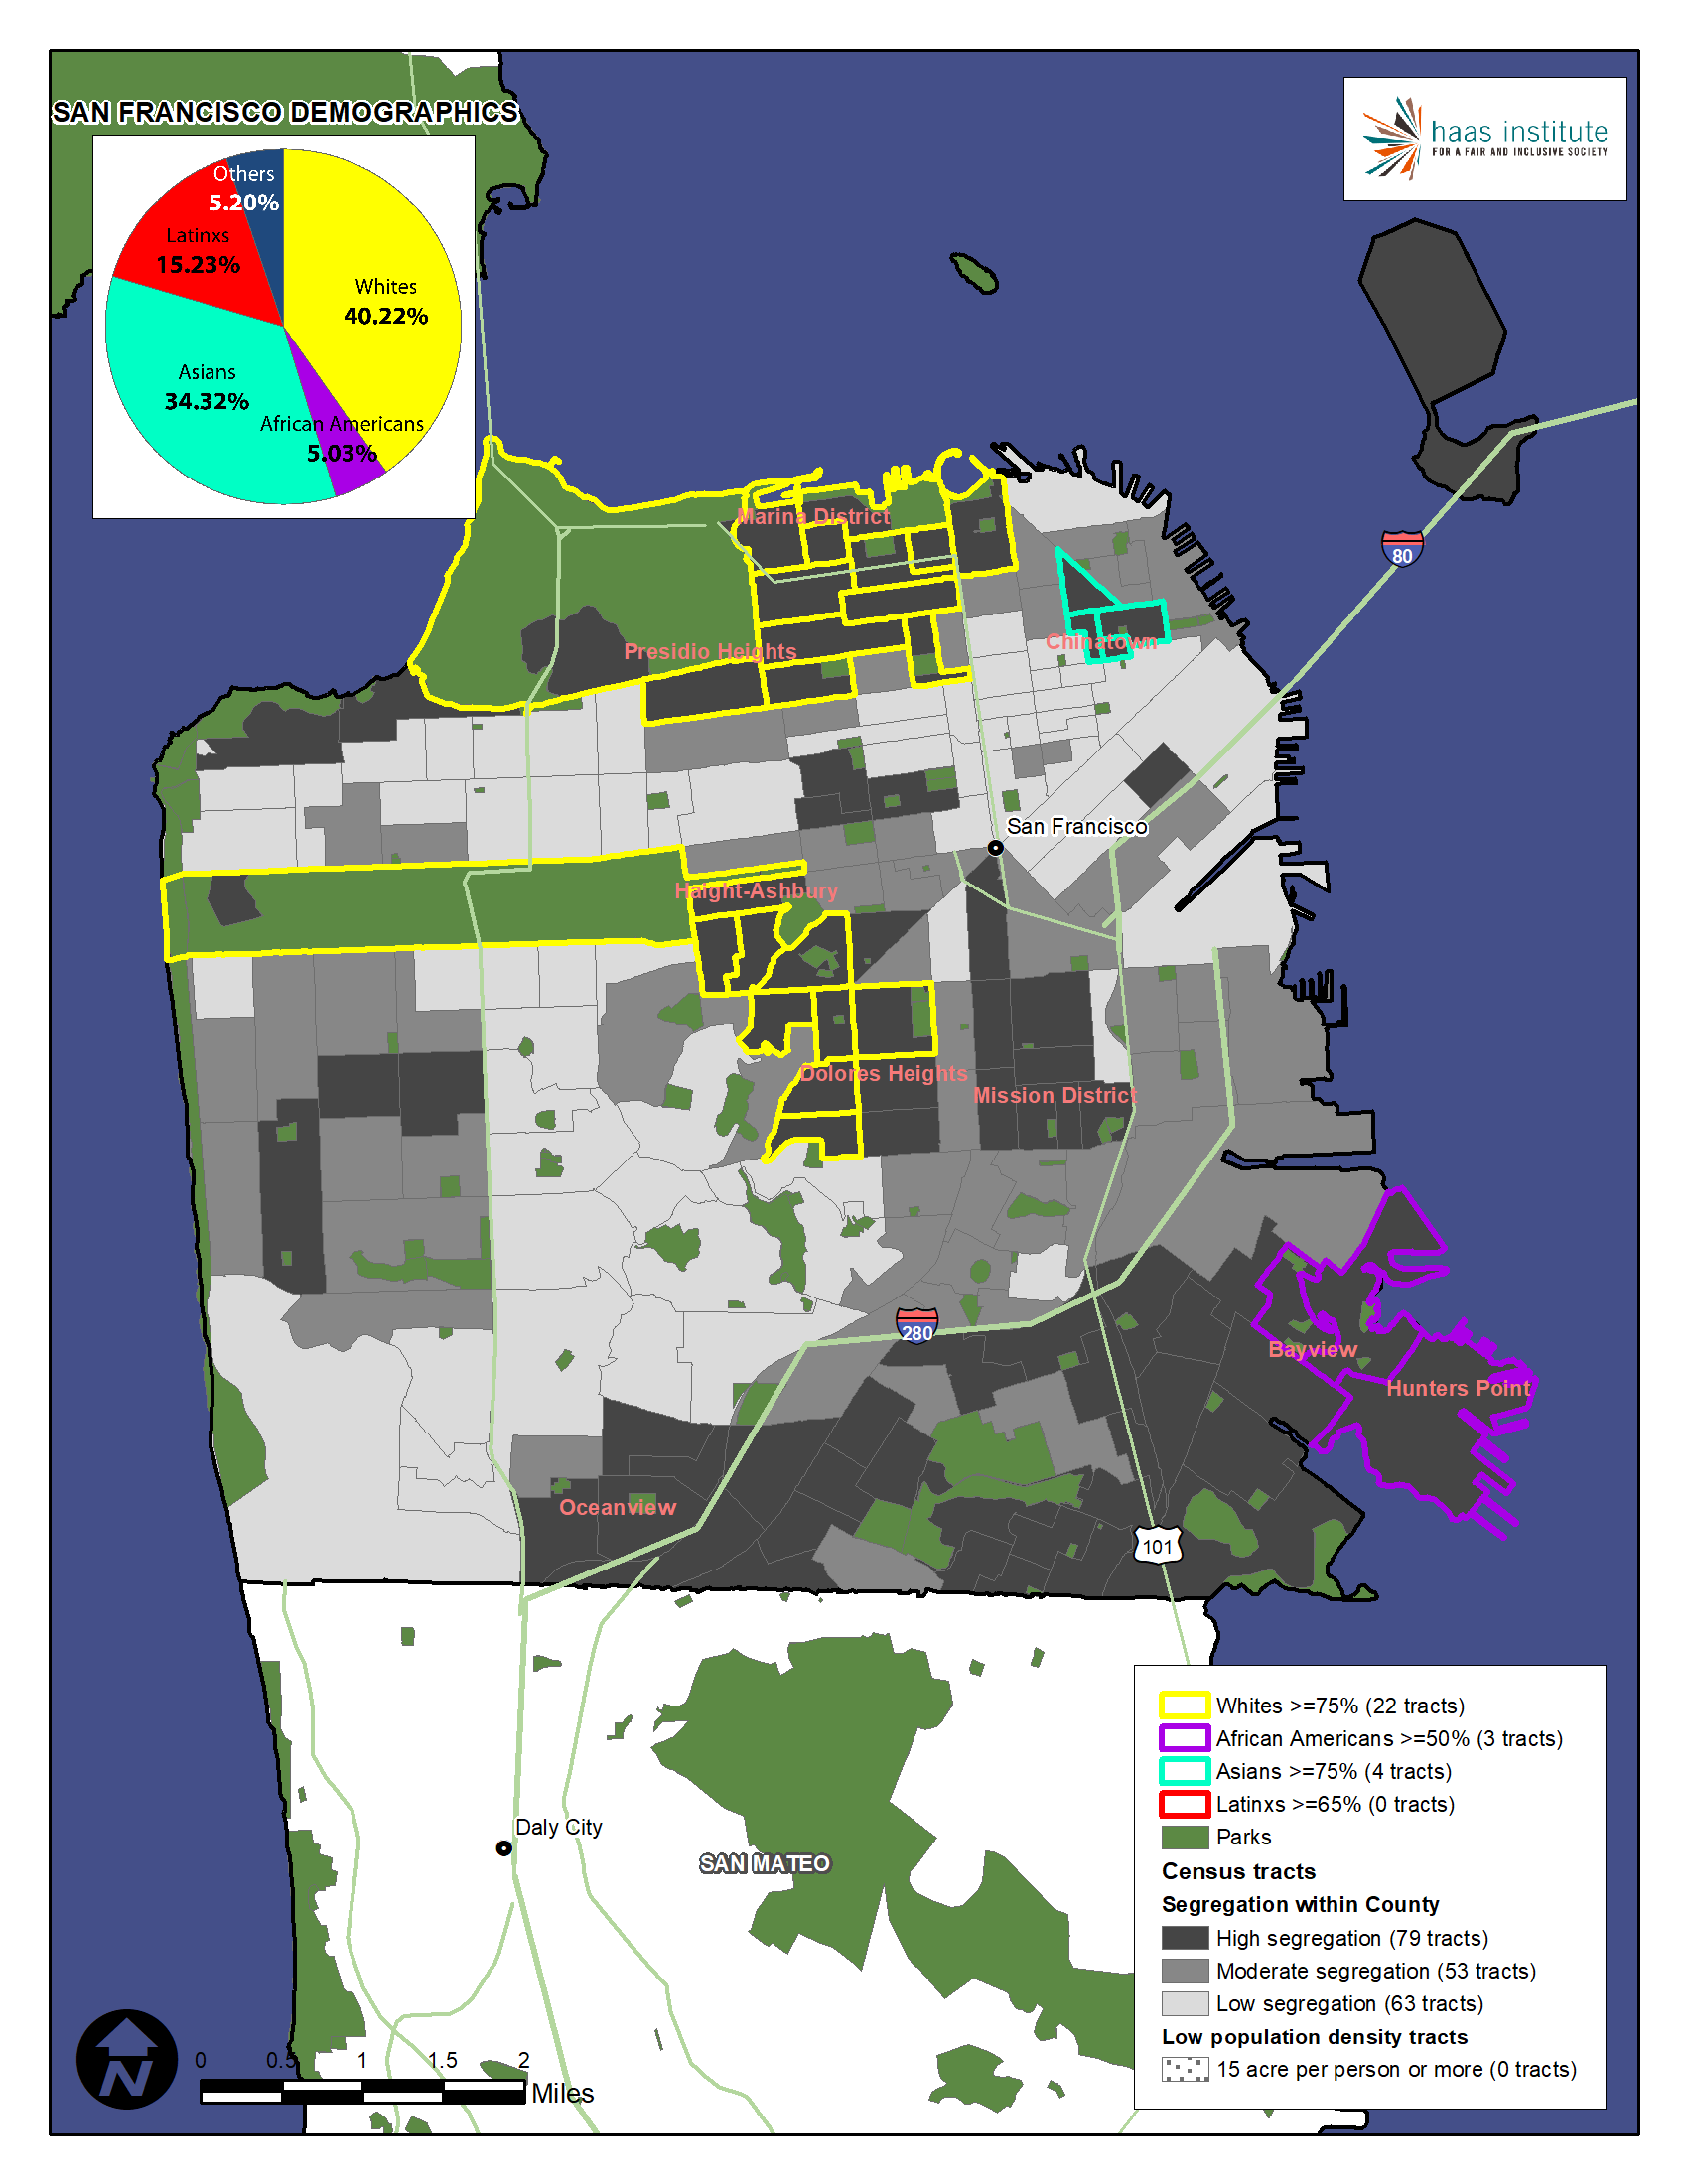
San Francisco County has almost the exact same boundaries as with the city of San Francisco. For that reason, the city and county can be described interchangeably. A richly diverse place, there is a surprising degree of racial segregation which belies its inclusive reputation. Few census tracts reflect the demographics of the county for any racial group. Just 29 percent of its tracts have a similar proportion of white people to the county's population.24 For Latinos, Asian, and Black people, those percentages are 14 percent, 23 percent, and 9 percent, respectively.
Although African Americans are just 5 percent of the population (as of 2017), they are intensely clustered into the Hunter’s Point/Bayview neighborhoods and some parts of the downtown area. This is a consequence of the extremely high cost of housing and rents in San Francisco, but it is also a result of historical patterns of segregation which prevented blacks from moving into other neighborhoods.
A similar story could be told about Asians during the nineteenth and early twentieth centuries regarding San Francisco’s famous Chinatown which carefully restricted where Asians could live. The Mission, once an overwhelmingly Latino neighborhood, has been radically gentrified in recent years with many of its original and long-term residents pushed out by rising costs. Whites are disproportionately concentrated in the northern and central parts of San Francisco, especially the Presidio.
San Mateo County
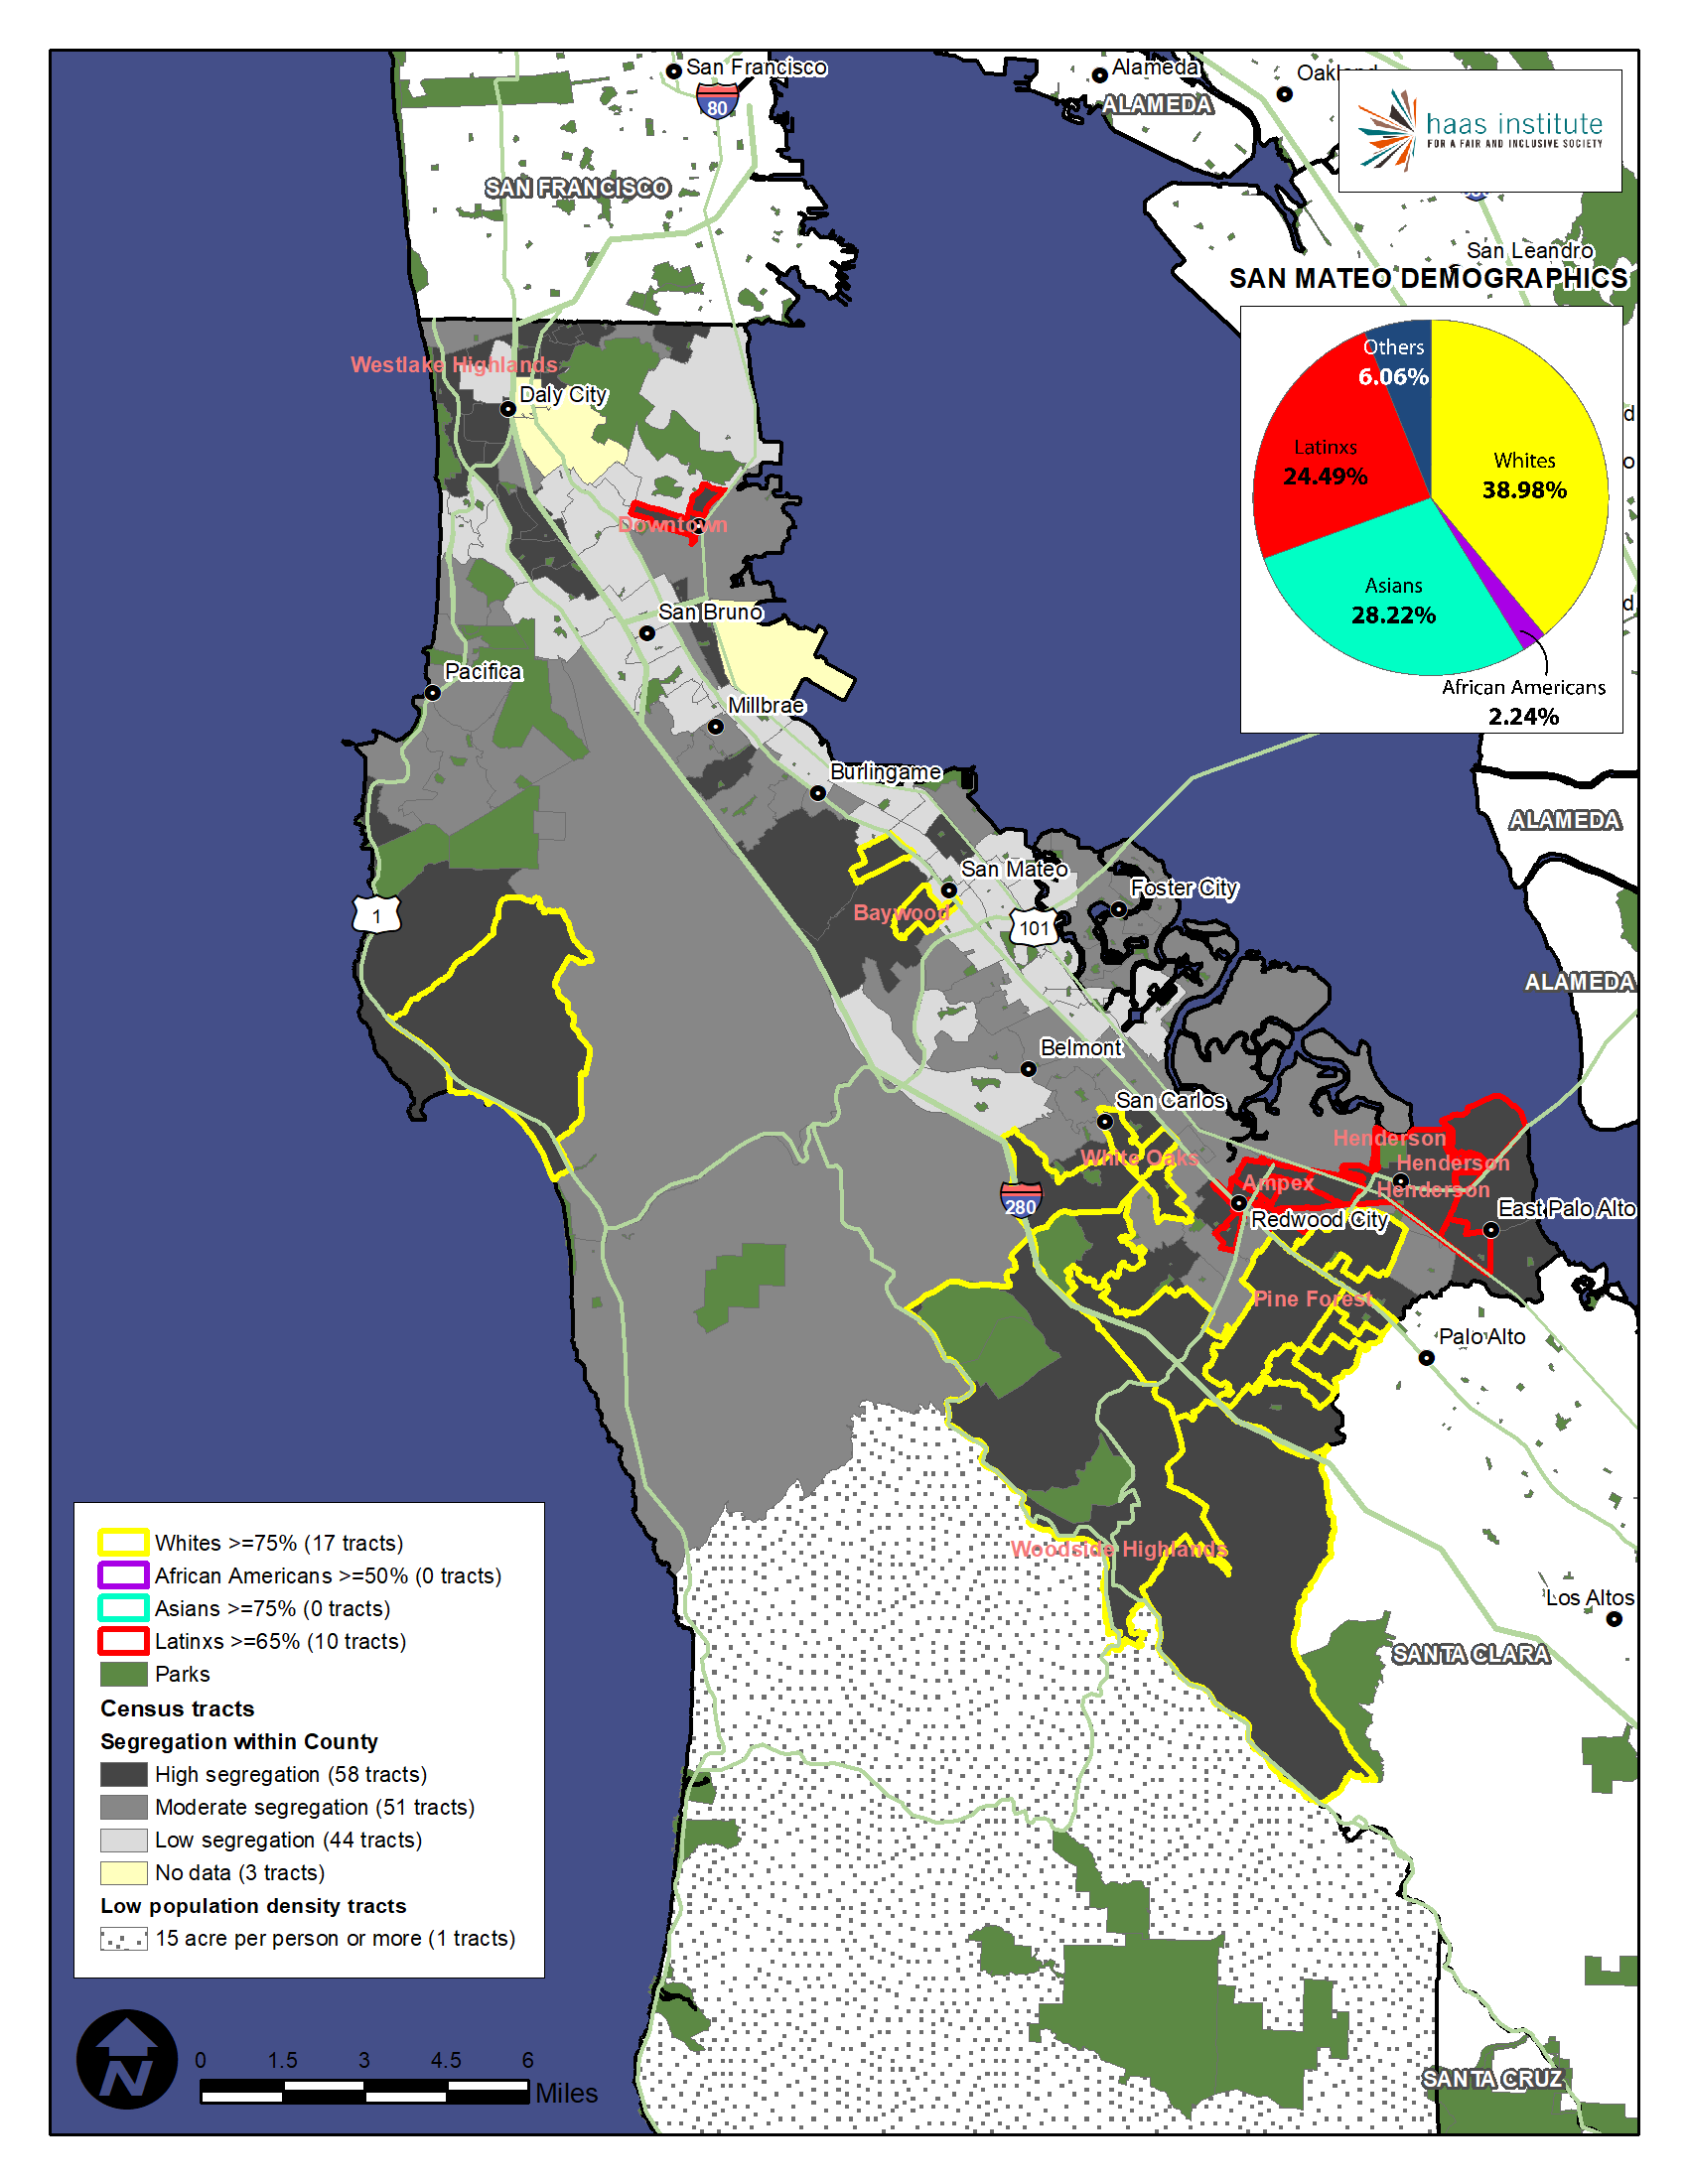
San Mateo County extends south of San Francisco to encompass the San Francisco airport and suburbs and the northern part of Silicon Valley. It is therefore one of the most affluent places in America and home to a number of corporate campuses for Fortune 500 and 100 companies. It is also a highly segregated county. Few census tracts reflect the demographics of the county for any racial group. Just 24 percent of its tracts have a similar proportion of white people to the county's population. For Latinos, Asian, and Black people, those percentages are 21 percent, 15 percent, and 15 percent, respectively.
Research shows that regions with higher levels of municipal fragmentation tend to be more segregated.25 Like Contra Costa and Santa Clara counties, San Mateo County is municipally fragmented with nearly two dozen relatively small incorporated jurisdictions, and many smaller unincorporated ones. It differs from those counties however, in that it lacks an urban core.
The small but extremely wealthy city of Atherton, which is 75 percent white, 14 percent Asian, 5 percent Latino, and less than 1 percent black, epitomizes the segregated, exclusive community. This segregation is the corollary of the segregation of places like East Palo Alto. East Palo Alto is also a historically significant site of racial segregation, and remains so today, but for Latinos rather than African Americans. Additionally, Redwood City has roughly 40 percent of whites and Latinos, which seems more diverse but racial groups are segregated in their own enclaves.
Millbrae and Daly City are moderately segregated, and have a predominantly Asian population.
San Bruno is the most diverse and racially integrated city in the county, with a population that is 35 percent white, 2 percent black, 28 percent Asian, and 28 percent Latino. Although San Mateo City also has a disproportionately small Black population, it is also one of the more integrated cities in the county.
Marin County
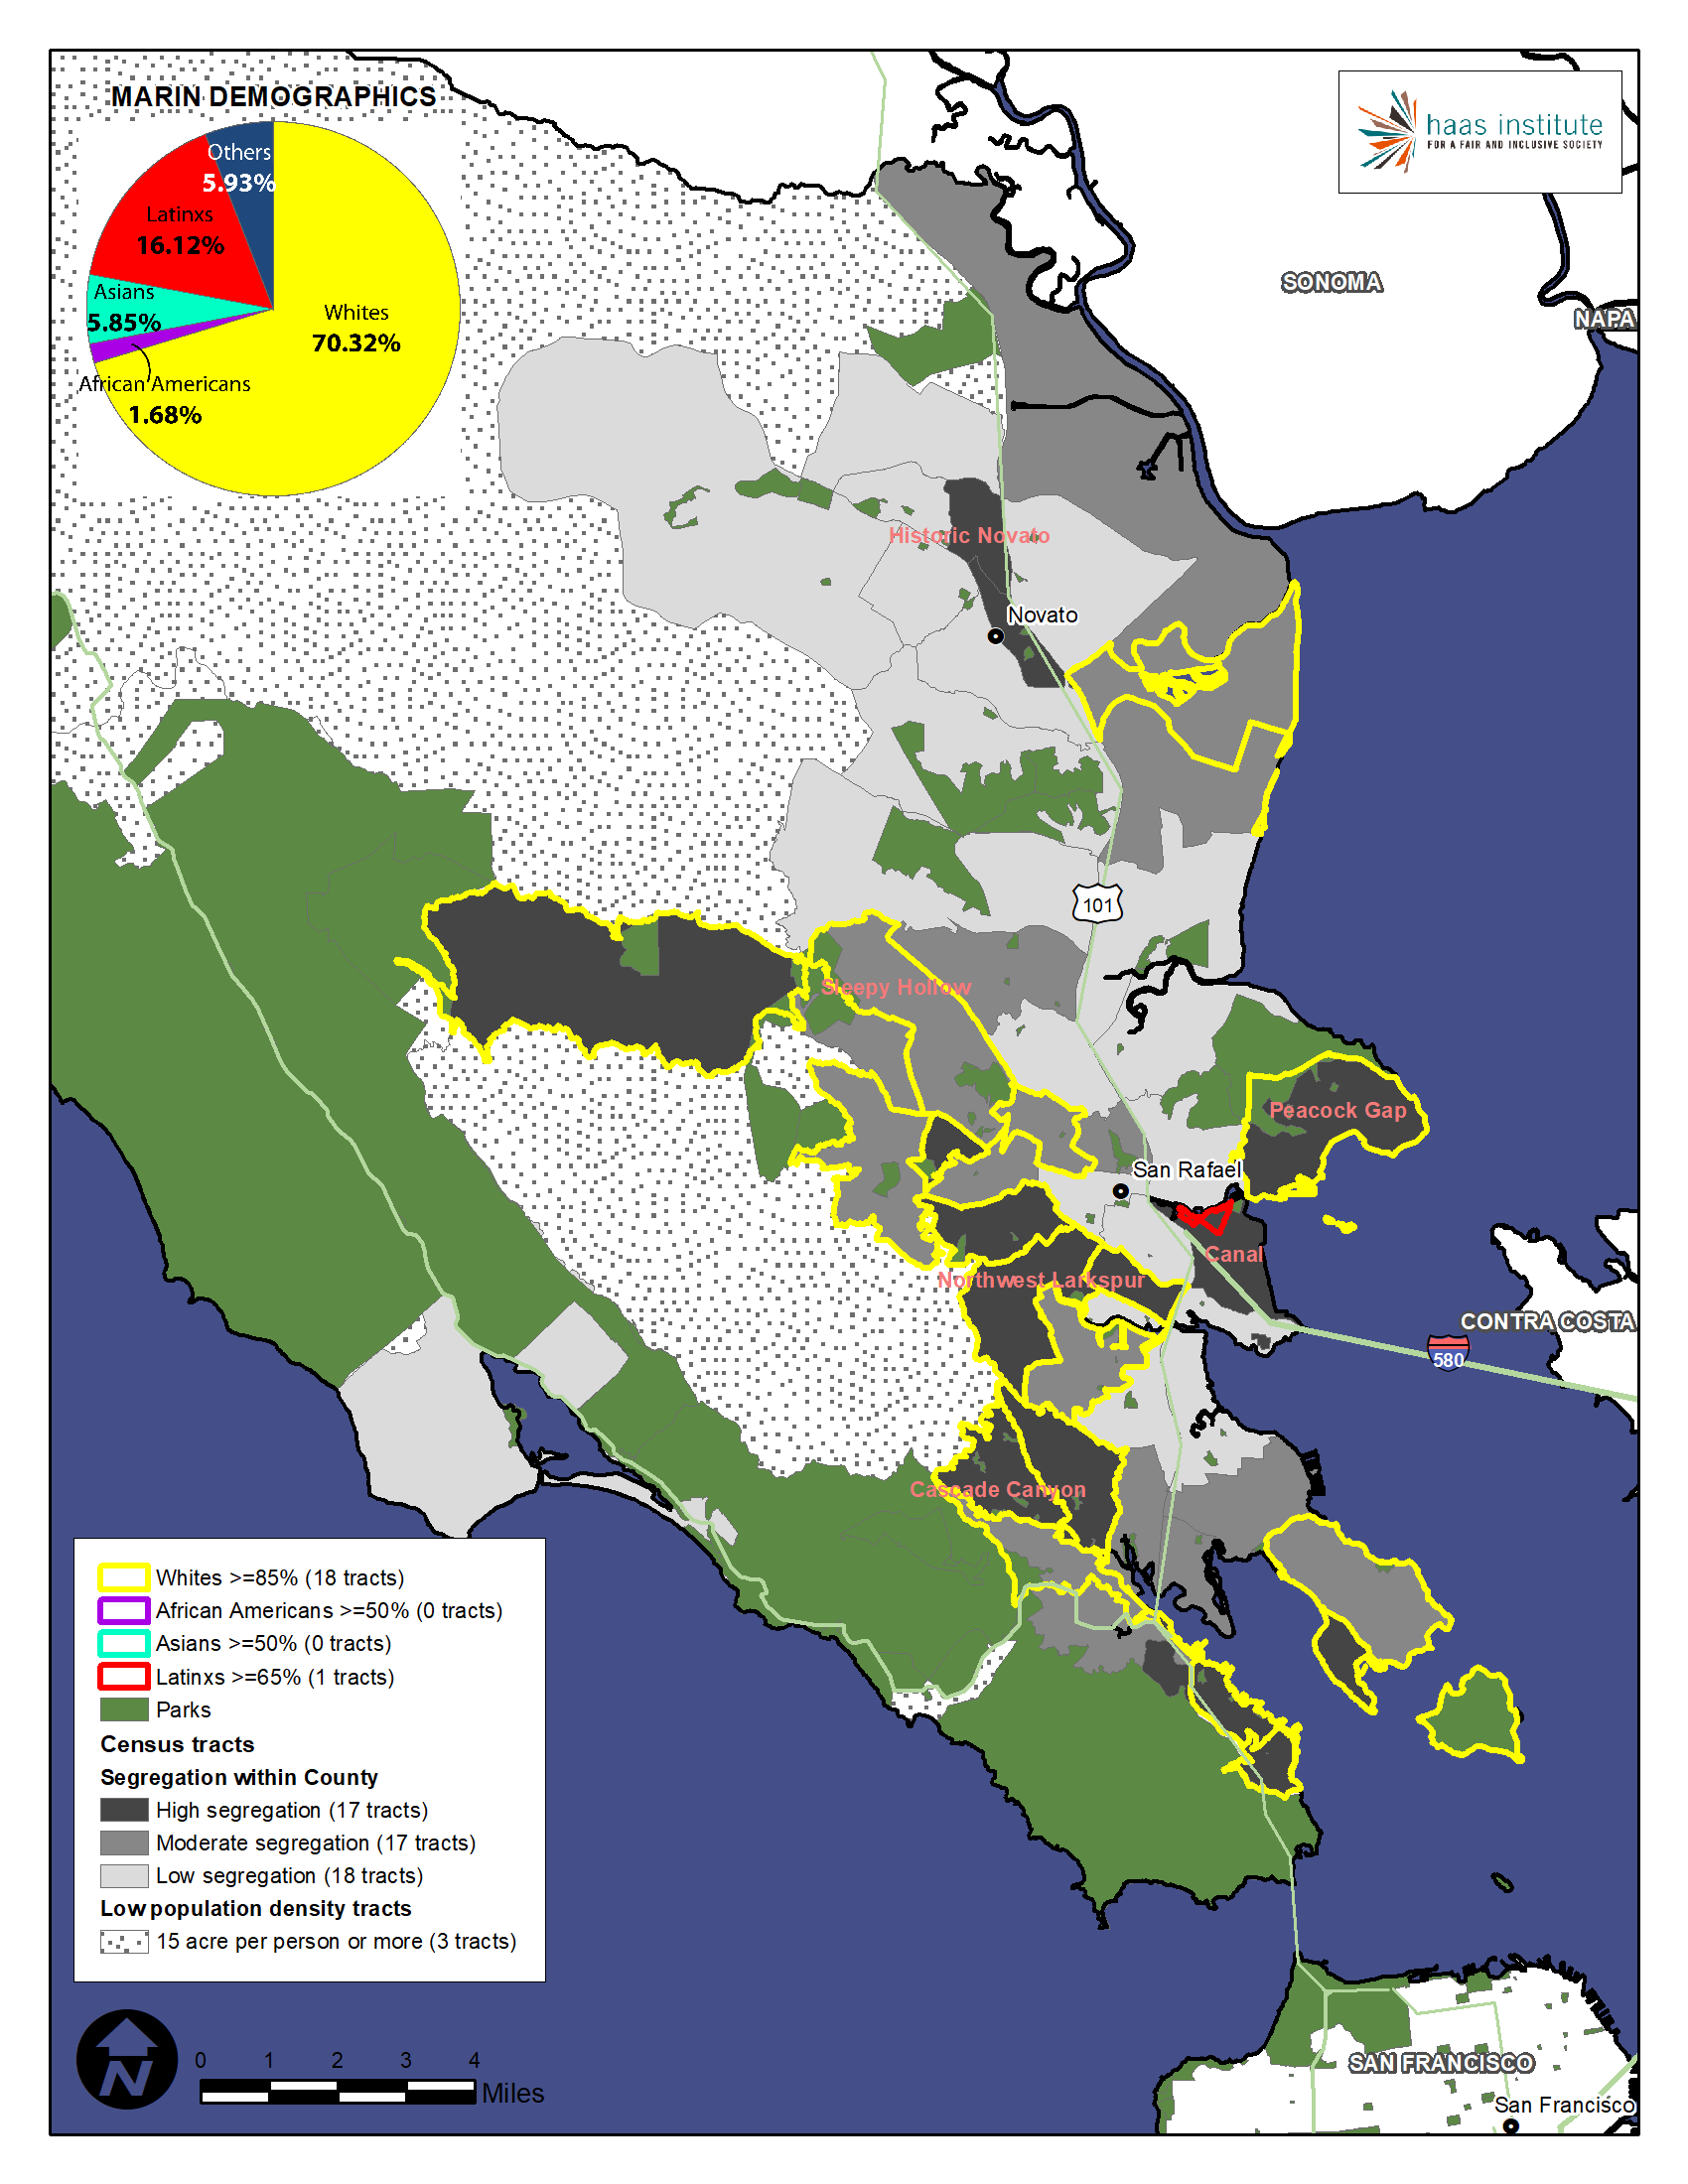
Marin County is one of the most scenic counties in the Bay Area, featuring miles of shoreline, parks, and other pastoral views. Despite its reputation as a bastion of progressivism and environmentalism, it is one of the most segregated counties in the Bay Area, especially for whites. In fact, it might be fair to say that the entire county is segregated. The large number of whites may mask this. Sixty percent of its tracts have a similar proportion of white people to the county's population. On the other hand, for Latinos, Asian, and Black people, those percentages are 15 percent, 29 percent, and 7 percent, respectively.
Although Sonoma is the ‘whitest’ county in the Bay Area, five of the 10 most segregated census tracts in the entire Bay Area for whites are located in Marin County as is visible above. A small number of clustered public housing or affordable housing communities are home to many of the people of color in the county. Anti-development policies strictly regulate where new or affordable housing can be built, helping maintain patterns of racial segregation. As we will see in the next brief in this series, however, many people of color have left or been displaced from Marin county in recent decades.
A neighborhood in San Rafael, as highlighted in the map, is the most segregated tract for Latinos in the entire Bay Area, where more than 90 percent of population is of this group. Novato also contains a substantial number of Latinos, with a 19 percent Latino population.
Sonoma County
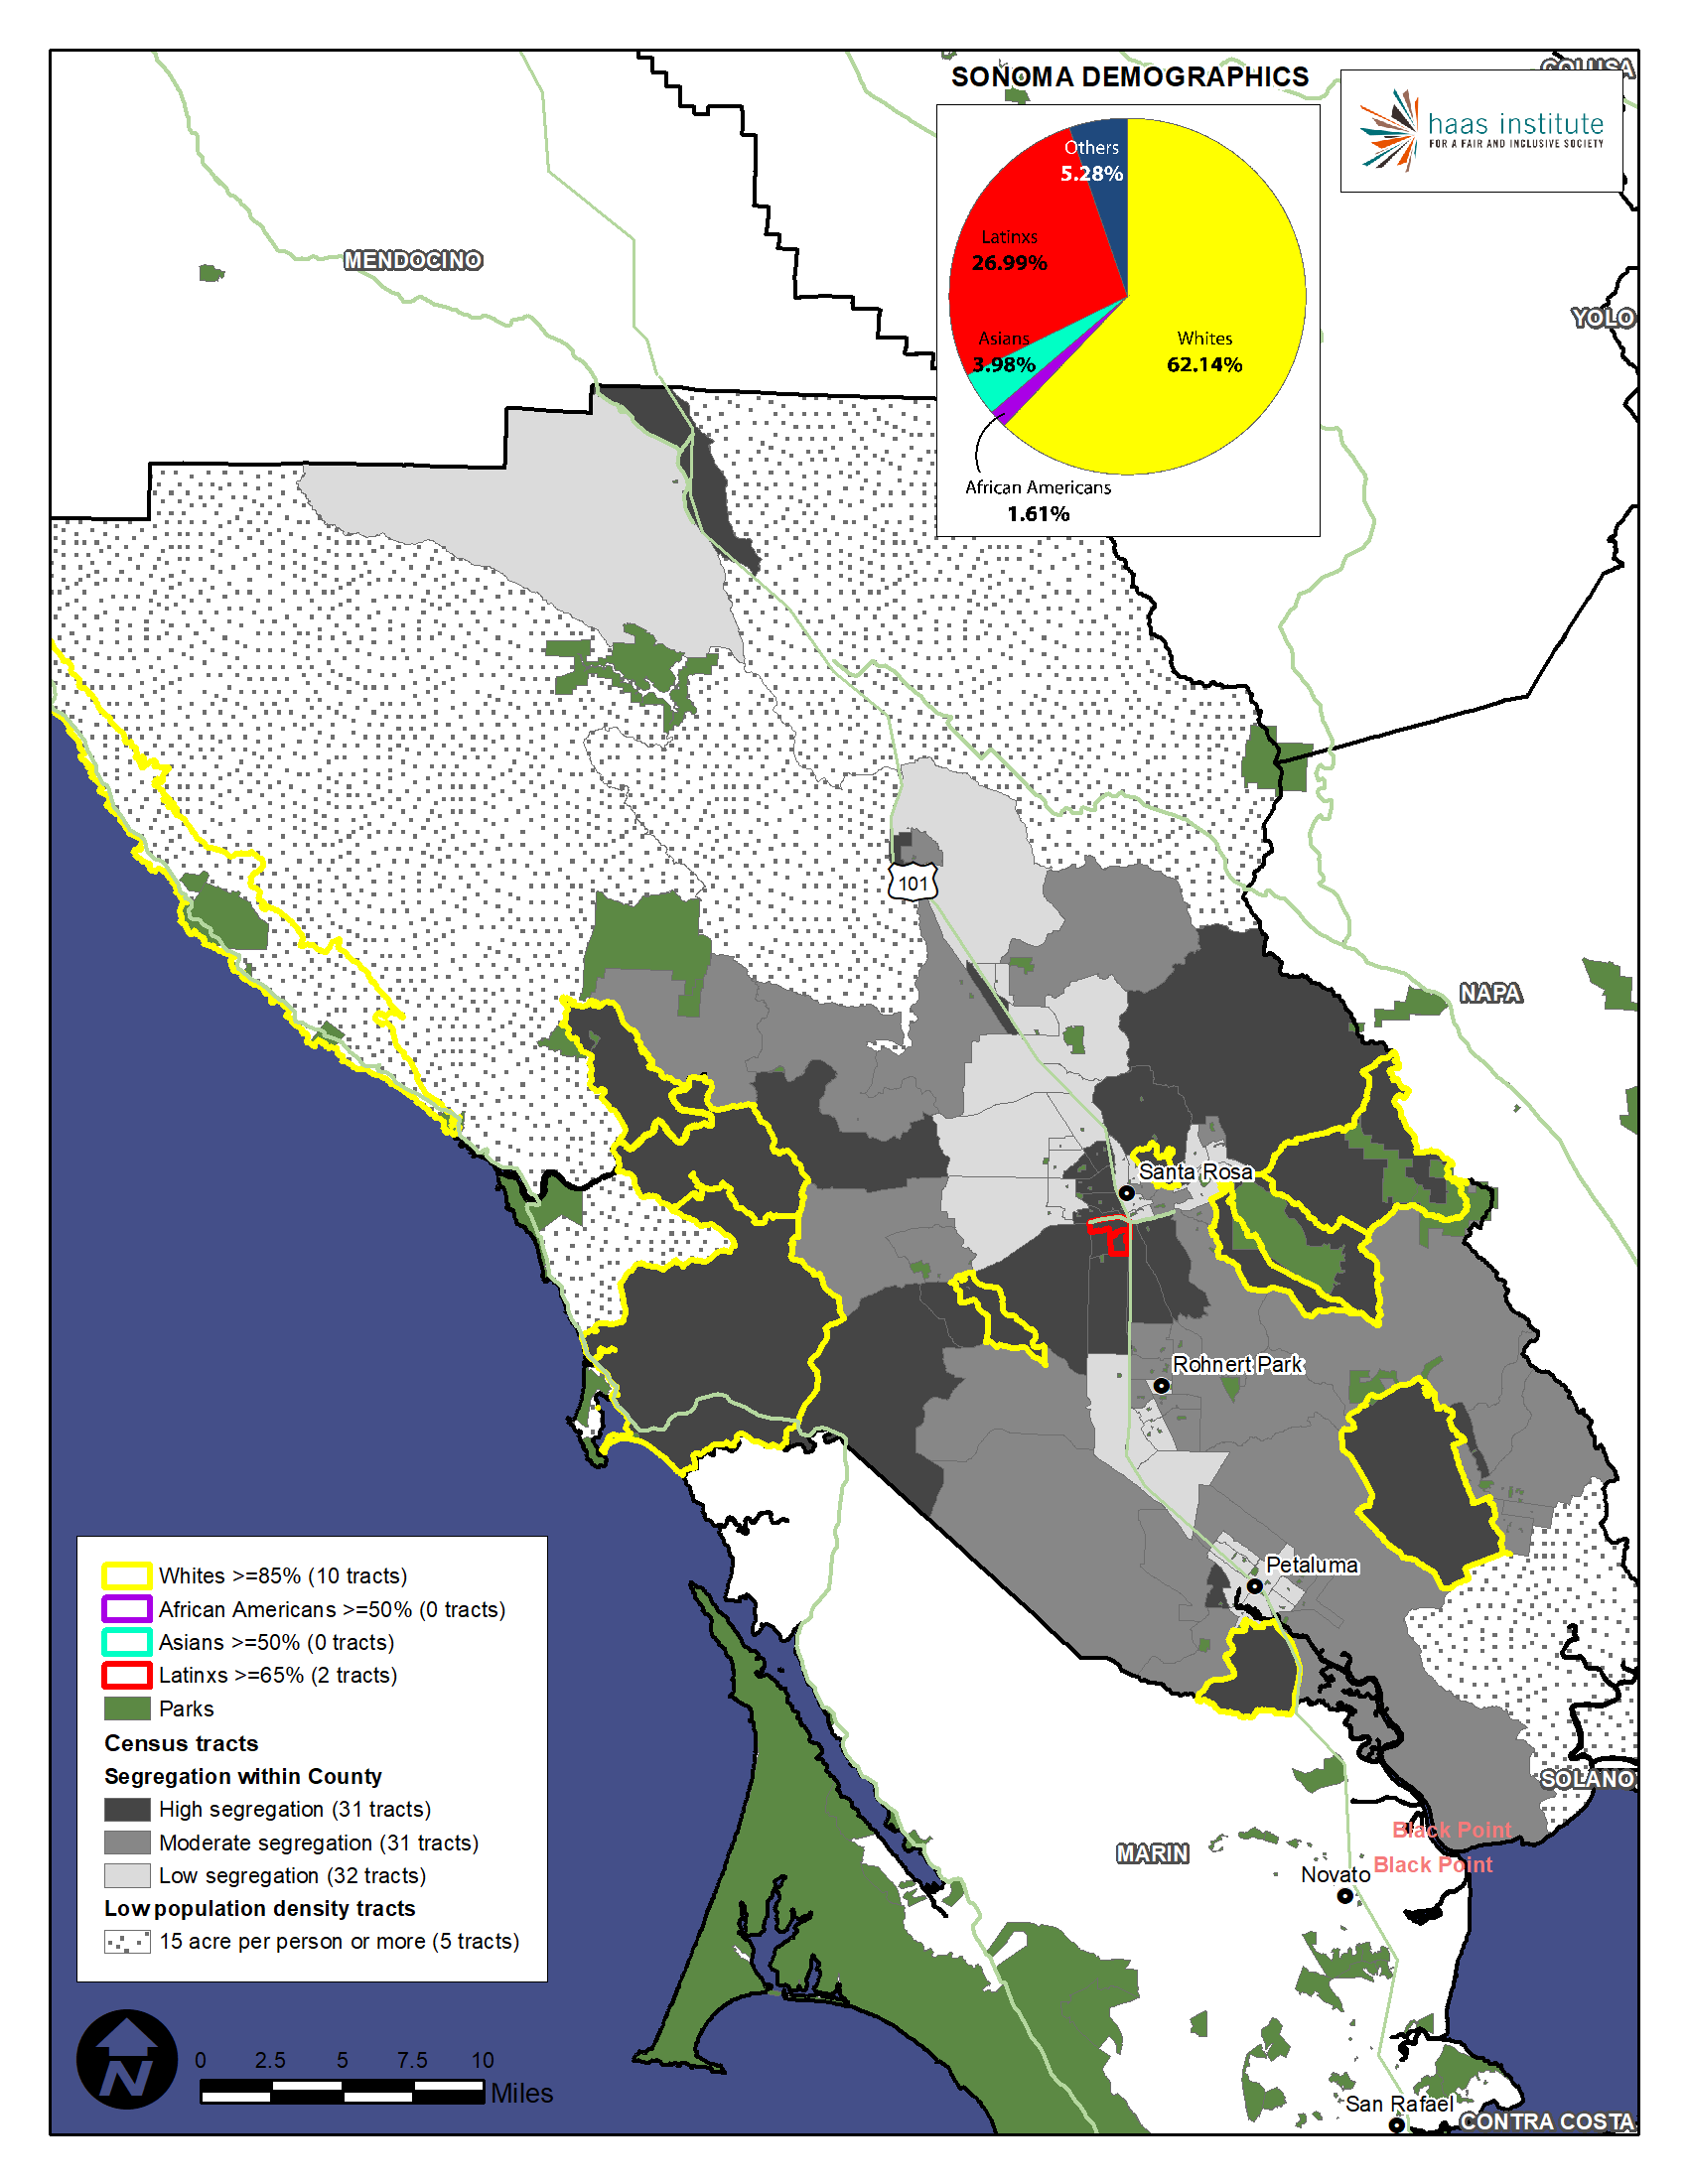
A viticultural and agricultural hub, and the largest wine producer in California, Sonoma County is another scenic part of the Bay Area. Despite its rural character, Sonoma’s diversity - which is greater than Marin’s -- is not reflected in its neighborhoods. Fifty-one percent of its tracts have a similar proportion of white people to the county's population. For Latinos, Asian, and Black people, those percentages are 23 percent, 26 percent, and 13 percent, respectively.
In many respects, Sonoma is a counterpart to Marin in that it is a place where white families are exceptionally segregated from people of color. Three of the six whitest segregated neighborhoods in the Bay Area are found in Sonoma, neighborhoods in or around Santa Rosa.
Although Sonoma is 62 percent white, just 2 of the 9 incorporated cities in Sonoma have more than an 80 percent white population: Sebastopol and Sonoma City, and are therefore the most segregated cities for whites. On the flip side, just two cities have less than a 60 percent white population, Santa Rosa and Cloverdale.
The largest minority group in Sonoma are Latinos, which are overrepresented and clustered in Cloverdale, Healdsburg, Santa Rosa, and Windsor town.
Petaluma and Rohnert Park are the most integrated cities in the county.
Napa County
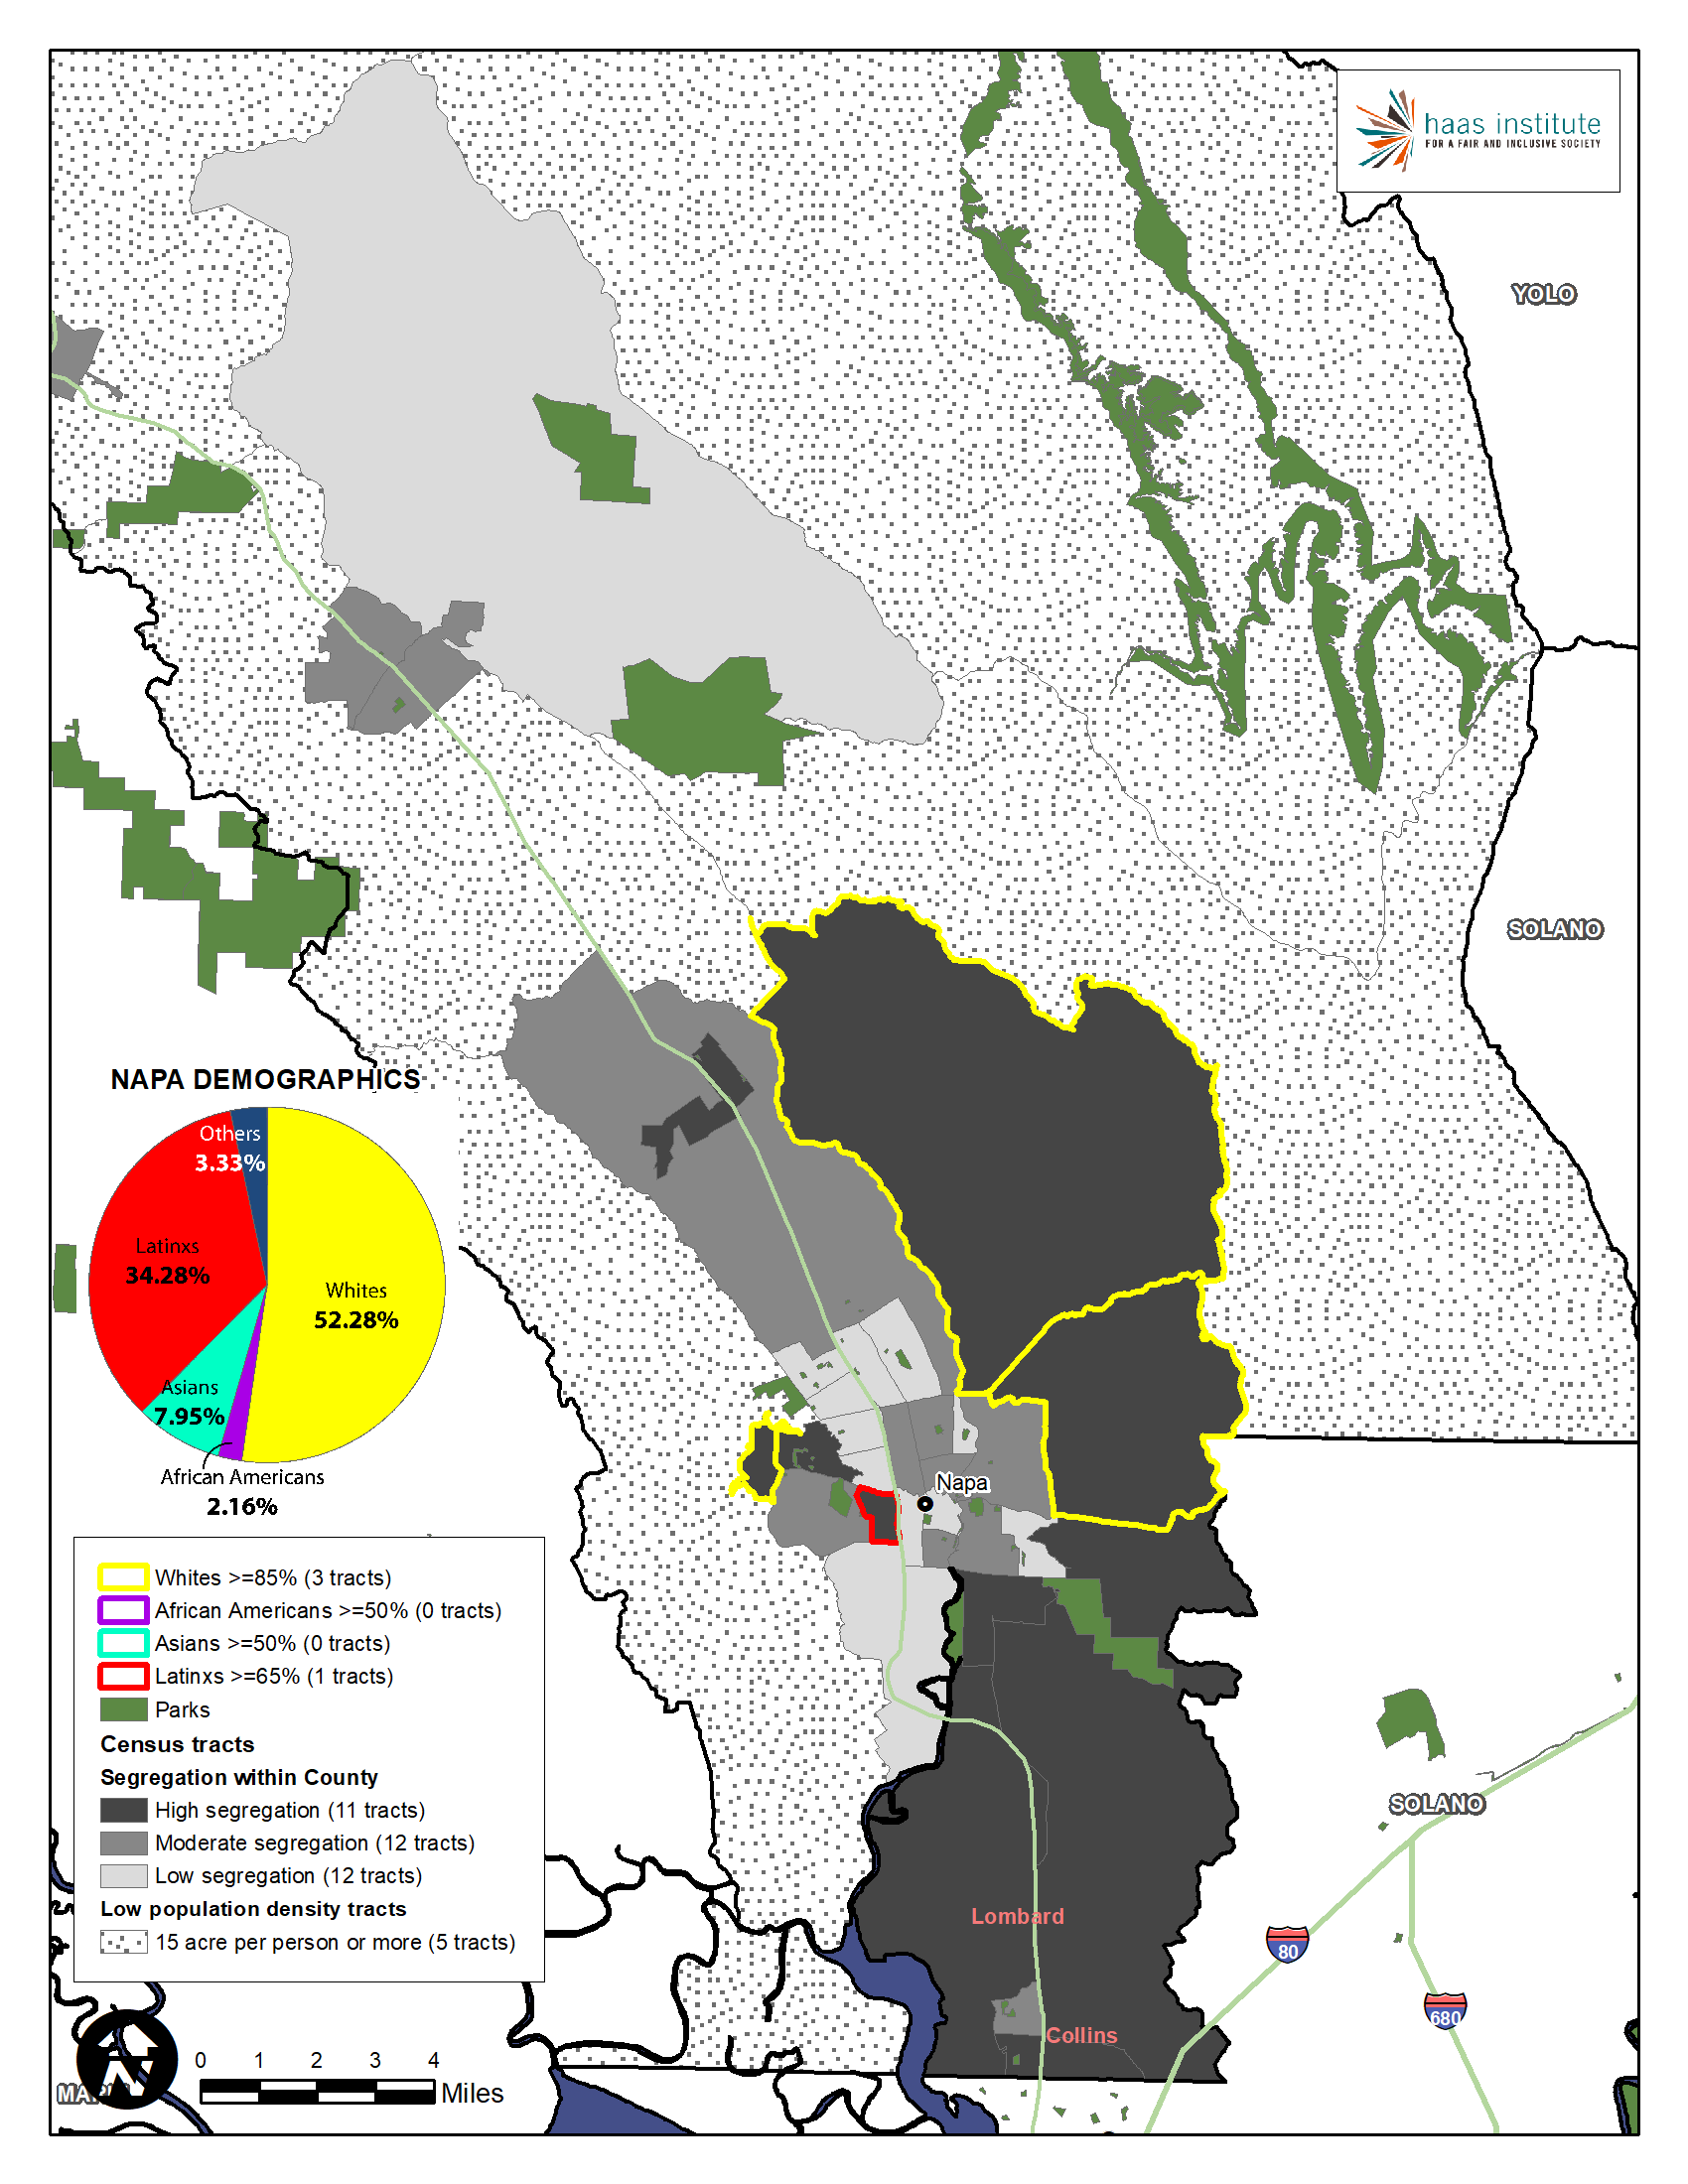
With 400 wineries, Napa County is most famous as a wine growing region along with its neighbor, Sonoma County. Both counties have similar demographics featuring a majority white population. Despite the large white population, just 40 percent of its tracts have a similar proportion of white people to the county's population. For Latinos, Asian, and Black people, those percentages are 23 percent, 10 percent, and 5 percent, respectively.
There are communities in Napa County that are predominantly non-white. American Canyon city is predominantly Asian, whereas Calistoga is predominantly Latino.
Yountville is the most segregated, heavily white city in Napa County. St. Helena is moderately segregated, by comparison.
Notably, Napa city is the most integrated city in the county with a population that is 55 percent white, 39 percent Latino, 3 percent Asian, and less than 1 percent black.
Solano County
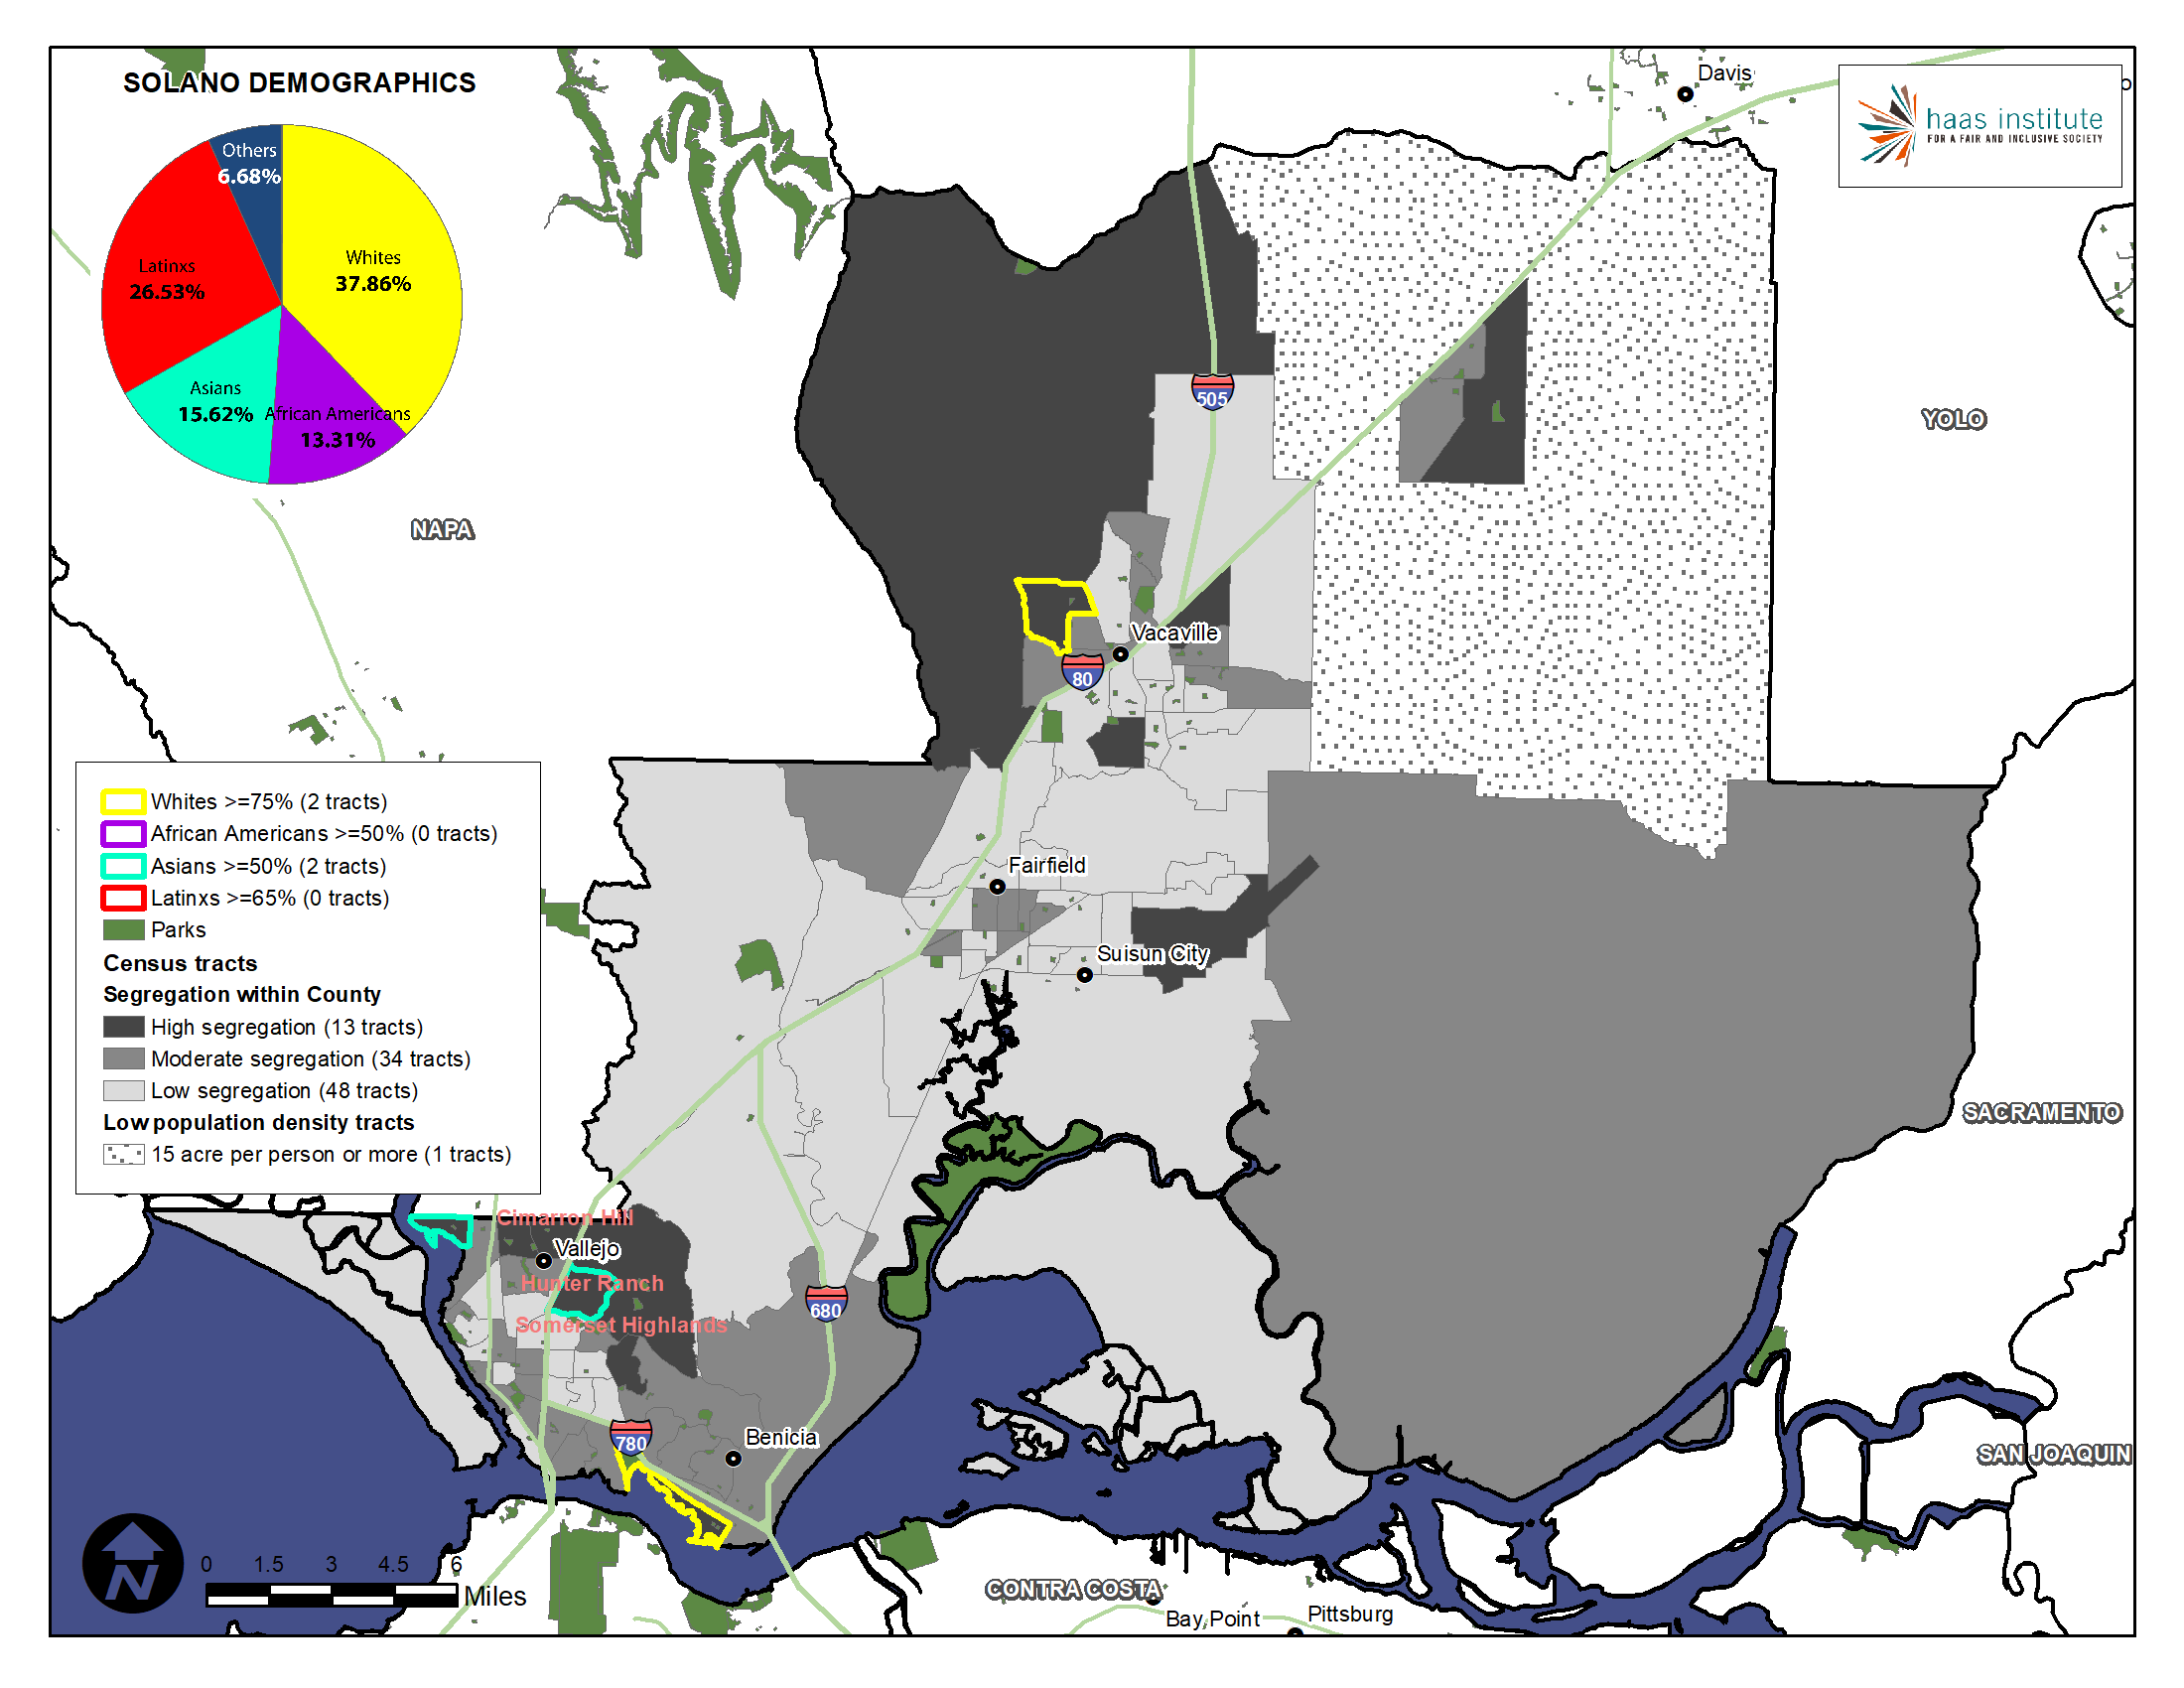
One of the oldest counties in the state, Solano County is much more diverse than its neighbor, Napa. It may also be the most integrated county in the Bay Area. Although still a low number, a higher than average number of census tracts have a similar proportion to the racial composition of the county as a whole. Twenty-seven percent of its tracts have a similar proportion of white people to the county's population. For Latinos, Asian, and Black people, those percentages are 31 percent, 17 percent, and 23 percent, respectively, the highest numbers we’ve seen for Latinos and Blacks. This also suggests the unusual fact that Asians may be the most racially concentrated group in the county.
Solano has the lowest percentage of highly segregated census tracts of any county in the Bay Area. Exemplifying this pattern, both Suisun City is highly diverse and integrated, with nearly perfectly even breakdowns of each racial group. Fairfield and Vacaville are a mixture of integrated and only moderately segregated.
Solano also has a sizable and historic black community. Cities like Vallejo, however, are diverse, but not as well integrated. Its population is 24 percent white, 19 percent black, 23 percent Asian, and 28 percent Latino, illustrating another textbook example of how an unquestionably diverse community can nonetheless be segregated.
Rio Vista and Benicia are the two most segregated, and heavily white cities of Solano County.
Segregation in the Metropolitan Areas
Several major metropolitan regions cut across counties in the Bay Area. Therefore, another useful perspective on racial segregation is to see the segregation that exists within the region’s major metropolitan regions. The San Jose MSA is the most integrated metropolitan region, and is substantially more integrated than the Oakland of SF MSA.
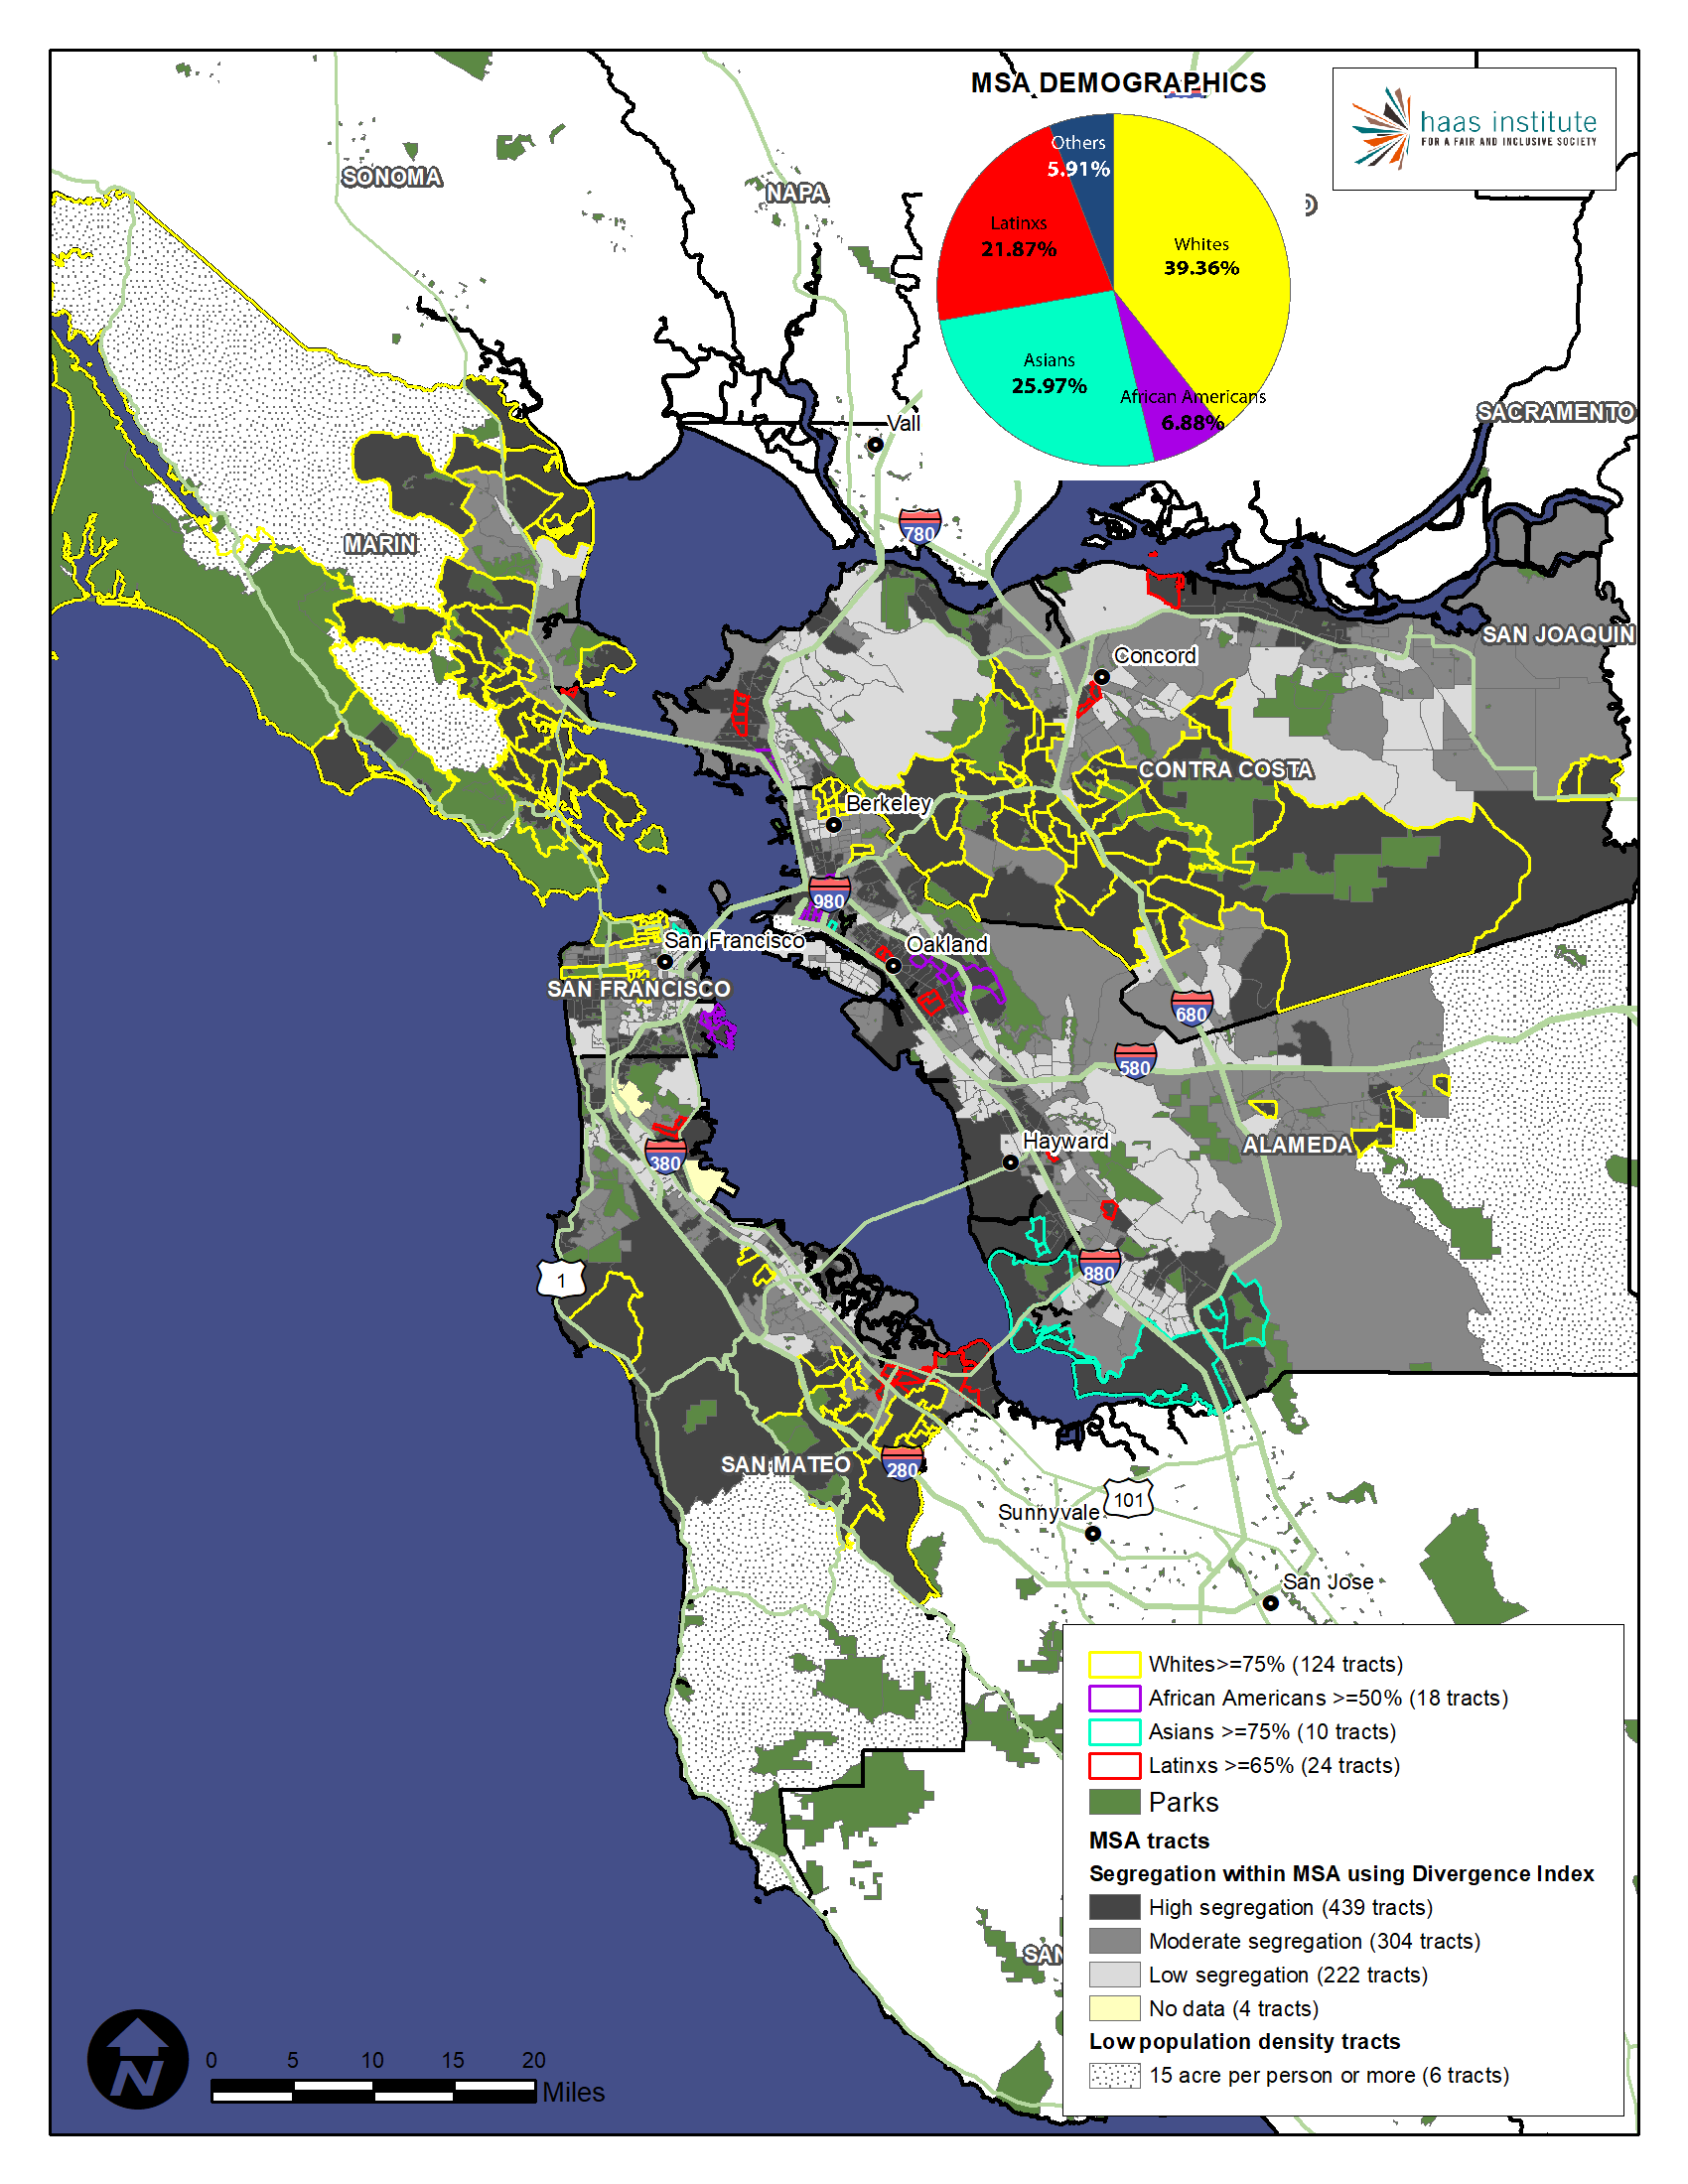
San Francisco–Oakland–Hayward MSA
Demographics of this MSA are marginally different from the Bay area as a region. However, segregation is as pronounced in this four county MSA as it was in the Bay area. Considering that whites are the most segregated racial group in the region, there are 124 tracts in this MSA that have non-Hispanic whites more than 75 percent. As discussed earlier, Marin County is predominantly white, so it is no surprise that the top ten tracts with high segregation due to non-Hispanic whites are in Marin County. The 18 tracts that have 50 percent or more of African Americans are the same as those in the Bay area. Thus segregated areas for blacks are mainly concentrated in this MSA region. Six out of 10 of these highly segregated tracts are in Alameda County, three in San Francisco and one in Contra Costa County.
As shown on the map, there are 8 tracts that have 75 percent or more of Latinos. Four of these are in Contra Costa County, out of which three are in the city of Richmond. Three of those 8 tracts are in the city of Redwood City in San Mateo County. The remaining one tract is in Marin County in the city of San Rafael. Mentioned earlier, 90 percent of this tract’s residents are Latino.
Six out of the top 10 segregated tracts with 75 percent or more of Asians are in Alameda County, five primarily in Fremont and Union cities, and one in the city of Oakland. Three are in San Francisco.
San Jose–Sunnyvale–Santa Clara MSA
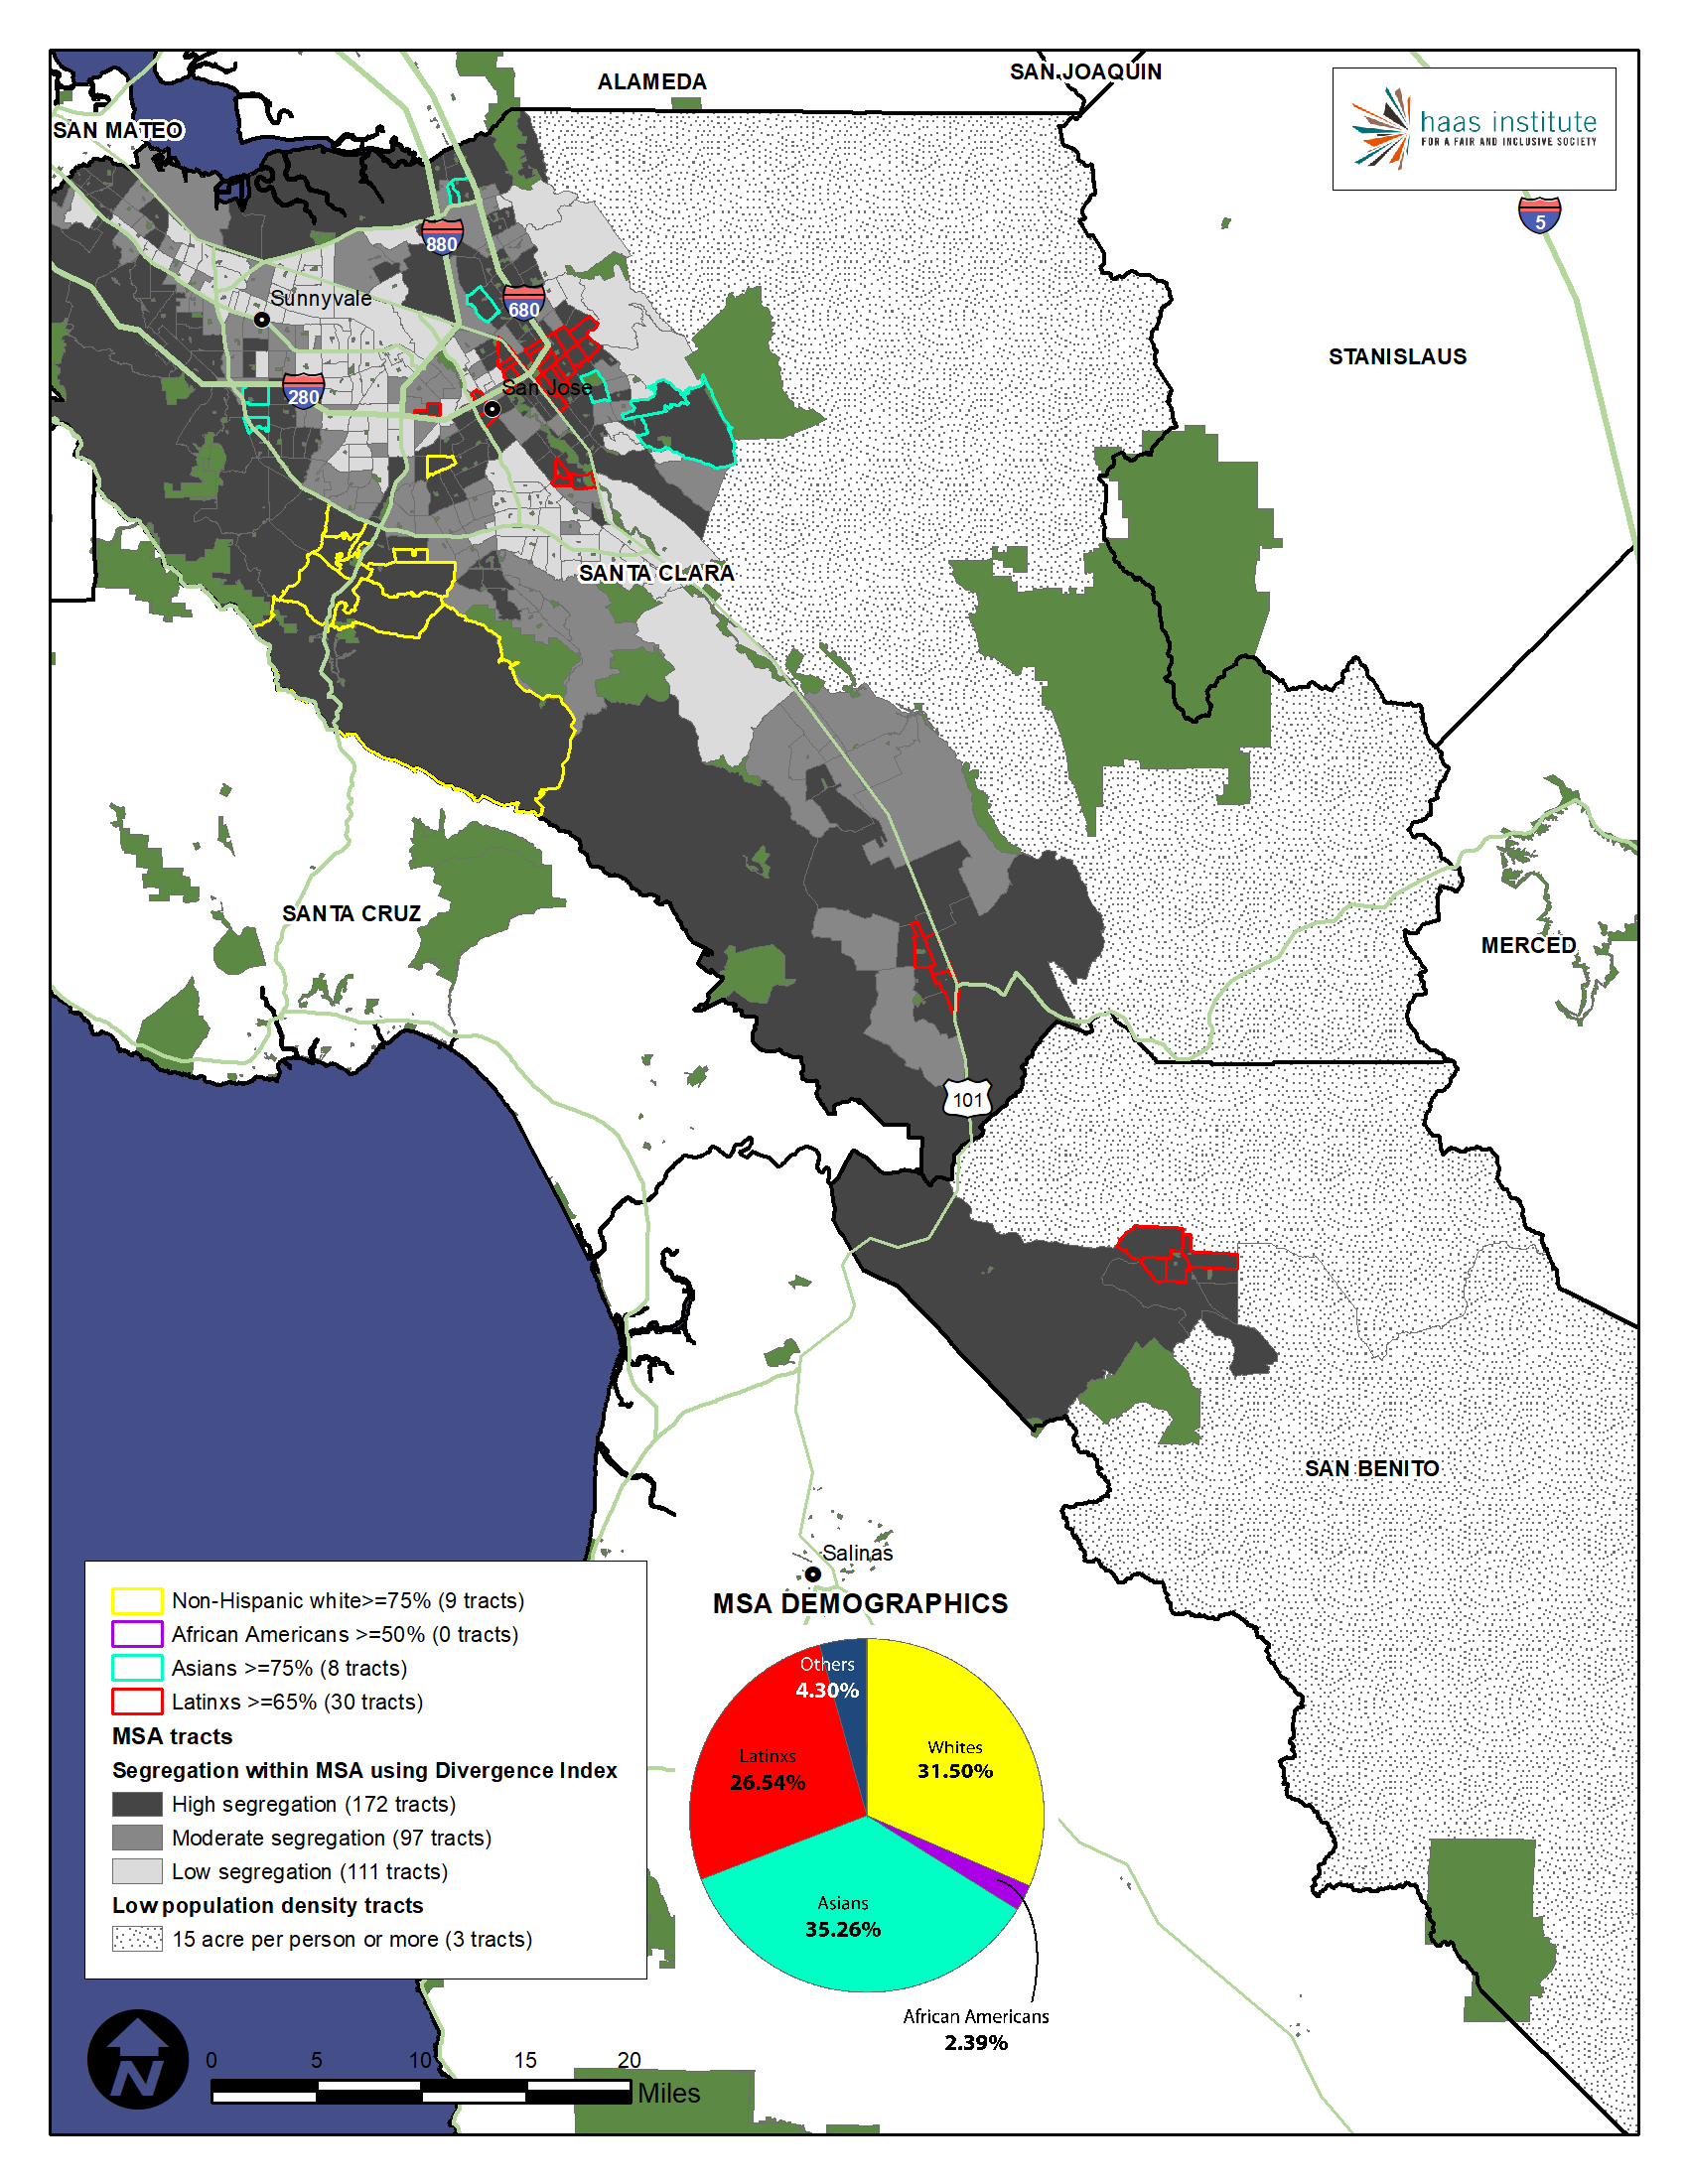
This MSA seems to be the most diverse based on the demographic data as shown above. However, the map above illustrates how segregated are some of its neighborhoods are with clearly demarcated areas of racial concentration. Eight of 9 tracts with white population 75 percent or above are in the town of Los Gatos and beyond, while one is in the city of San Jose. According to our metric, there doesn’t seem to be any segregated neighborhoods with African Americans in this MSA.
On the other hand, 4 out of 8 tracts with 75 percent or more of Asians are in San Jose. Of the remaining 4, 2 are in Milpitas and 2 in Cupertino. High tech industry in Silicon Valley is the main source of employment of IT professionals from Asian countries such as India and China, and thus it is not surprising to find neighborhoods with such high concentration of Asians.
Latinos have the highest number of segregated neighborhoods in this MSA. Ten out of 15 such neighborhoods are in San Jose, two in Gilroy, and the remaining three in and around the city of Hollister in San Benito County.
Conclusion
Whether seen from the regional perspective, the county level or the metropolitan level, the San Francisco Bay Area is simultaneously diverse but also notably and starkly segregated. The diversity of the region masks considerable levels of racial isolation and historical, persistent segregation. The measure of segregation we have employed here, the Divergence Index, helps us identify areas that are segregated despite a high degree of overall diversity. It also helps us see which communities are particularly segregated as a way of beginning to understand the problem we must confront and address.
More than half a century after the enactment national Fair Housing Act and nearly six decades since California’s Fair Employment and Housing Act, the state remains racially segregated, with the Bay Area as a vivid case study. These segregated residential patterns shape the life chances of its residents, who not only reside in racially segregated neighborhoods, but attend racially segregated schools and have racially differentiated access to a plethora of public and private resources as well. Racial segregation, as we will show in more detail in part three, shapes life chances and is the main instrument of racial inequality.
Our next brief in this series will examine current and historical patterns of racial demographics which underlay these segregation maps. These maps will suggest how these communities became segregated by showing how racial change occurred in the Bay Area.
We anticipate that our briefs will generate a range of responses, including questions about how we define or conceptualize racial segregation. These briefs are presented in sequence so that we might also collect feedback and incorporate suggestions before compiling the briefs into a final report, so please send us your questions or ideas to HousingOBI@berkeley.edu.
- *The authors would like to acknowledge Phuong Tseng and Arthur Gailes for their assistance in the development of this brief, and the following people for their feedback and insights: Eli Moore, Nicole Montojo, Richard Rothstein, Na’ilah Nassir, Craig Gurian, Sheryl Cashin, and Eva Paterson.
- 1By “San Francisco Bay Area” or “Bay Area Region” we refer to the 9-county region, including Alameda, Contra Costa, Marin, Napa, San Francisco, San Mateo, Santa Clara, Solano, and Sonoma counties.
- 2United States Census Bureau, 2017 American Community Survey 1-year estimates, U.S. Census Bureau’s American Community Survey Office, 2017. Our use of the word "other" here to capture other ethno-racial groups does not denote a group that is "othered" as a result of the othering process. See john powell and Stephen Menendian, "The Problem of Othering: Towards Inclusiveness and Belonging," Othering and Belonging, v. 1, pp. 14-39 (2016), available online at http://www.otheringandbelonging.org/the-problem-of-othering/.
- 3Although the US Census classifies Asian, African-American/Black, and white/Caucasian as racial categories and Hispanic as an ethnic category, we refer to Latino/a as a racial category that generally encompasses groups that the census counts as “Hispanic, non-white,” and classify “non-Hispanic whites” as simply white, and so on. We recognize that racial and ethnic categories are contested and politically fraught, but adopt this taxonomy for ease of analysis and simplicity in discussion. We further recognize the gendered nature of Latino, but, we use “Latino” in a gender neutral manner. Native Americans in the Bay Area are a very small percentage of population, but are counted as "other" in our racial taxonomy and Divergence Index score calculations (see the spreadsheet linked in endnote 11).
- 4“Racial segregation” is a contested term, and a subtle concept. It is sometimes, inaccurately, conflated with racial “concentration.” Douglas S. Massey and Nancy A. Denton, “The Dimensions of Residential Segregation,” Social Forces 67, no. 2 (1988): 281-315. We will grapple with the precise meaning of this term and discuss the various measures in Part III of this series.
- 5PolicyLink and USC Program for Environmental & Regional Equity (PERE), “An Equity Profile of the Nine-County San Francisco Bay Area Region,” The San Francisco Foundation, San Francisco, CA, 2017, http://nationalequityatlas.org/sites/default/files/Final_9_County_BayAreaProfile.pdf Tony Roshan Samara, “Race, Inequality, and the Resegregation of the Bay Area,” Urban Habitat, Oakland, CA, November 2016, http://urbanhabitat.org/sites/default/files/UH%20Policy%20Brief2016.pdf. Neither report actually has segregation maps per se.
- 6See e.g. Trounstine, J. (2018). Segregation by Design: Local Politics and Inequality in American Cities. Cambridge: Cambridge University Press. doi:10.1017/9781108555722 Figure 1.3 "Segregation in Camden and Cherry Hill, 1970”
- 7Eli Moore, Samir Gambhir, and Phuong Tseng, “Belonging and Community Health in Richmond: An Analysis of Changing Demographics and Housing,” Haas Institute for a Fair and Inclusive Society, University of California, Berkeley, CA, February 2015, https://belonging.berkeley.edu/sites/default/files/HaasInstituteReport_Belonging%20%26%20Community%20Health%20in%20Richmond.pdf. See Maps 2 and 3.
- 8There are many different forms of segregation. For purposes of this series, we use the term “racial segregation” to refer to residential segregation, meaning patterns of residential housing and settlement, rather than segregated educational facilities, recreational programs, or other forms of segregation.
- 9We can, however, provide citations here. Rucker C. Johnson, “Long-run Impacts of School Desegregation & School Quality on Adult Attainments,” NBER Working Paper No. 16664, September 2015, http://www.nber.org/papers/w16664; Dolores Acevedo-Garcia, Theresa L. Osypuk, Nancy McArdle, and David R. Williams, “Toward A Policy-Relevant Analysis Of Geographic And Racial/Ethnic Disparities In Child Health,” Health Affairs 27, no. 2 (2008): 321-333; Theresa L. Osypuk and Dolores Acevedo-Garcia, “Beyond Individual Neighborhoods: A Geography of Opportunity Perspective for Understanding Racial/Ethnic Health Disparities,” Health Place 16, no. 6 (2010): 1113-1123; and Robin Pearce, “The Sick Side of Town: How Place Shapes Disparities in Health,” Haas Institute for a Fair and Inclusive Society, University of California, Berkeley, CA, September 2018, https://belonging.berkeley.edu/healthdisparitiespolicybrief.
- 10The two MSAs are SF-Oakland-Hayward and San Jose-Sunnyvale-Santa Clara.
- 11Our segregation index is calculated using decennial census data as it provides a far more reliable data point. However, in our discussion of the racial demographics of particular cities, we will use 2017 ACS estimates, which are much smaller samples with larger margins of error. We recognize that the 2010 census is dated, especially given the rapid demographic shifts occurring in the Bay Area. Therefore we will use ACS estimates where possible and where the margins of error can be appropriately managed.
- 12This Divergence Index was created in 2015 by Elizabeth Roberto. For a primer on this Index and how it is calculated, see Elizabeth Roberto, “The Divergence Index: A Decomposable Measure of Segregation and Inequality,” Working Paper, December 2016, https://arxiv.org/abs/1508.01167. With this report, we are also launching our segregation calculations, which can be accessed at https://belonging.berkeley.edu/sites/default/files/bay_area_divergence_index_data.xlsx. We hope that by providing these calculations, we will facilitate a wide range of possible research applications using them.
- 13Census tracts are the smallest geographic unit measured, as they are the smallest unit possible for reliable data. Census tract boundaries are defined by the Census Bureau, and contain roughly between 2,500 and 8,000 persons. We use the term “neighborhood” and “census tract” interchangeably, despite the imprecision with the former.
- 14For that reason, the regional map above is a composite of the individual county maps presented herein. We must note, however, that the divergence index classification methodology used for census tracts in the 3 rural counties of Marin, Napa and Sonoma differs from the calculation used for the other 6 counties. For the 3 rural counties, the segregation classification is calculated by tertiles. In other words, the index scores for each tract are sorted from low to high, and then divided into three equal segments containing the same number of census tracts. For the other 6 counties, which are more urban and diverse, the thresholds between ‘low’ and ‘moderate,’ and ‘moderate’ and ‘high’ are delineated by a particular divergence index value threshold that we have determined. The threshold value for census tracts in those 6 counties designated as “highly segregated” is a divergence index score equal to or greater than 0.215. The threshold value for census tracts designated “low segregation” is 0.1075. Tracts designated as “moderately segregated” fall in between those values. For those 6 counties, the score thresholds result in an unequal number of census tracts in each category, an outcome we anticipated but we believe best reflects the underlying reality.
- 15Counties or MSAs were the only alternatives to using the region as a whole as the larger geographic context. Since not every census tract falls within an MSA, the only logical alternative for which consistent data was available was counties.
- 16For the three rural counties noted in endnote 13, this conclusion may seem tautological: one-third of tracts are classified as ‘high segregation’ by default. Yet, our conclusion that segregated neighborhoods exist in every county is not based entirely on this indexing method or divergence index scores, but based upon a more granular assessment of the neighborhoods we examined, as will be described in more detail herein.
- 17For a good overview of these changes, see the summary and three county reports for San Francisco, Alameda, and Contra Costa counties produced by the California Housing Partnership and Urban Displacement Project, at http://www.urbandisplacement.org/research#section-132 (Accessed October 24, 2018); and Samara, “Race, Inequality, and the Resegregation of the Bay Area.”
- 18Eleanor Barkhorn, “Why Are American Schools Still Segregated?,” CityLab, November 5, 2013, https://www.citylab.com/equity/2013/11/why-are-american-schools-still-segregated/7478/; and Laura Bliss, “Where School District Borders are Invisible Fences,” CityLab, August 23, 2016, https://www.citylab.com/equity/2016/08/school-district-borders-segregation-edbuild/496913/.
- 19As we will describe in Part 3, other measures of segregation reinforce this finding. For example, exposure index values have long shown that whites are the most segregated racial group.
- 20Again, as we will see in Part 3.
- 21The heavy segregation of neighborhoods within Oakland’s municipal boundaries raises serious questions about the equity of the school district’s neighborhood school’s policy, which replicates residential segregation in school buildings. Oakland Unified School District, “Enrollment Placement Priorities,” Accessed October 24, 2018, https://www.ousd.org/Page/17066.
- 22Douglas Henry Daniels, “Berkeley Apartheid: Unfair Housing in a University Town,” History Research 3, no. 5 (2013): 321-341; see also Maya Tulip Lorey, “A History of Residential Segregation in Berkeley, California, 1878-1960,” The Concord Review 24, no. 2 (2014): 1-19.
- 23Contra Costa County, California, “Cities of Contra Costa,” Accessed October 24, 2018, http://www.co.contra-costa.ca.us/1243/Cities-of-Contra-Costa.
- 24We defined a tract as similar to the county for a given racial group if its absolute percentage difference is less than 20% (or 40% for black people, to control for generally lower levels of population in that group). For example, because San Francisco County is 41.2% white, a tract is classified as similar if its percentage of white people is between 33% and 49.4%.
- 25Rebecca Hendrick and Yu Shi, “Macro-Level Determinants of Local Government Interaction: How Metropolitan Regions in the United States Compare,” Urban Affairs Review 51, no. 3 (2015): 414-438.

