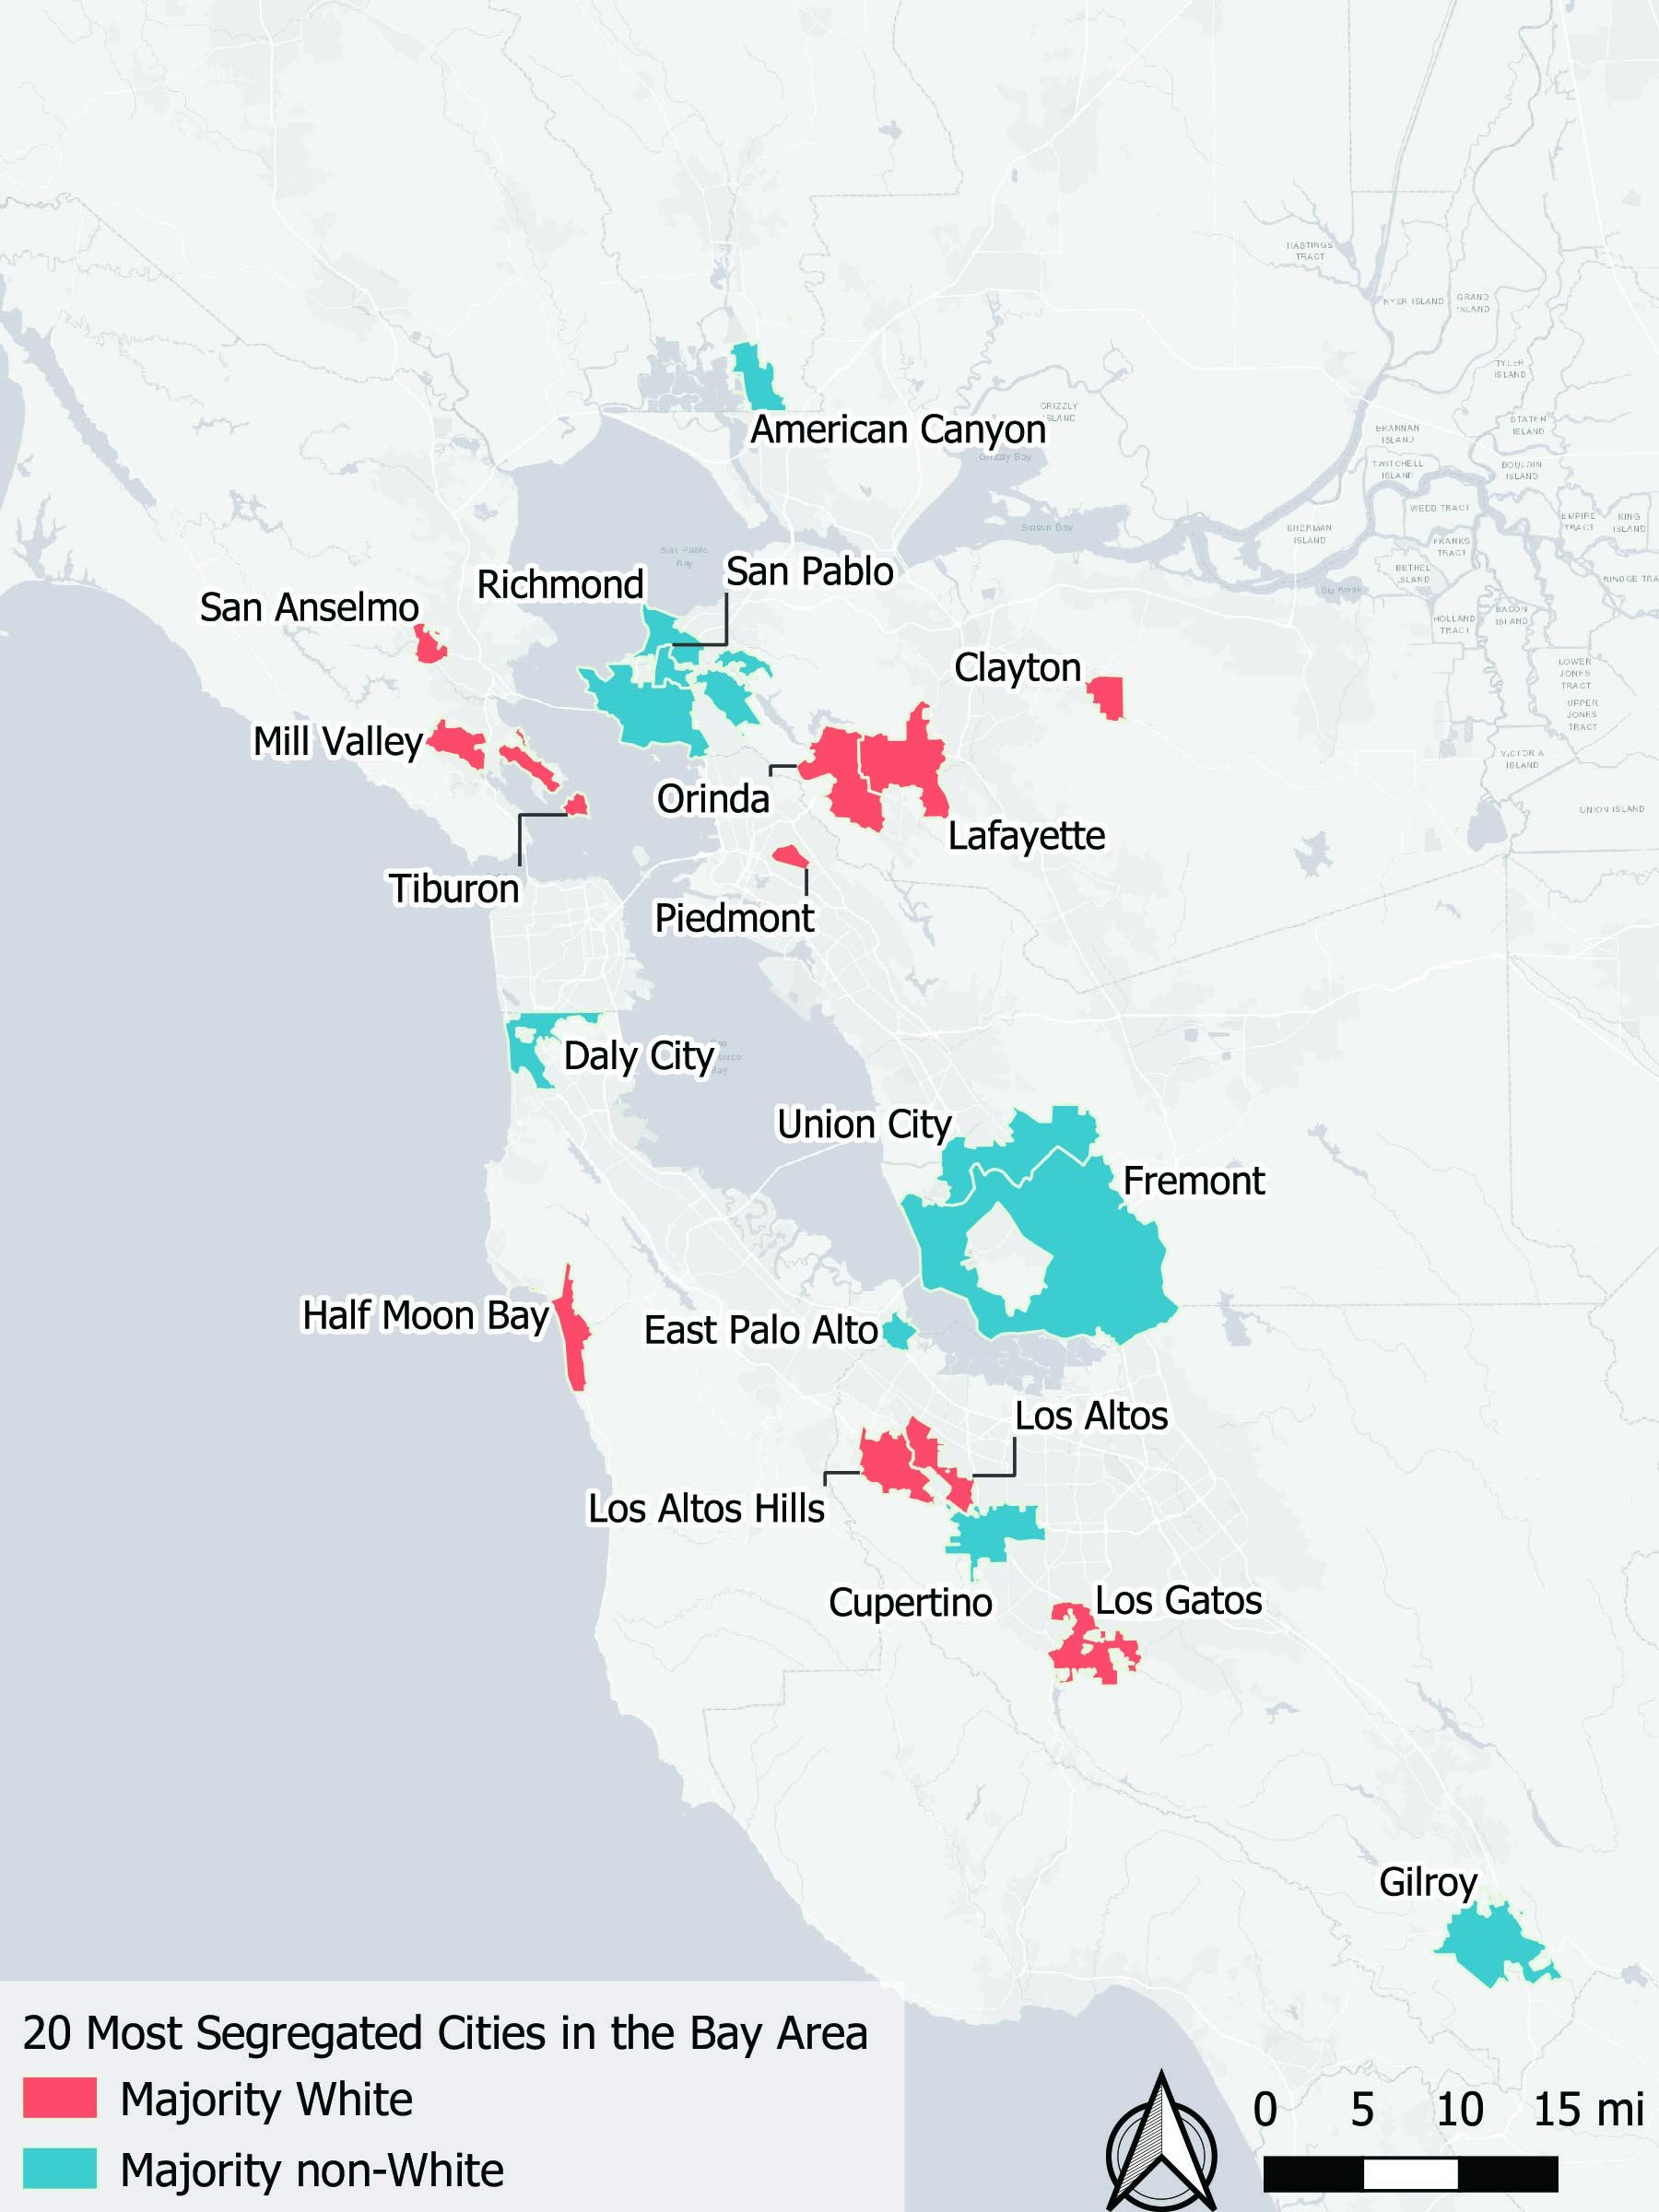
 BERKELEY, CA: Six of the 10 most segregated Black neighborhoods in the Bay Area, and half of the region's top 10 most segregated Latino neighborhoods, are located in Oakland, a new analysis from UC Berkeley's Othering & Belonging Institute (OBI) published Monday found.
The stunning finding comes despite Oakland being one of the most diverse and progressive cities in the country. It provides a case study of how a location can simultaneously be highly diverse yet extremely segregated.
"Although Oakland’s Black population declined significantly since 2010, it still remains one of the most diverse places in the Bay Area, if not the country. That said, racial residential segregation is stubbornly entrenched there, with profound consequences for people of color and their life chances.”
Using 2020 Census data released last month, the report is an update to OBI's ongoing research into regional and national segregation, which examines the impacts of racial residential segregation on a variety of life outcomes, including educational attainment, employment, and wealth.
Tracts and Neighborhoods
But for the first time, the new study provides segregation rankings down to the census tract level, within neighborhoods, for the four most common racial groups in the region: whites, Blacks, Latinos, and Asians. Previous reports on the Bay Area only ranked cities.
While Oakland was home to the highest number of highly-segregated Black and Latino neighborhoods, the most segregated of such census tracts in the region were located in San Francisco and San Rafael, respectively.
Two of the three most segregated Black neighborhoods are in San Francisco's Bay View/Hunter's Point region, while the most segregated Latino neighborhood is in San Rafael's Canal region, with the next four in Oakland.
And the most segregated Asian neighborhood is around San Francisco's Chinatown, with the next three in Fremont.
Like previous reports, this analysis uses a measure of segregation called the Divergence Index, which compares the racial makeup of a neighborhood, city, or region to its surroundings, offering a more accurate and holistic representation of segregation.
Three counties were more segregated in 2020 than they were in 2010: Marin, Napa and Sonoma, with Marin being the most segregated county in the region by far. Although 7 of the 9 Bay Area counties were more segregated in 2020 than they were in either 1980 or 1990, racial residential segregation in the region appears to have peaked around the year 2000, and has generally declined since.
Cities
There are two ways to rank cities by segregation, intra-municipal, and inter-municipal. Intra-municipal segregation compares the racial makeup of neighborhoods with a city's boundaries. Inter-municipal segregation compares the overall demographics of a city compared to other cities within the metro region.
This means that as a result of having the most segregated Black and Latino neighborhoods in the Bay Area, Oakland is unsurprisingly also the most segregated city on the intra-municipal segregation ranking.
On the intra-municipal segregation list, Oakland is followed by San Rafael, San Jose, Menlo Park, Redwood City, San Francisco, Richmond, South San Francisco, Union City, and Dublin.
But when listed by inter-municipal segregation ranking, the top spot goes to East Palo Alto, followed by San Anselmo, Mill Valley, San Pablo, Tiburon, American Canyon, Los Gatos, Gilroy, Lafayette, and Orinda.
The most segregated white neighborhoods on the inter-municipal list are in small, sparsely populated areas like Ross, Belvedere, Mill Valley, and Los Gatos.
The most integrated cities on the inter-municipal list are Rohnert Park, Windsor, Petaluma, Pinole, Suisun City, and Cloverdale.
Counties
Meanwhile, three counties were more segregated in 2020 than they were in 2010: Marin, Napa and Sonoma, with Marin being the most segregated county in the region by far.
Although seven of the nine Bay Area counties were more segregated in 2020 than they were in either 1980 or 1990, racial residential segregation in the region appears to have peaked around the year 2000, and has generally declined since.
The reports and accompanying data can be accessed on this page.
Media Contact
Marc Abizeid
marcabizeid@berkeley.edu
###


