Introduction
From 2018 to 2020, we undertook a five-part investigation of racial residential segregation in the San Francisco Bay Area. We studied the nature and extent of racial residential segregation, demographic change, and harmful effects, using different measures of segregation. Our final brief of the series offered possible policy solutions.
Although our study was focused on neighborhoods (census tracts) and regions (Metropolitan Statistical Areas and counties), we separately examined city-level segregation in an addendum. In that addendum, published in November of 2020, we ranked every city in the Bay Area from most to least segregated internally and in terms of segregation from the surrounding region.
Using the recently-released 2020 Census data, we now update these findings and lists. In addition, we rank the top 10 most segregated neighborhoods in the Bay Area for every major racial group. This is the first time we will have presented this analysis (although we identified specific racial concentrations in Part 2 of our original series).
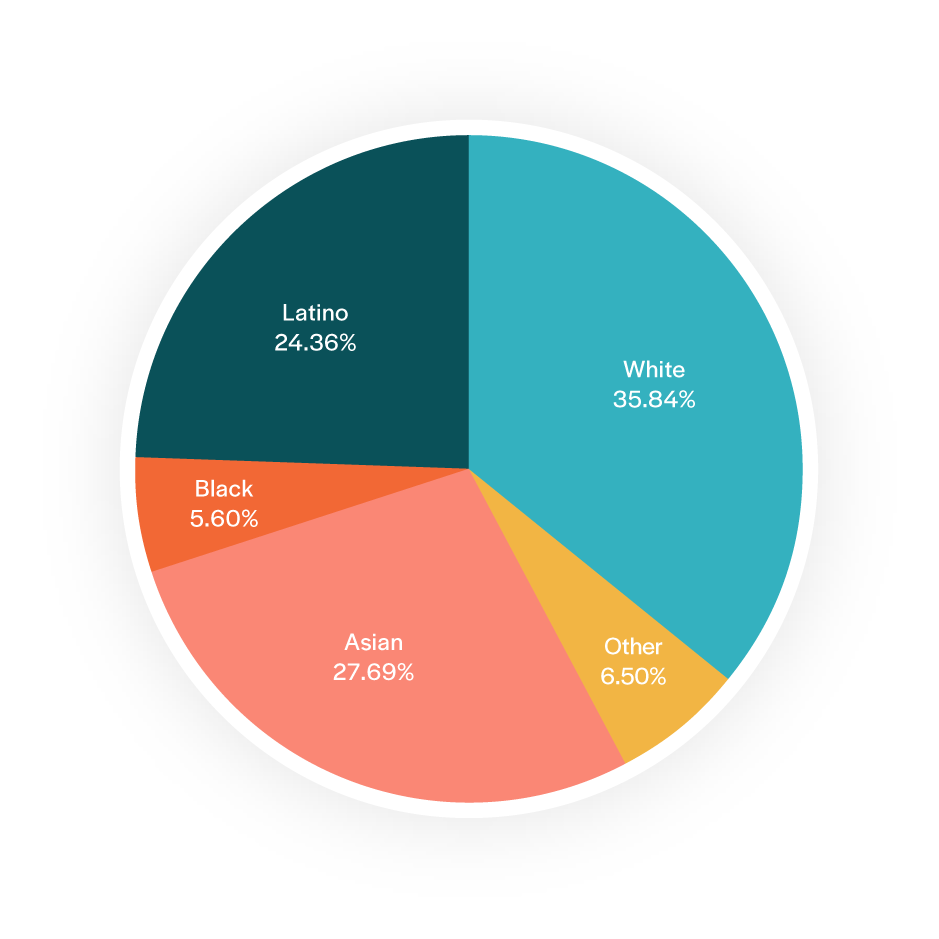
To contextualize this information, we report that, according to the 2020 Census, the nine-county Bay Area region is 36 percent white, 28 percent Asian, 24 percent Latino, 6 percent Black, and 6.5 percent “other,” including American Indians and Alaskan Natives (AIAN), Native Hawaiian and Pacific Islanders (NHPI), and multi-race populations.
Key Findings:
- Two of the three most segregated Black neighborhoods are in San Francisco's Bay View/Hunter's Point region
- Six of the 10 most segregated Black neighborhoods are in Oakland
- The most segregated Latino neighborhood is in San Rafael's Canal region, with the next four in Oakland
- The most segregated Asian neighborhood is around San Francisco's Chinatown, with the next three in Fremont
- The most segregated white neighborhoods are in small, sparsely populated areas like Ross, Belvedere, Mill Valley, and Los Gatos
- The most segregated (intra-municipal) city is Oakland, followed by San Rafael, San Jose, Menlo Park, Redwood City, San Francisco, Richmond, South San Francisco, Union City, and Dublin
- The most segregated (inter-municipal) city is East Palo Alto, followed by San Anselmo, Mill Valley, San Pablo, Tiburon, American Canyon, Los Gatos, Gilroy, Lafayette, and Orinda
- The most integrated (inter-municipal) cities are Rohnert Park, Windsor, Petaluma, Pinole, Suisun City, and Cloverdale
- Three counties were more segregated in 2020 than they were in 2010: Marin, Napa, and Sonoma, with Marin being the most segregated county in the region by far.
- Although 7 of the 9 Bay Area counties were more segregated in 2020 than they were in either 1980 or 1990, racial residential segregation in the region appears to have peaked around the year 2000 and has generally declined since.
Defining Segregation
Segregation is the separation across space of one or more groups of people from each other on the basis of their group identity. Racial segregation is the separation of people from each other on the basis of race. Racial residential segregation is the separation of people on the basis of race in terms of residence, rather than some other form, such as occupational or educational segregation, or the segregation of public accomodations, such as buses, trains, or theaters. These forms of segregation can occur together or not. Places of worship may remain segregated, for example, even as schools and workplaces integrate. We discuss the definition of segregation in more depth in Part 3 of our Bay Area segregation report series.
Change in Racial Segregation, 2010-2020
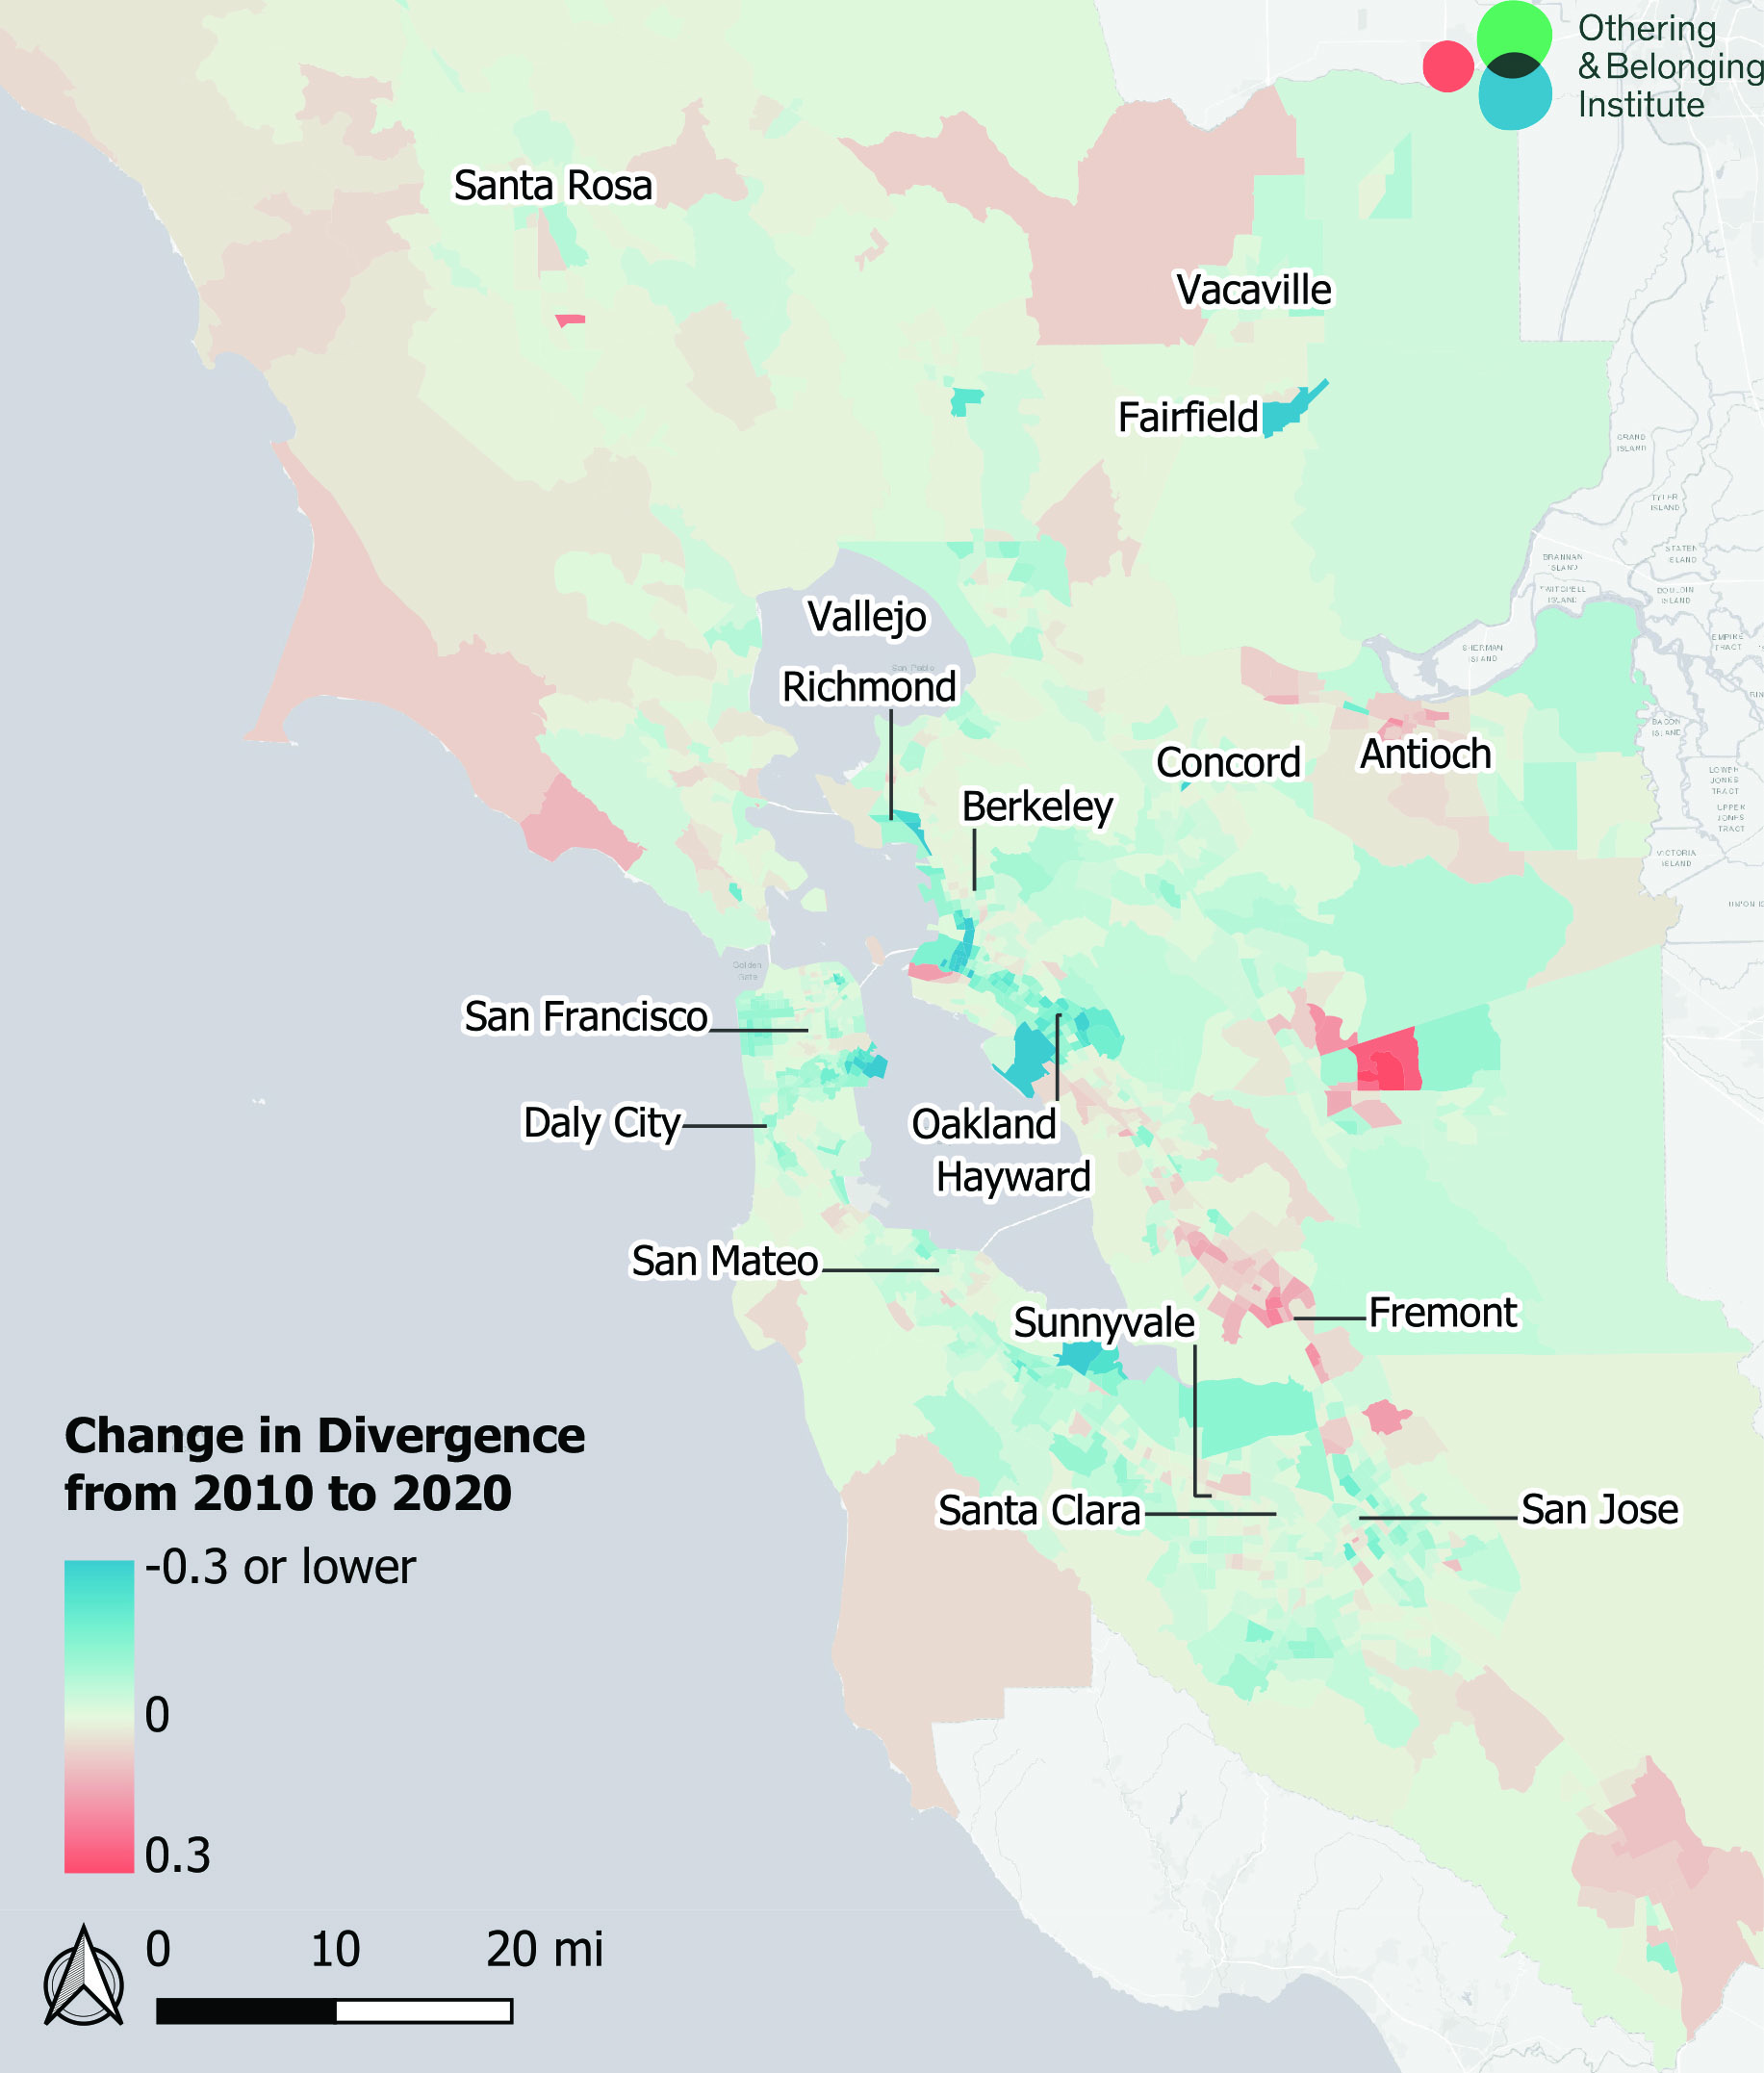
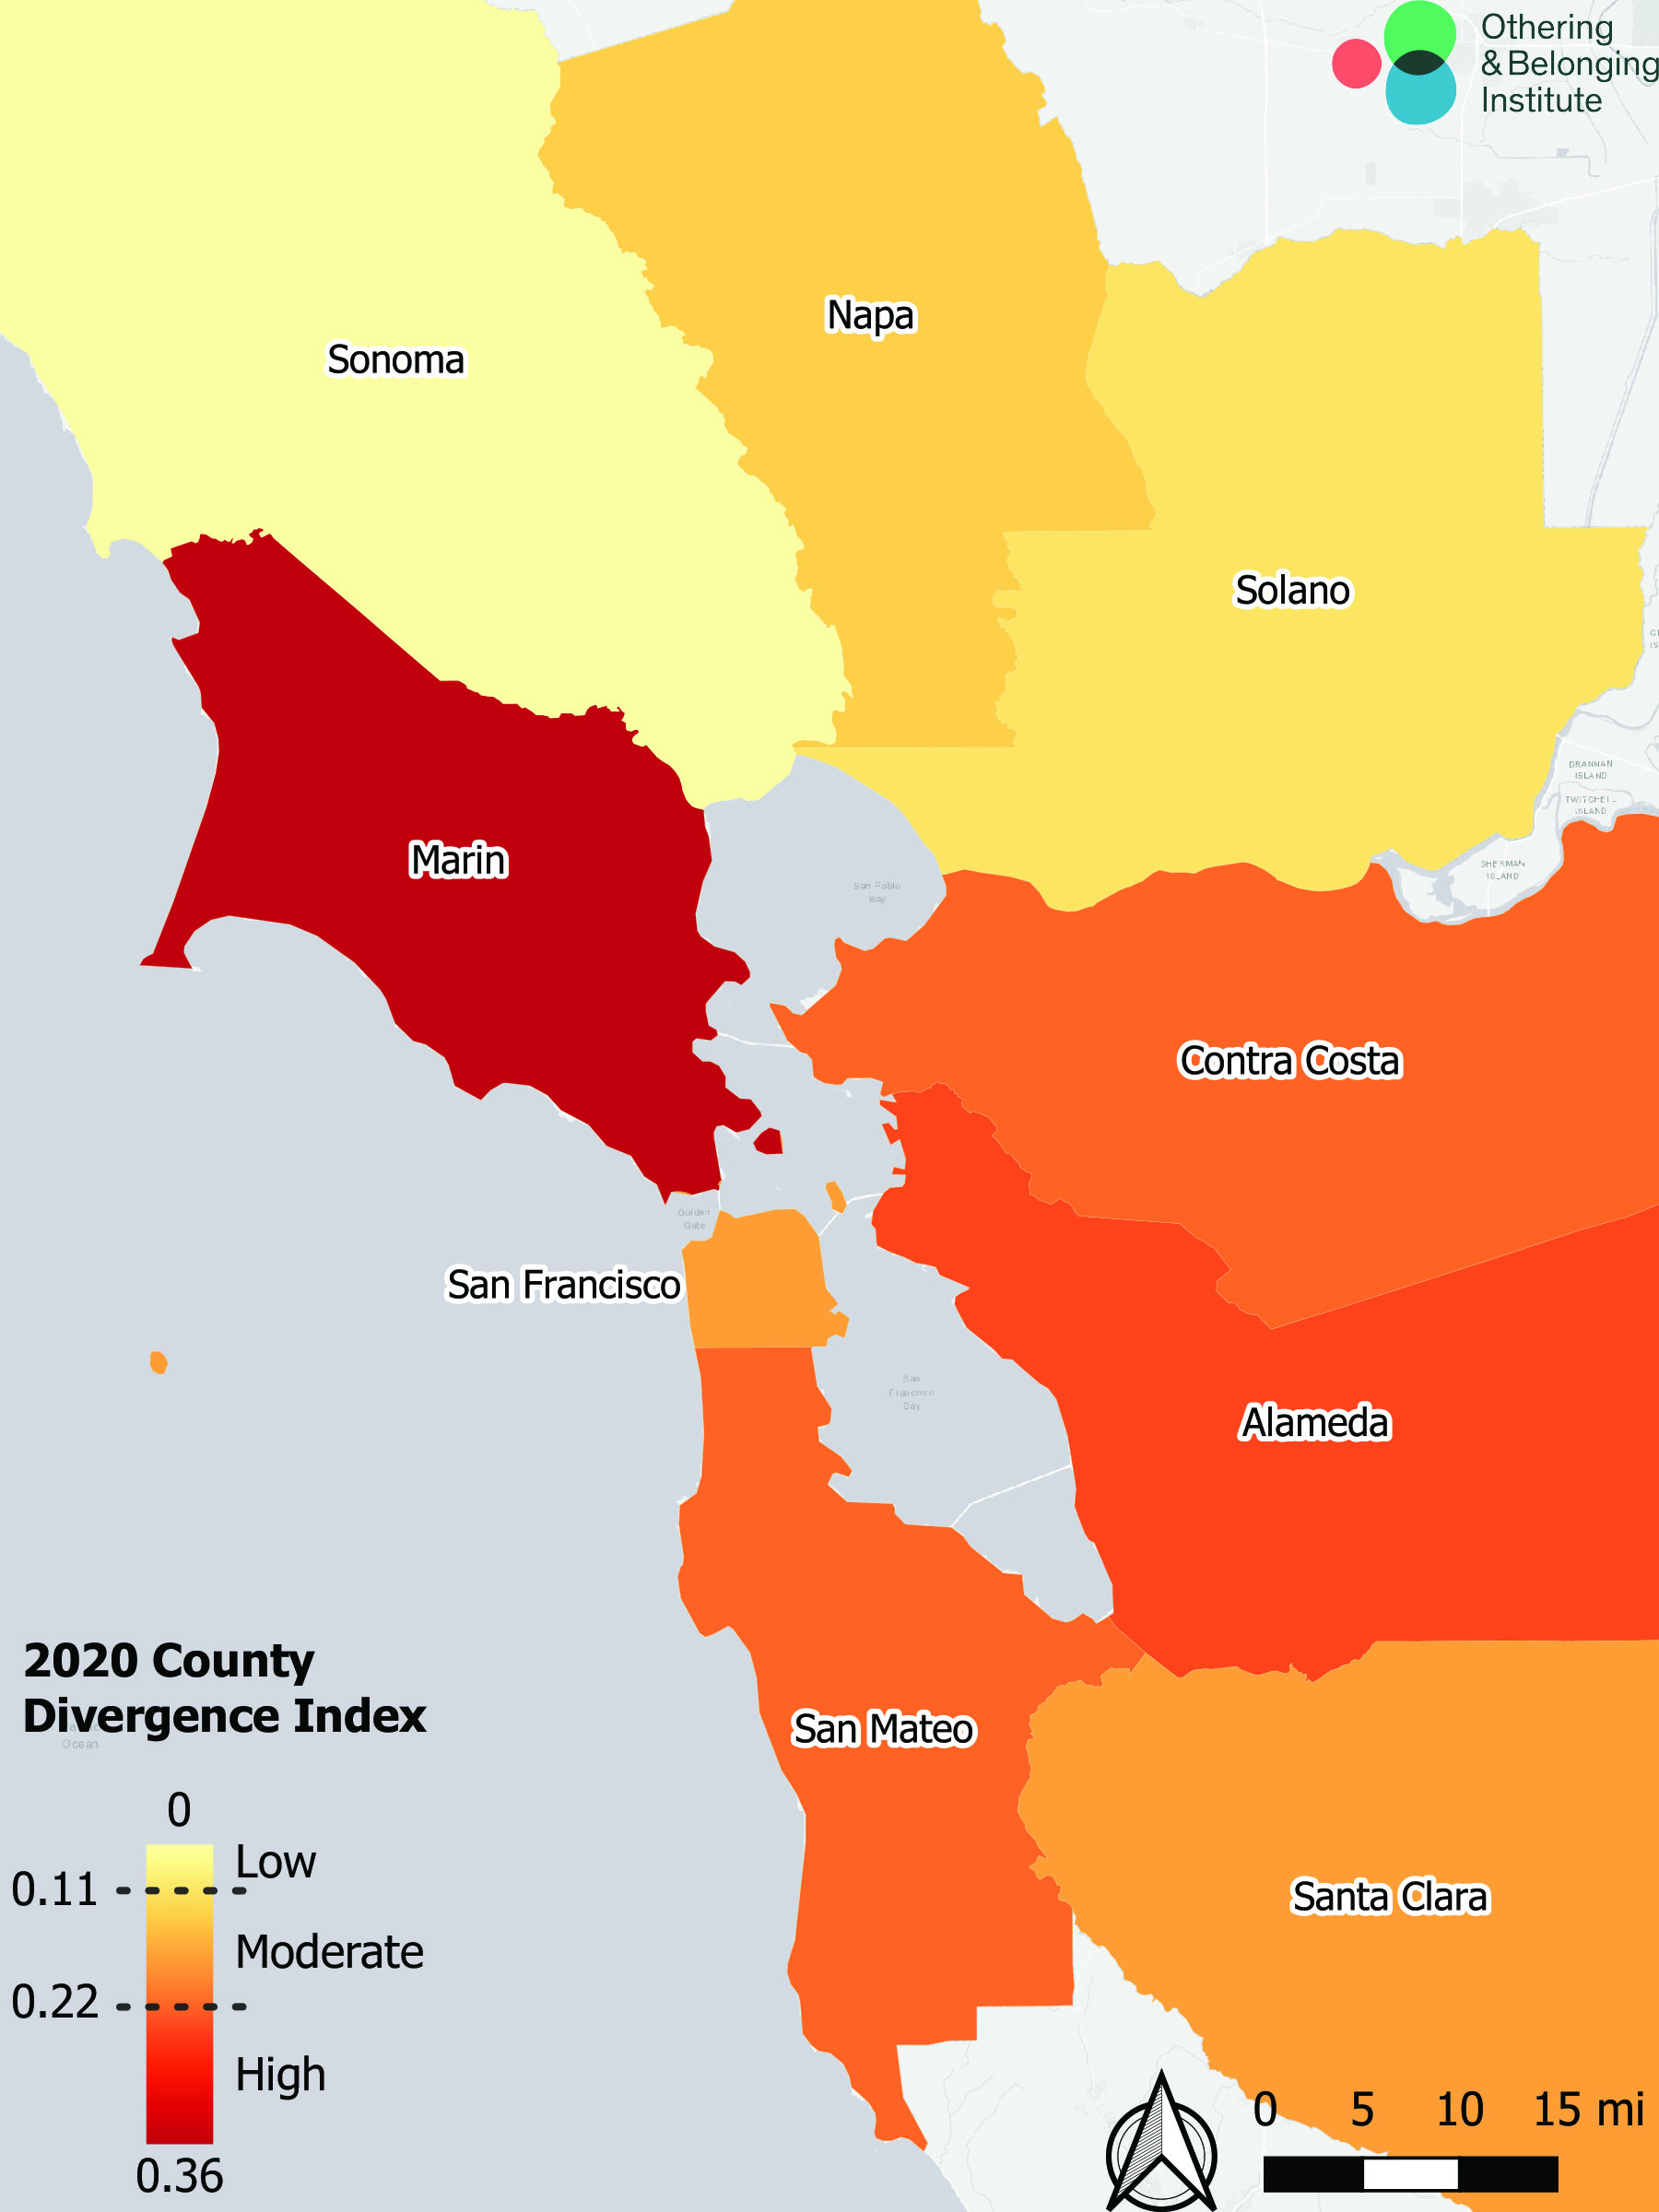
Like most of the country, the Bay Area's racial demographics and residential patterns continue to evolve. Figure 2 below is a map that illustrates changes in the "divergence score," our preferred measure of segregation, across the Bay Area from 2010 to 2020. Light blue areas show relative declines in racial residential segregation while red shades show relative increases.
In Part 3 of this series, we presented tables indicating the change in Divergence Index values over the decades by County as well similar change-over-time maps (specifically, we presented a map showing change in Divergence Index scores from 1980 to 2010). In part 5 of our series, "Remedies, Solutions and Targets," we presented a table projecting the level of racial residential segregation into the future, all the way to 2030. Using 2020 Census data, we now present the updated change, showing county-level divergence scores from 1970 through 2020, in Figure 3 below.
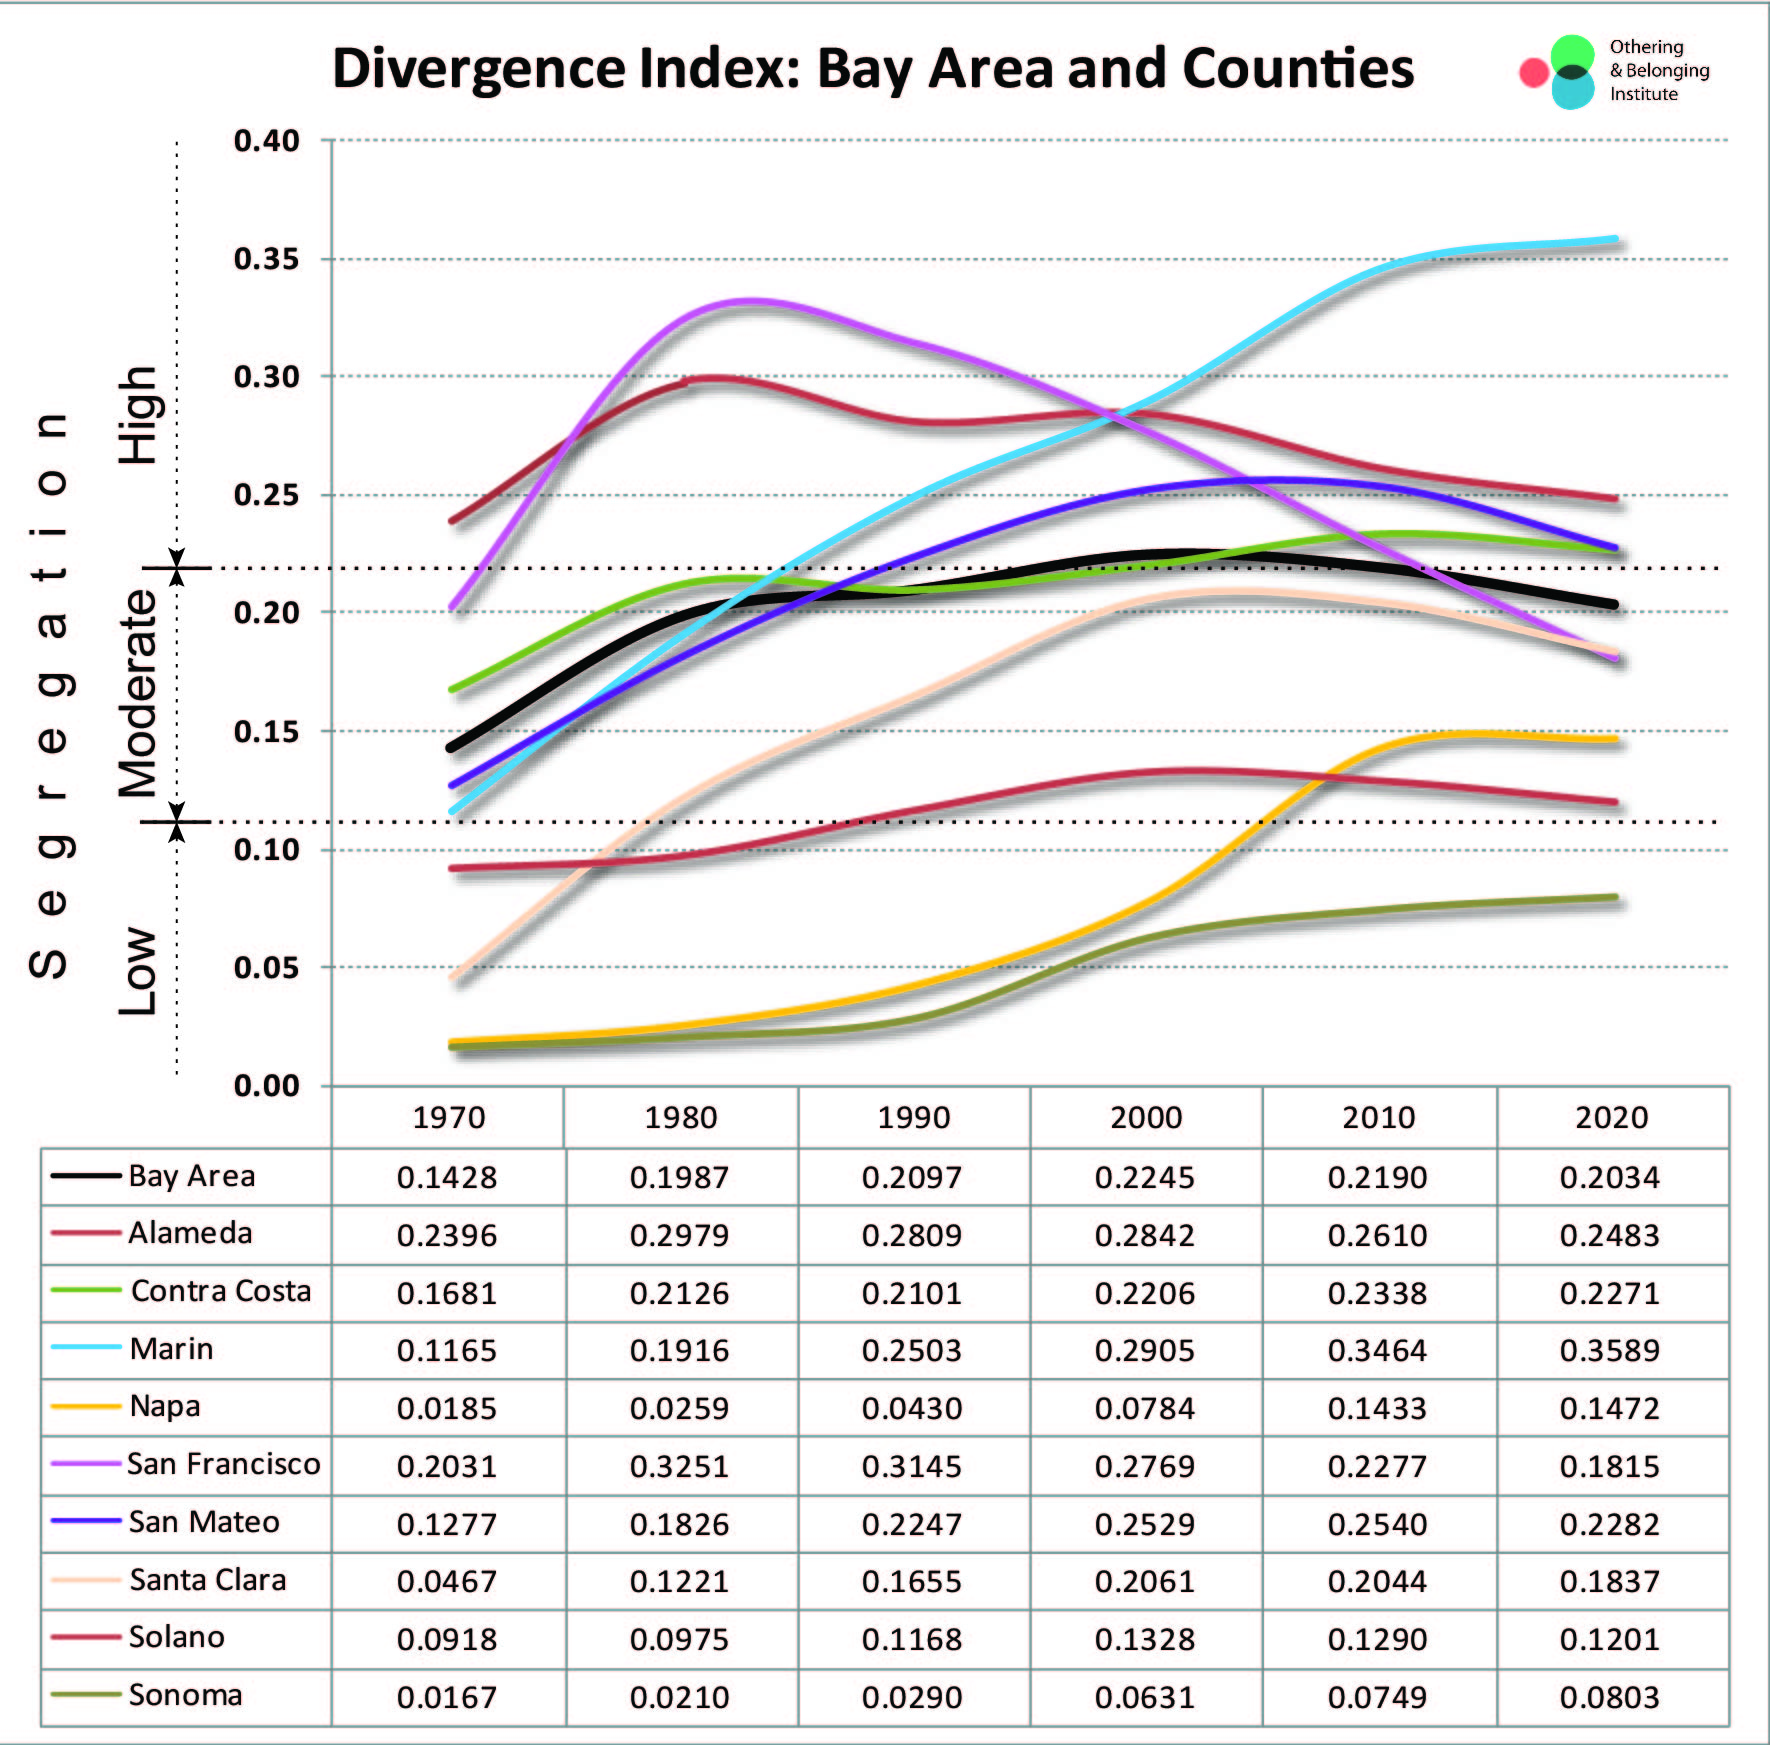
The good news is that, as a region, the San Francisco Bay Area is slightly less segregated as of 2020 than it was in 2010. Not only have overall regional levels of segregation slightly declined, but only three counties are also more segregated as of 2020 than they were in 2010: Marin, Napa and Sonoma. The other six counties had declines in divergence scores. Even better, 5 of the 8 counties for which we made projections and set numerical targets for 2020, 2025 and 2030 (in Table 4 of Part 5) outperformed not only our projections but also the target goals we set, which we argued could be achieved if deliberate desegregative policies, such as those we recommended there, were pursued. Alameda and Santa Clara's divergence scores were not only below projections, but below 2020 targets if such policies were implemented. Solano, Sonoma and Napa's scores were not only lower than projections, but lower than the targets we set for 2020, 2025, and 2030. In each of these cases, either our projections were too pessimistic or efforts towards greater desegregation are succeeding in those counties. Overall, racial residential segregation appears to have peaked around 2000.
The bad news is that the Bay Area is significantly more segregated than it was in 1970, 1980, or even 1990. Eight of the 9 counties are more segregated as of 2020 than they were in 1970, and 7 of the 9 are more segregated in 2020 than they were in 1980. And some counties, like Marin and Napa, are significantly more segregated than they were in previous decades — as shown in Figure 4 below. Three counties, Contra Costa, San Francisco and San Mateo disappointingly yielded divergence scores that were higher than we projected for 2020, even though their overall scores declined. The decline in measured levels of segregation was not as steep as we had anticipated, suggesting more work needs to be done to address this problem.
Finally, we present a time-lapse map in Figure 5, immediately below, in which users can observe these changes from a holistic, birds-eye perspective of the 9-county Bay Area.
The Most Segregated Communities in the Bay Area
As we described in our 2020 addendum and in Part 3 of our series, there are two types of measurable segregation: neighborhood or “intra-municipal” segregation, and regional segregation, or “inter-municipal” segregation. The former measures the degree of segregation internal to a city or municipality. The latter measures the degree of segregation experienced by this community in relation to the larger region.
Large cities like Oakland tend to have much more neighborhood segregation than regional segregation, since they are so diverse. In contrast, heavily white suburbs or exurban towns tend to have very little internal segregation, but are highly divergent in terms of their racial demographics from the surrounding region.
There are 101 cities in the Bay Area, but this time, our segregation measure excludes those with fewer than 10,000 people, giving us a total of 86 cities we can rank. A complete list, alphabetically ordered, is available for download here.
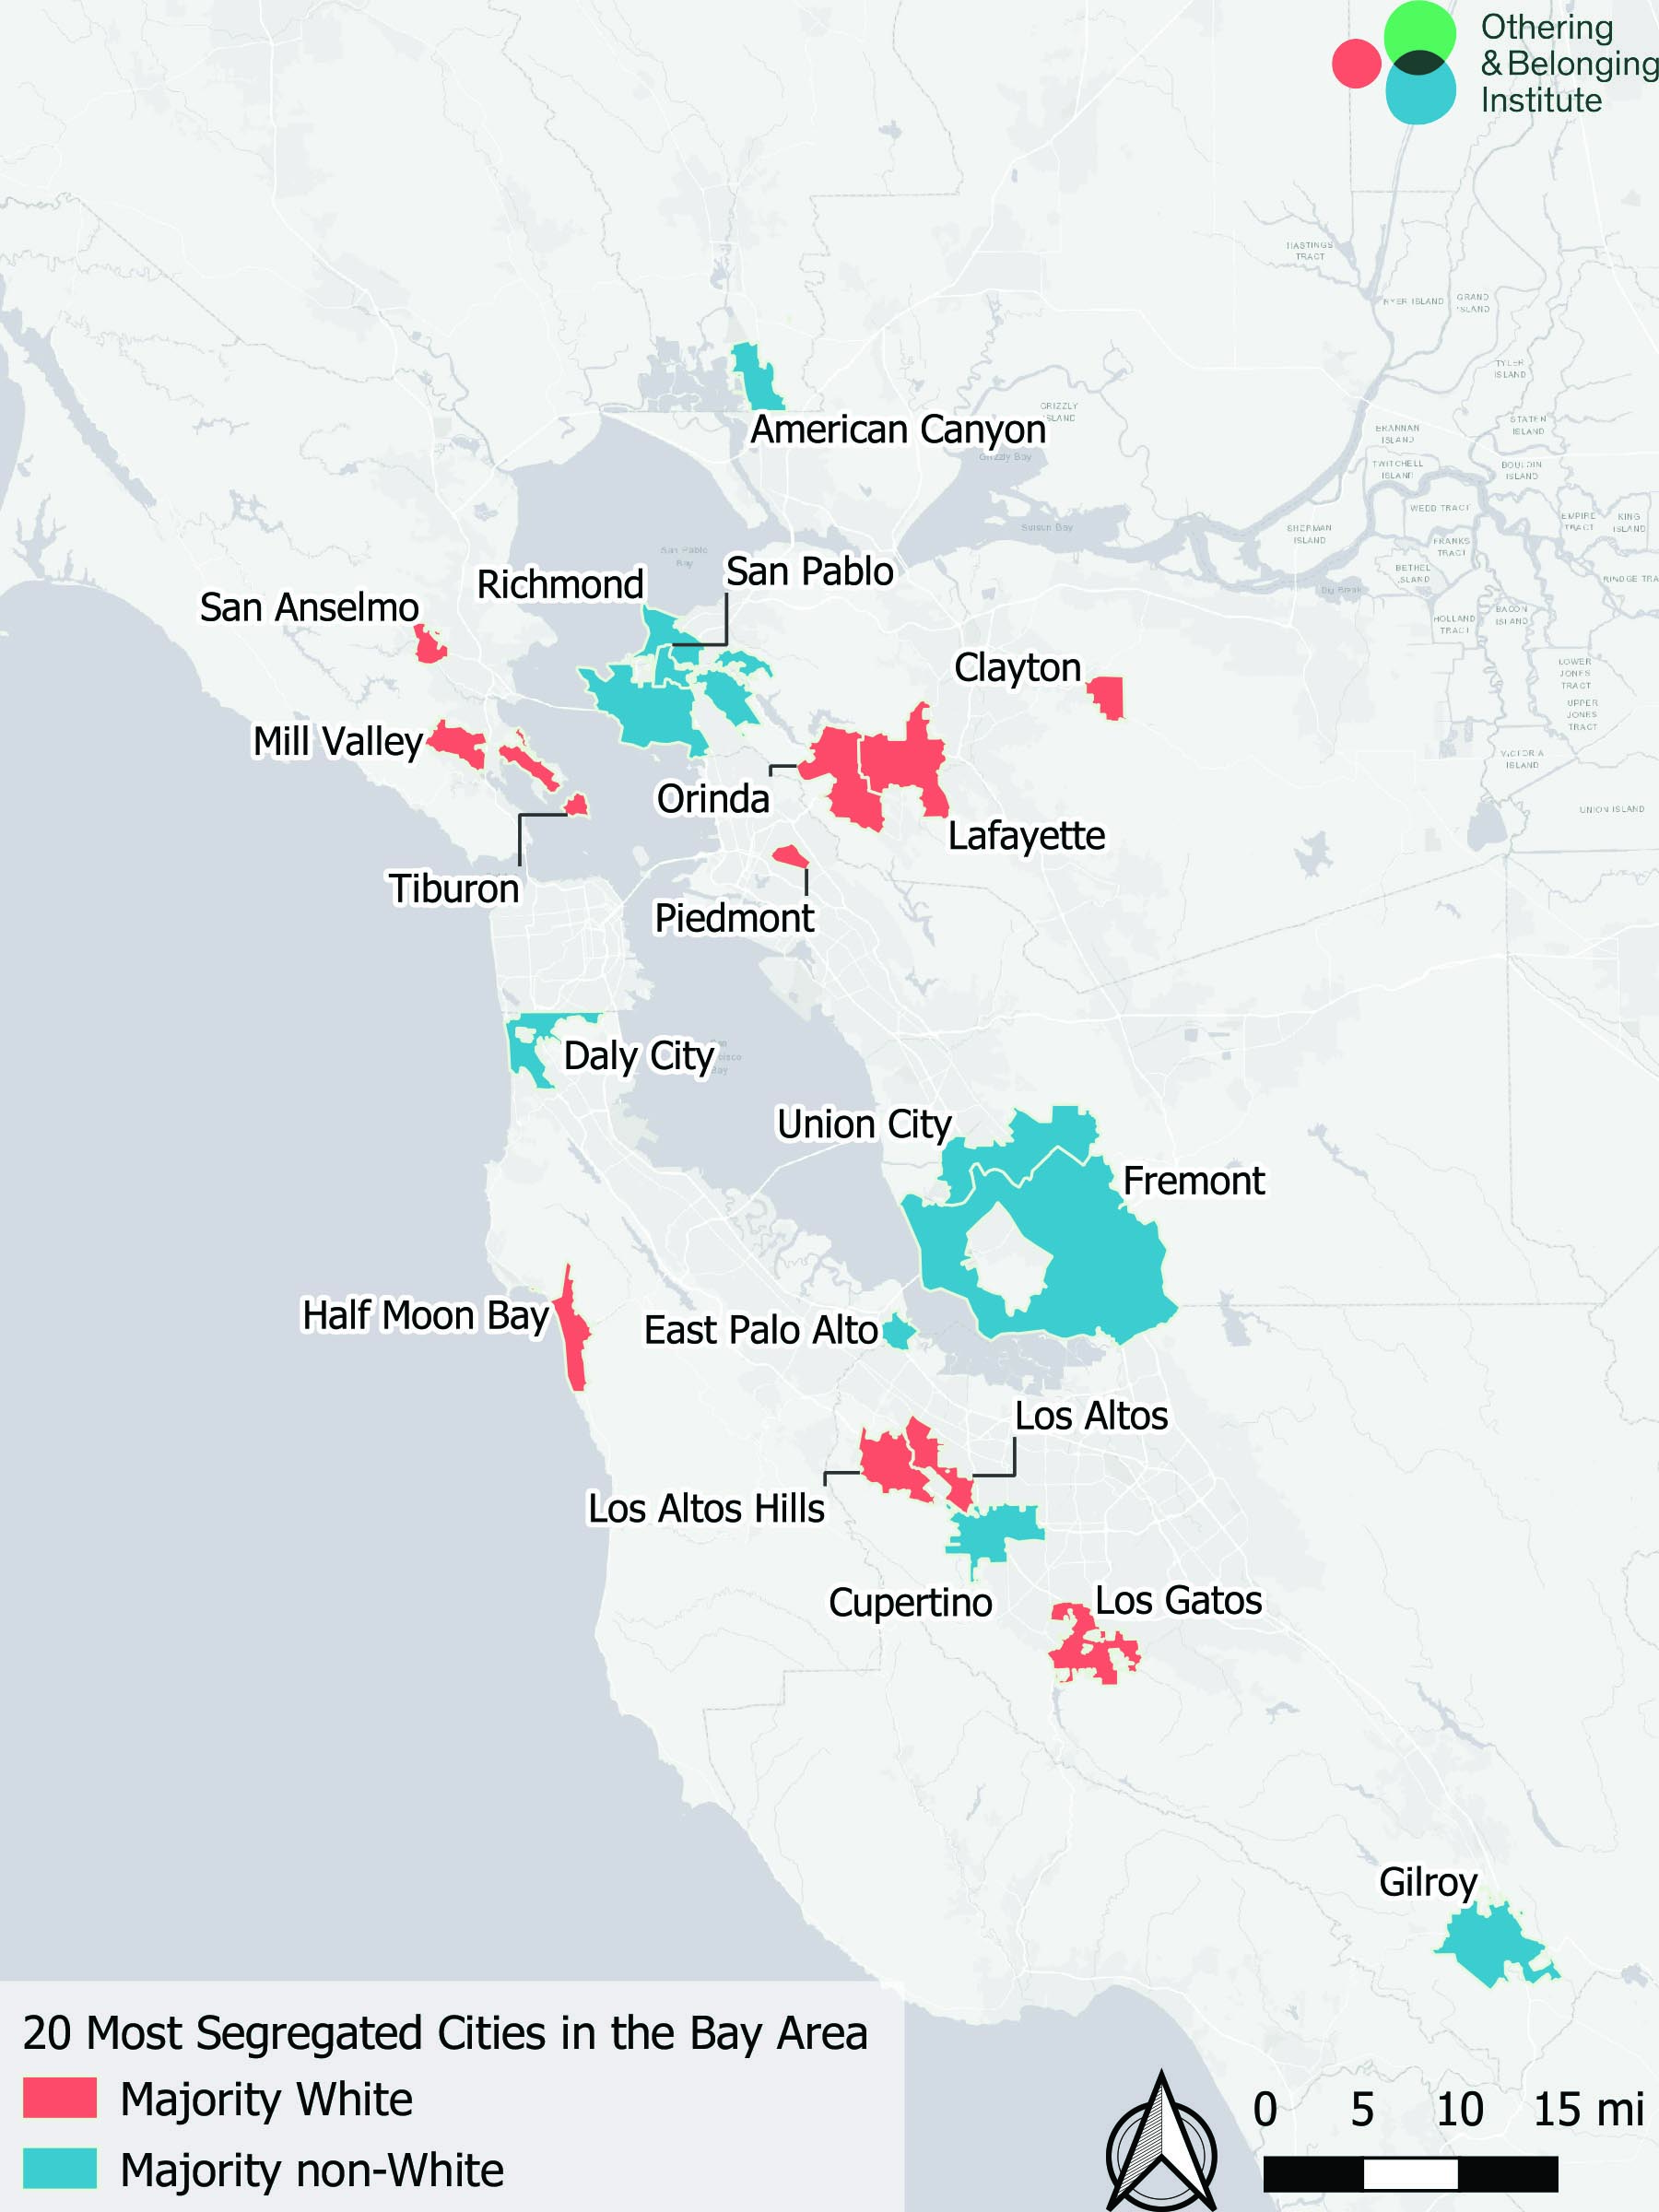
Here are the top 20 cities with the highest levels of “inter-municipal” or regional segregation in the Bay Area:
Table 1: The 20 Most Segregated Cities in the Bay Area
| Cities/Towns | Inter-municipal Divergence | Median Household Income (2019) | Asian (%) | Black (%) | Latino (%) | White (%) | Other (%) | Level of Segregation |
|---|---|---|---|---|---|---|---|---|
| East Palo Alto | 0.6345 | $67,087 | 5.46% | 10.33% | 64.74% | 9.48% | 9.99% | High |
| San Anselmo | 0.4892 | $128,212 | 3.45% | 0.69% | 8.79% | 79.59% | 7.49% | High |
| Mill Valley | 0.4749 | $163,614 | 5.86% | 0.83% | 6.22% | 80.15% | 6.94% | High |
| San Pablo | 0.4279 | $53,198 | 13.92% | 11.38% | 61.50% | 9.14% | 4.06% | High |
| Tiburon | 0.4248 | $154,915 | 7.55% | 0.99% | 6.43% | 77.73% | 7.30% | High |
| American Canyon | 0.3127 | $101,792 | 33.72% | 6.40% | 30.65% | 21.98% | 7.26% | High |
| Los Gatos | 0.3093 | $155,863 | 19.58% | 0.78% | 9.03% | 63.95% | 6.67% | High |
| Gilroy | 0.3025 | $101,616 | 9.64% | 1.97% | 57.50% | 26.14% | 4.75% | High |
| Lafayette | 0.2899 | $178,889 | 13.04% | 0.86% | 8.44% | 69.45% | 8.21% | High |
| Orinda | 0.2809 | $223,217 | 16.68% | 0.90% | 6.38% | 68.40% | 7.64% | High |
| Fremont | 0.2759 | $133,354 | 63.73% | 2.22% | 12.59% | 16.55% | 4.92% | High |
| Los Altos Hills | 0.2677 | $250,001 | 33.28% | 0.29% | 4.15% | 55.96% | 6.31% | High |
| Half Moon Bay | 0.2666 | $134,177 | 5.48% | 0.64% | 34.35% | 54.95% | 4.58% | High |
| Clayton | 0.2644 | $157,768 | 9.61% | 1.86% | 12.30% | 68.18% | 8.04% | High |
| Cupertino | 0.2467 | $171,917 | 68.33% | 0.56% | 4.18% | 23.04% | 3.89% | High |
| Daly City | 0.2443 | $94,550 | 57.22% | 2.27% | 23.76% | 11.69% | 5.06% | High |
| Union City | 0.2409 | $114,681 | 57.72% | 4.27% | 21.23% | 10.95% | 5.83% | High |
| Los Altos | 0.2366 | $235,278 | 34.83% | 0.53% | 4.65% | 53.21% | 6.78% | High |
| Richmond | 0.2366 | $68,472 | 14.20% | 17.26% | 44.73% | 17.44% | 6.37% | High |
| Piedmont | 0.2326 | $224,659 | 19.86% | 1.13% | 6.53% | 62.60% | 9.87% | High |
There are 101 incorporated municipalities in the Bay Area, and so it is a simple matter to rank all of them by their divergence score. Looking at inter-municipal segregation first, which compares the demographics of the cities against that of the Bay Area, we find clear patterns.
Once again, and unsurprisingly, we find that East Palo Alto is the most segregated city in the Bay Area. East Palo Alto was a historically Black community created from redlining and racial exclusion that limited where Black families could live in the region. Although East Palo Alto remains 10 percent Black, in recent decades it has become majority Latino (64.4 percent). It is also one of the more relatively affordable areas in the region. San Pablo, Gilroy, and Richmond stand out as three cities on the list with similar demographics, and an extremely high proportion of Black and Latino residents relative to the region.
In contrast, San Anselmo, Mill Valley, Tiberon, Los Gatos, Lafayette, Orinda, Clayton, and Piedmont all stand out as highly affluent and heavily segregated (and exclusionary) white municipalities, primarily in the suburban fringe of Oakland or in Marin County. These are cities that are more than 60 percent white in a region that is closer to 40 percent white. Most of these cities have fewer than 1 percent Black populations.
Fremont, Cupertino, Daly City, Union City, and to a lesser extent Canyon City and Los Altos, stand out as areas of extremely high concentrations of Asians relative to the region, helping explain why they score so high in terms of segregation. Figure 6, below, is a map of these cities, which illustrates the pattern.
The Most Internally Segregated Cities in the Bay Area
Highly diverse cities tend to be far less segregated from their surrounding region, but can be highly segregated internally. This matters because it means that diverse places can produce racially isolated schools, neighborhoods, recreational areas, and lived experiences. A low level of “divergence” from the surrounding region can thus mask considerable internal segregation.
For that reason, we present the top 10 most internally segregated cities (cities with the highest levels of neighborhood segregation) in the Bay Area, as measured by “intra-municipal” divergence:
Table 2: Cities with the Highest Levels of Neighborhood Segregation in the Bay Area
| Cities/Towns | Intra-municipal Divergence | Population | Asian (%) | Black (%) | Latino (%) | White (%) | Other (%) | Level of Segregation |
|---|---|---|---|---|---|---|---|---|
| Oakland | 0.2193 | 442,444 | 15.92% | 20.69% | 28.71% | 27.39% | 7.30% | High |
| San Rafael | 0.1820 | 61,712 | 6.45% | 1.57% | 33.50% | 52.50% | 5.99% | High |
| San Jose | 0.1754 | 1,018,075 | 38.02% | 2.71% | 31.04% | 23.60% | 4.63% | High |
| Menlo Park | 0.1625 | 32,863 | 17.00% | 2.92% | 17.65% | 55.02% | 7.41% | High |
| Redwood City | 0.1588 | 84,051 | 15.96% | 1.66% | 35.85% | 40.34% | 6.20% | High |
| San Francisco | 0.1575 | 873,759 | 33.67% | 5.16% | 15.65% | 39.05% | 6.48% | High |
| Richmond | 0.1434 | 121,064 | 14.20% | 17.26% | 44.73% | 17.44% | 6.37% | High |
| South San Francisco | 0.0931 | 65,970 | 40.64% | 1.80% | 32.80% | 18.10% | 6.66% | High |
| Union City | 0.0859 | 69,624 | 57.72% | 4.27% | 21.23% | 10.95% | 5.83% | High |
| Dublin | 0.0832 | 73,366 | 53.23% | 3.75% | 11.55% | 25.26% | 6.21% | High |
| Danville | 0.0814 | 55,877 | 22.42% | 1.00% | 8.29% | 61.92% | 6.38% | High |
As expected, this table tells a very different story. Once again, Oakland is at the top, a reminder that the city of Oakland is both highly diverse and extremely balkanized into racially identifiable neighborhoods. The two other largest cities in the nine-county region, San Jose and San Francisco, also make this list for similar reasons, although they are not as extreme as Oakland.
The only city to make both lists, somewhat notoriously, is Richmond, demonstrating how a city can be highly segregated both from its surrounding region, as well as internally between its neighborhoods.
The Most Segregated Neighborhoods in the Bay Area
Understanding the level of segregation visible across our cities and towns is helpful to understand the harmful effects that may be occurring in these places or the policies that may be sustaining this segregation. However, it is also important to understand what is happening at the neighborhood level. For that reason, we present the top 10 most segregated neighborhoods (census tracts) for each of the four major racial groups in the Bay Area.
Table 3: The 10 Most Segregated Black Neighborhoods in the Bay Area
| Neighborhood | City/Town | Divergence | Asian (%) | Black (%) | Latino (%) | Native American (%) | Native Hawaiian and Pacific Islander (%) | White (%) | Other (%) |
|---|---|---|---|---|---|---|---|---|---|
| Hunters Point Blvd/Innes Ave (Part of Hunters Point) | San Francisco | 1.0968 | 9.40% | 49.60% | 19.20% | 0.50% | 10.90% | 3.20% | 7.20% |
| MacArthur Blvd/82nd Ave (Oak Knoll Golf Links) | Oakland | 0.776 | 6.90% | 50.90% | 18.40% | 0.20% | 0.60% | 15.30% | 7.60% |
| Keith St/Oakdale Ave (Between Bayview and India Basin) | San Francisco | 0.7671 | 15.20% | 49.30% | 19.00% | 0.40% | 2.20% | 7.40% | 6.50% |
| Adeline St/8th St (Acorn) | Oakland | 0.7617 | 10.10% | 50.40% | 8.40% | 0.10% | 0.50% | 20.00% | 10.40% |
| MacArthur Blvd/98th Ave (Toler Heights and Foothill Square) | Oakland | 0.7557 | 6.90% | 47.30% | 27.10% | 0.20% | 1.60% | 10.60% | 6.30% |
| Mandela Pky/8th St (Part of Cypress Village, Oak Center, and Ralph Bunche) | Oakland | 0.7258 | 10.50% | 50.30% | 13.70% | 0.40% | 1.00% | 17.00% | 7.10% |
| Sycamore Dr/L St | Antioch | 0.694 | 5.10% | 39.10% | 37.80% | 0.30% | 2.50% | 9.40% | 5.70% |
| San Quentin | San Quentin | 0.6528 | 2.10% | 41.60% | 21.80% | 2.20% | 0.60% | 28.80% | 2.90% |
| Lower Bottom | Oakland | 0.5668 | 4.80% | 41.50% | 20.30% | 0.40% | 0.40% | 25.00% | 7.50% |
| Majestic Ave/Outlook Ave (Part of Millsmont) | Oakland | 0.5376 | 6.20% | 39.10% | 27.30% | 0.50% | 0.20% | 19.20% | 7.50% |
It is notable that six of the 10 most segregated Black neighborhoods in the Bay Area are in Alameda County, and specifically Oakland neighborhoods. Although the numbers have been declining over the past few decennial censuses, these remain historically Black neighborhoods, segregated from the start. Interestingly, we earlier identified eight of the 10 most segregated Black neighborhoods in Oakland using 2010 Census data. The two San Francisco census tracts on this list, both in Bayview Hunter’s Point, remain the most segregated Black neighborhoods in the entire Bay Area.
Table 4: The 10 Most Segregated Latino Neighborhoods in the Bay Area
| Neighborhood | City/Town | Divergence | Asian (%) | Black (%) | Latino (%) | Native American (%) | Native Hawaiian and Pacific Islander (%) | White (%) | Other (%) |
|---|---|---|---|---|---|---|---|---|---|
| Canal | San Rafael | 1.1117 | 1.30% | 0.80% | 91.90% | 0.50% | 0.00% | 4.60% | 0.90% |
| 98th Ave/Cherry Ave (Part of Cox and Iveywood) | Oakland | 0.8822 | 3.20% | 20.60% | 69.80% | 0.10% | 2.00% | 1.80% | 2.50% |
| Birch St/88th Ave (Western part of Webster) | Oakland | 0.8639 | 2.90% | 22.70% | 67.90% | 0.20% | 1.00% | 2.50% | 2.90% |
| 73rd Ave/Holly St (Arroyo Viejo) | Oakland | 0.862 | 3.00% | 34.40% | 53.80% | 0.40% | 1.30% | 3.60% | 3.40% |
| Bancroft Ave/82nd Ave (Eastern part of Webster and Castlemont) | Oakland | 0.8607 | 4.00% | 35.90% | 50.30% | 0.30% | 2.40% | 2.90% | 4.30% |
| Belding Woods | Richmond | 0.8596 | 3.60% | 8.00% | 81.20% | 0.30% | 0.30% | 3.80% | 2.80% |
| Hillside St/76th Ave (Eastmont) | Oakland | 0.8557 | 2.90% | 36.80% | 50.50% | 0.40% | 1.10% | 4.30% | 4.00% |
| City Center | Gilroy | 0.8557 | 1.60% | 1.60% | 86.40% | 0.30% | 0.20% | 7.70% | 2.10% |
| City Center | East Palo Alto | 0.8426 | 3.50% | 8.20% | 72.30% | 0.00% | 7.70% | 5.20% | 3.00% |
| Ohio Ave/Harbour Ways (Nystrom Village) | Richmond | 0.8338 | 3.40% | 23.90% | 66.50% | 0.10% | 0.40% | 3.40% | 2.20% |
As was the case for African Americans, half of the most segregated Hispanic neighborhoods are also in Oakland. As the table above indicates, these are neighborhoods with large Black populations as well, making them essentially segregated Black and Brown neighborhoods in places like the Fruitvale district of Oakland and flatlands of East Oakland. These segregated neighborhoods also point to the demographic shift in the last decade. Though the majority of these segregated neighborhoods were in Santa Clara County as per 2010 data, the Hispanic population seems to have moved towards Alameda and Contra Costa counties.
By far the most segregated Hispanic neighborhood in the Bay Area, however, is the Canal neighborhood of San Rafael, a place that is more than 90 percent Hispanic, an enormous concentration for a heavily white county. This neighborhood was found to be highly segregated using 2010 census data as well.
Two neighborhoods in Richmond and two more in Gilroy and East Palo Alto round out the list.
Table 5: The 10 Most Segregated Asian Neighborhoods in the Bay Area
| Neighborhood | City/ Town |
Divergence | Asian (%) | Black (%) | Latino (%) | Native American (%) | Native Hawaiian and Pacific Islander (%) | White (%) | Other (%) |
|---|---|---|---|---|---|---|---|---|---|
| Montgomery St/Jackson St (Between Chinatown, Jackson Square, and Financial District) | San Francisco | 0.8447 | 88.70% | 2.10% | 2.40% | 0.00% | 0.30% | 5.40% | 1.10% |
| Albrae/Northwestern Polytechnic U (Includes Coyote Hills RP, Don Edwards SF Bay Nat'l Wildlife Refuge, Baylands, and East Industrial) |
Fremont | 0.7517 | 85.50% | 1.70% | 3.80% | 0.10% | 0.10% | 6.30% | 2.50% |
| Millcreek Rd/ Guadalupe Ter (Part of Mission San Jose and Vineyards Avalon, extending into Mission Park Regional Reserve) |
Fremont | 0.7426 | 84.60% | 0.30% | 2.50% | 0.00% | 0.00% | 10.60% | 2.00% |
| Paseo Padre Pky/Ocaso Camino (Cameron Hills) | Fremont | 0.7301 | 84.10% | 0.40% | 2.30% | 0.10% | 0.10% | 10.50% | 2.60% |
| Kearny St/California St (Southern part of Chinatown) | San Francisco | 0.7214 | 84.20% | 0.60% | 3.70% | 0.30% | 0.00% | 9.10% | 2.20% |
| Camino Tassajara/ Camino Tassajara Rd |
San Ramon | 0.6969 | 82.90% | 1.60% | 2.90% | 0.10% | 0.30% | 8.50% | 3.80% |
| Mohave Dr/Fernald St | Fremont | 0.696 | 83.40% | 0.90% | 5.10% | 0.30% | 0.20% | 8.00% | 2.10% |
| Collins/Lowell (includes Napa Junction) | American Canyon | 0.6931 | 46.80% | 8.10% | 19.20% | 0.10% | 0.40% | 18.90% | 6.60% |
| Lemos Ln/Gomes Rd (East of Central Park) | Fremont | 0.6862 | 82.30% | 0.50% | 2.40% | 0.00% | 0.10% | 12.50% | 2.20% |
| Harrison St/14th St (Chinatown) | Oakland | 0.6793 | 82.20% | 4.10% | 3.20% | 0.10% | 0.20% | 7.90% | 2.30% |
Although Asians (especially Chinese and Japanese) were historically segregated by law and custom in the Bay Area, this list tells a very different story than the preceding two tables. Unsurprisingly, both San Francisco and Oakland’s Chinatowns appear on this list (with San Francisco’s Chinatown taking the top spot), but most of these neighborhoods are located in suburbs, not ethnic enclaves. Fully half of them are located in Fremont, a suburb in southern Alameda County. These tracts highlight the demographic shift since 2010 where four tracts each were in Alameda and San Francisco counties, while two were in Santa Clara County. With six highly segregated Asian neighborhoods in Alameda County in 2020, and one in Napa County, the segregation pattern points to changing demographics within the Bay area.
Table 6: The Top 10 Most Segregated White Neighborhoods in the Bay Area
| Neighborhood | City/Town | Divergence | Asian (%) | Black (%) | Latino (%) | Native American (%) | Native Hawaiian and Pacific Islander (%) | White (%) | Other (%) |
|---|---|---|---|---|---|---|---|---|---|
| Ross | Ross | 0.6308 | 1.80% | 0.10% | 5.70% | 0.00% | 0.00% | 87.40% | 5.00% |
| Belvedere | Belvedere | 0.5736 | 3.30% | 0.80% | 5.20% | 0.20% | 0.00% | 86.50% | 4.00% |
| Homestead Valley | Mill Valley | 0.5466 | 3.60% | 0.40% | 5.30% | 0.10% | 0.10% | 84.00% | 6.40% |
| Kennedy Rd/Los Gatos Blvd | Los Gatos | 0.5455 | 10.70% | 0.30% | 5.80% | 0.20% | 0.00% | 76.90% | 6.10% |
| Lexington Hills | Los Gatos | 0.5426 | 6.30% | 0.70% | 10.00% | 0.30% | 0.00% | 75.10% | 7.50% |
| City Center | Mill Valley | 0.5275 | 4.00% | 0.60% | 5.50% | 0.10% | 0.00% | 83.20% | 6.50% |
| Woodacre | Woodacre | 0.5175 | 1.80% | 0.80% | 8.30% | 0.40% | 0.10% | 80.70% | 7.80% |
| Bolinas | Bolinas | 0.5117 | 1.80% | 0.70% | 9.00% | 0.40% | 0.30% | 81.10% | 6.50% |
| Sleepy Hallow | San Anselmo | 0.5063 | 2.90% | 0.50% | 8.20% | 0.10% | 0.10% | 81.50% | 6.80% |
| Sir Francis Drake Blvd/Calumet Ave | San Anselmo | 0.5019 | 2.30% | 0.60% | 8.70% | 0.20% | 0.10% | 80.30% | 7.80% |
Once again, a clear pattern emerges. Eight of the 10 most segregated white neighborhoods are in Marin County, the overall most segregated county in the Bay Area. They are not, as one might have expected, in Napa, Sonoma, or Solano, the more rural and exurban counties in the Bay Area. In fact, the other two neighborhoods on this list are in Santa Clara County, in parts of Los Gatos. Compared to 2010 where half of the top 10 segregated white tracts showed up in Marin County, more tracts now show up as segregated in this county. Subsequently, two tracts in Sonoma County that were highly segregated in 2010 are no longer on the top 10 list.
The Most Integrated Cities in the Bay Area
The persistence of racial residential segregation in the San Francisco Bay Area is an issue that distorts the region’s economic future and long-run vitality. It undermines the life chances of too many families and children, isolating them from the opportunity that is so richly on offer in this region.
But there are some bright spots. Using the novel definition of integration developed for our national report this past June, we identified six cities as “racially integrated,” not simply those with the lowest measured level of racial residential segregation:
Table 7: The Integrated Cities in the Bay Area
| Cities/Towns | Inter-municipal Divergence | Population | Asian (%) | Black (%) | Latino (%) | White (%) | Other (%) |
Level of Segregation |
|---|---|---|---|---|---|---|---|---|
| Rohnert Park | 0.0107 | 51,871 | 8.30% | 2.04% | 27.99% | 54.43% | 7.25% |
Racially Integrated |
| Windsor | 0.0124 | 27,913 | 2.71% | 0.79% | 33.26% | 57.09% | 6.14% |
Racially Integrated |
| Petaluma | 0.0160 | 62,147 | 4.63% | 1.27% | 22.58% | 64.78% | 6.74% |
Racially Integrated |
| Pinole | 0.0212 | 16,598 | 25.48% | 10.75% | 26.69% | 29.27% | 7.82% |
Racially Integrated |
| Suisun City | 0.0234 | 31,955 | 18.64% | 17.55% | 29.34% | 24.54% | 9.93% |
Racially Integrated |
| Cloverdale | 0.0413 | 10,394 | 0.98% | 0.64% | 37.58% | 54.68% | 6.12% |
Racially Integrated |
The most integrated cities, unsurprisingly, are places that are relatively small or mid-sized suburbs in the Bay Area. Notably, they aren’t concentrated in a single county, but pretty well dispersed across the Bay.
Summary
Despite its reputation as a progressive and inclusive region, the Bay Area remains, like the rest of the country, highly segregated. The most segregated cities in the Bay Area are those that are either historically places where people of color were permitted to live, when locked out of other places, or are highly exclusionary and heavily white mid-sized to smaller suburbs and towns in places like Marin. In contrast, the most integrated places are places where different race people have settled over time, and where the exclusionary mechanisms are either weaker or non-existent.
Click to download an excel sheet with the rankings of all Bay Area cities by level of segregation. Read our multi-part analysis of segregation in the Bay Area here.