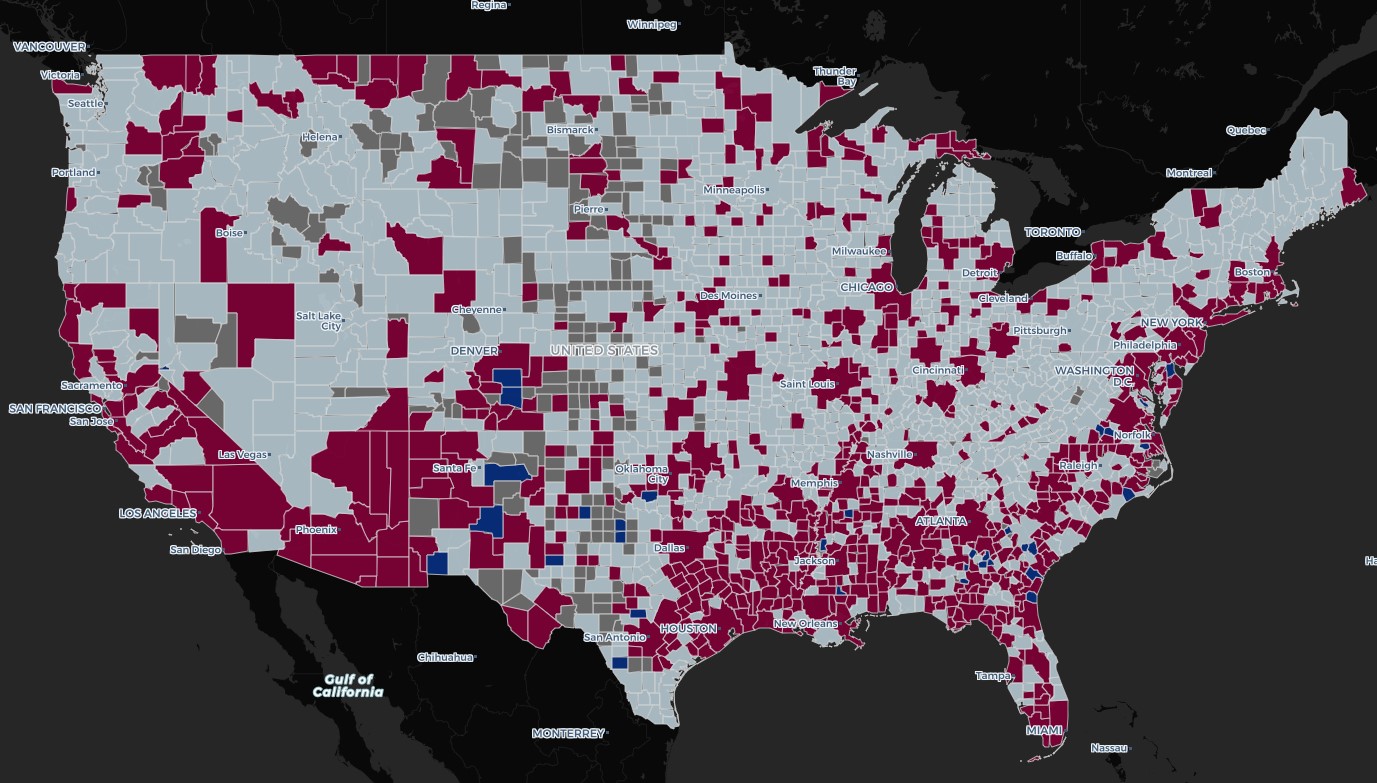
As part of our ongoing research into racial residential segregation, we offer two new reports based on the latest demographic data of the San Francisco Bay Area and nationally using the recently-released 2020 Census. We've also revamped our interactive web tool with significant improvements to view demographics and segregation in neighborhoods, cities, and regions across the country.
Read the press release here or scroll down to read about the updated research.
San Francisco Bay Area update
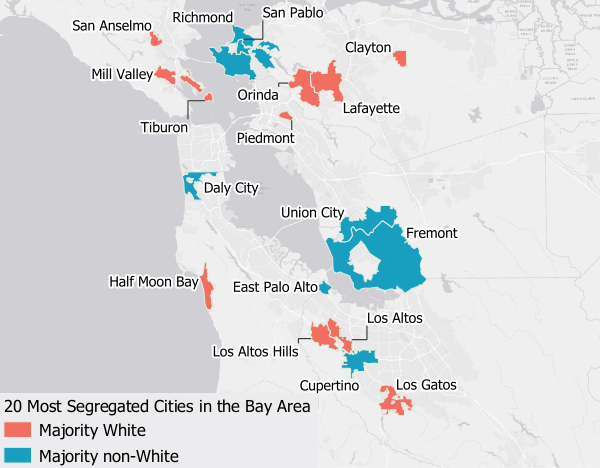
Between 2018 and 2020 we studied the nature and extent of racial residential segregation, demographic change, and harmful effects of segregation in the Bay Area. Using the recently-released 2020 Census data, we've updated these findings and lists of most segregated cities. In addition to the cities' list, this update includes for the first time rankings of the top 10 most segregated neighborhoods in the Bay Area for every major racial group.
Key Findings:
- Two of the three most segregated Black neighborhoods are in San Francisco's Bay View/Hunter's Point region
- Six of the 10 most segregated Black neighborhoods are in Oakland
- The most segregated Latino neighborhood is in San Rafael's Canal region, with the next four in Oakland
- The most segregated Asian neighborhood is around San Francisco's Chinatown, with the next three in Fremont
- The most segregated white neighborhoods are in small, sparsely populated areas like Ross, Belvedere, Mill Valley, and Los Gatos
- The most segregated (intra-municipal) city is Oakland, followed by San Rafael, San Jose, Menlo Park, Redwood City, San Francisco, Richmond, South San Francisco, Union City, and Dublin
- The most segregated (inter-municipal) city is East Palo Alto, followed by San Anselmo, Mill Valley, San Pablo, Tiburon, American Canyon, Los Gatos, Gilroy, Lafayette, and Orinda
- The most integrated (inter-municipal) cities are Rohnert Park, Windsor, Petaluma, Pinole, Suisun City, and Cloverdale
- Three counties were more segregated in 2020 than they were in 2010: Marin, Napa and Sonoma, with Marin being the most segregated county in the region by far.
- Although 7 of the 9 Bay Area counties were more segregated in 2020 than they were in either 1980 or 1990, racial residential segregation in the region appears to have peaked around the year 2000, and has generally declined since.
Click here to read the update to our study of racial segregation in the San Francisco Bay Area
National update
In June 2021 we published our “Roots of Structural Racism” project examining the persistence and harmful effects of racial residential segregation across the United States, using 2019 ACS data. We examined trends, ranked cities and metropolitan areas, and analyzed economic, political and educational correlates to segregation. This is an update to our report using 2020 Census data, which was just made available in September.
Key Findings:
- 23.6 percent of metropolitan areas were more segregated in 2020 than 2010
- 54 percent of metropolitan areas were more segregated in 2020 than in 1990
- The top 10 most segregated cities in the country are Detroit, Newark, Hialeah, Chicago, Milwaukee, Cleveland, New York City, Miami, and St. Louis
- The top 10 most segregated metropolitan regions of the country are Chicago, New York City, Milwaukee, Detroit, Trenton, Miami, Los Angeles, Cleveland, Port Arthur, and Atlanta
- The most segregated regions remain the Midwest, Mid-Atlantic, and West Coast
- The only two integrated regions remain St. Lucia, FL and Colorado Springs, CO
- The number of integrated metro regions increased from two in our last report to five. They are the regions of Chico, CA; Palm Bay-Melbourne-Titusville, FL; Jacksonville, NC; San Luis Obispo-Paso Robles, CA; and Colorado Springs, CO.
Click here to read the update to the Roots of Structural Racism report.
