


Introduction1
Long the province of sleepy municipal government meetings and planning departments, the recondite issue of zoning has taken a dramatic turn in recent years as a hotly debated and fiercely contested policy topic. Zoning ordinances hostile to density are now recognized for their role in thwarting the production of affordable housing, contributing to homelessness, and in sustaining racial and economic exclusion and segregation. Scholarly admonitions to curtail excessively restrictive zoning have penetrated broader public consciousness, and a handful of local governments have taken steps to loosen their zoning ordinances at the same time that a number of states have considered or adopted legislation overriding elements of local zoning laws.
Oregon, for example, passed a law prohibiting single-family only zoning in cities of 10,000 or more people. More recently, California enacted a measure in 2021 (SB 9), which allows homeowners in some areas to divide their property into two lots or build a duplex. Although the press has frequently described this law as “the end of single family zoning” in California, such headlines are inaccurate and misleading. Laws like SB 9 do not actually amend or modify local zoning ordinances. They simply abridge or override them in certain circumstances. Nonetheless, these pioneering efforts are inspiring others to tackle the problem, and we can expect more state and local governments to follow suit.
With this report, we hope to continue to contribute to the public debate regarding the necessity of zoning reform. This report examines the extent, correlates, and harmful effects of restrictive zoning in the Greater Los Angeles (SCAG) region. This region includes six counties (Imperial, Los Angeles, Orange, Riverside, San Bernardino, and Ventura), 191 local governments, and nearly 20 million people, the largest region governed by a metropolitan planning organization in the nation, and one of the most diverse as well.
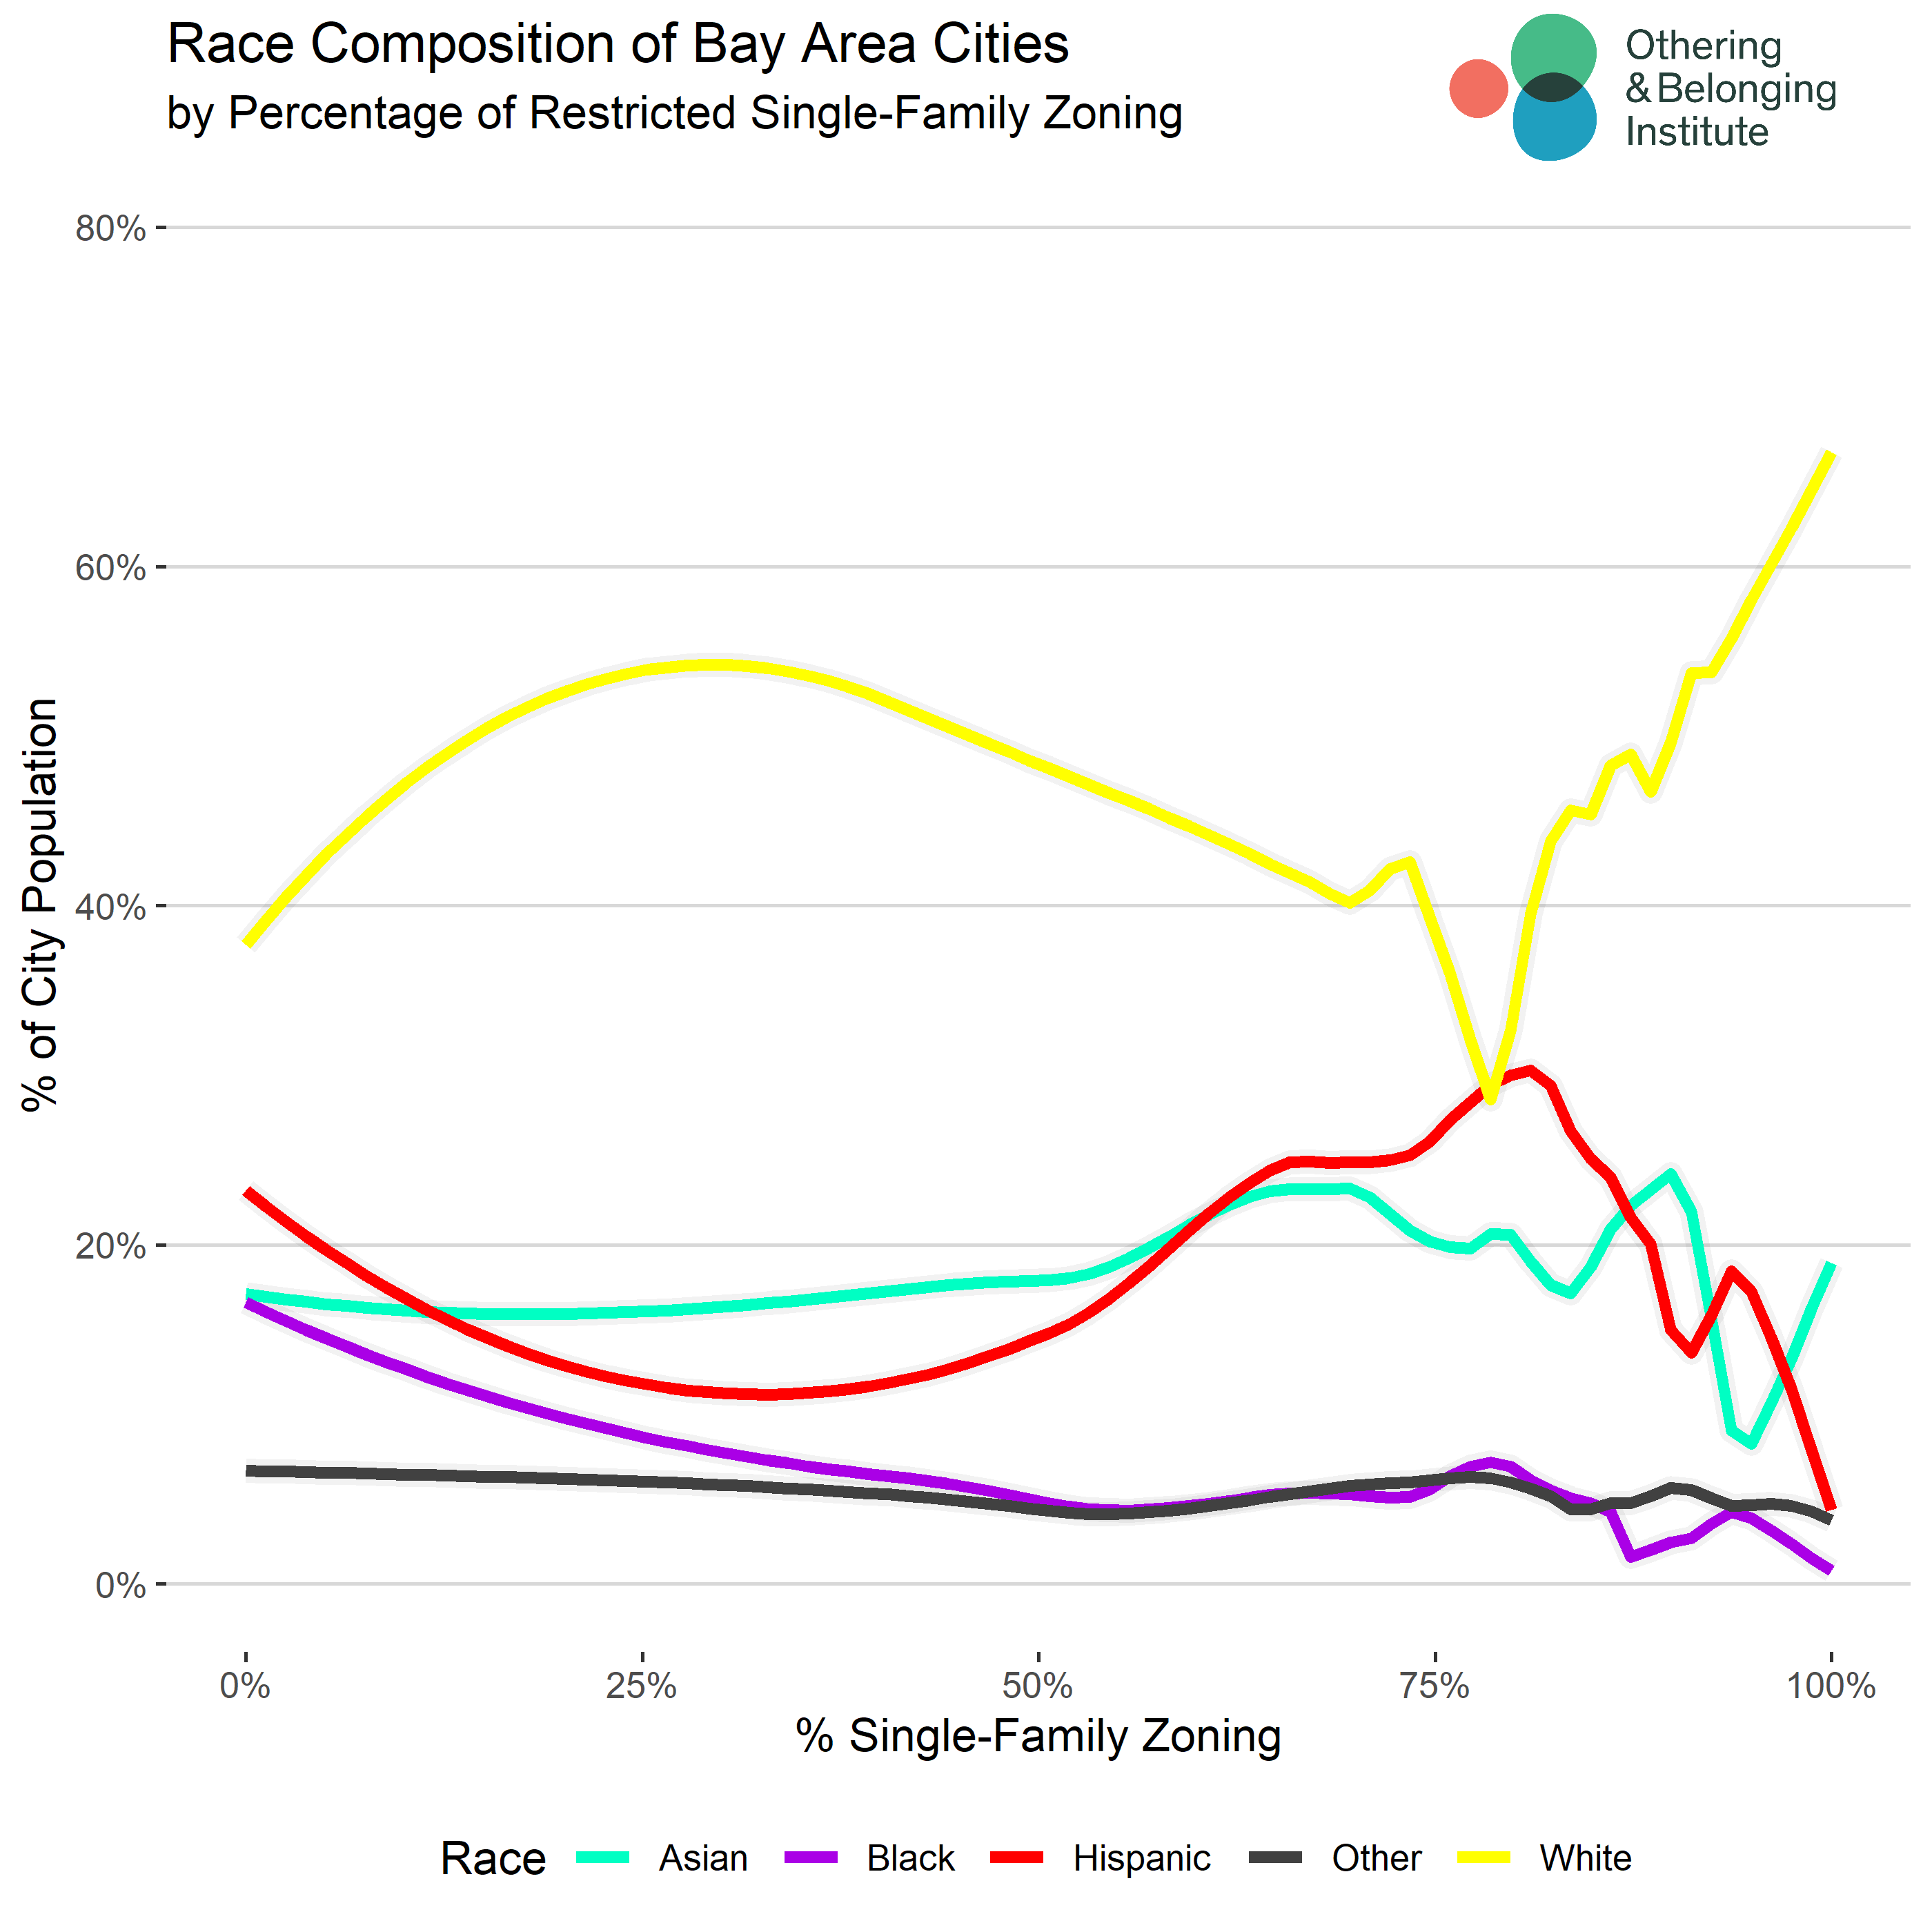
This report builds on prior research we published in 2020 examining the problem and extent of restrictive zoning in the San Francisco Bay Area. As part of a larger investigation of racial residential segregation in the nine-county Bay Area, we systematically coded and then analyzed the relationship between racial residential segregation and the degree of restrictive zoning, specifically single-family-only zoning as a percentage of residential land, for 86 local governments in the Bay Area.2
Municipalities with the highest percentage of single-family-only zoned residential areas had the highest percentage of white residents and the lowest percentage of Black and Latino residents.
In particular, we created static thumbnail maps for each of those local jurisdictions, and calculated the percentage of single-family-only zoned land relative to all residential land in that city or town. We also rolled up this work into an interactive regional zoning map, with a drop-down menu from which users may select the municipal government they wish to examine or compare with another. The end result was one of the first comprehensive regional zoning maps in the country.3 Our Bay Area zoning Github page shares all the parcel level data we collected for the region, and allows researchers to access this for their own purposes.
Consistent with prior research, which we summarized in our report, we found a disturbing relationship between the degree of single-family zoning, racial demographics, and racial segregation. In particular, we found that restrictive zoning had a strong exclusionary effect. We found, for example, that municipalities with the highest percentage of single-family-only zoned residential areas had the highest percentage of white residents and the lowest percentage of Black and Latino residents. We also found that the highest observed levels of racial residential segregation occurred in the communities with the highest proportion of single-family zoning.
Due to the popularity of our report and the considerable time and labor already undertaken to build our repository of maps, we decided to expand our analysis beyond racial demographics and racial segregation. A few months later, we released a more extensive report focused entirely on single-family-only zoning and presenting a wider range of findings, including the relationship between zoning and educational attainment, community resources, economic mobility, and environmental health and hazards (see Figures 4-8 in that report). Using three basic criteria (percentage of single-family-only zoning, level of opportunity, and distance from a central business district) we also identified 13 municipalities in the Bay Area which we concluded were the most in need of zoning reform (see Table 3).4
This report presents a similar analysis for the SCAG region, based upon original research which we present here for the first time. In this report, we present our findings about the extent of single-family-only zoning in the region, examine the observed relationship between zoning and racial demographics and racial segregation, as well as a larger range of associated outcomes, including educational attainment, community resources, economic mobility, and environmental health and health hazards. Although our overall findings are largely consistent with the dynamics of zoning in the Bay Area, we find a number of other shocking nuances that sharpen our understanding of the problem of excessively restrictive zoning.
Overall, our findings are entirely consistent with, and appear to provide further empirical support for, the theory that restrictive zoning is a mechanism of opportunity hoarding, the channeling of critical resources and amenities into some communities and the denial of those assets and resources to other communities. As we will show, this has an apparently profound effect on the life chances of people of color and children from low-income families in the SCAG region.
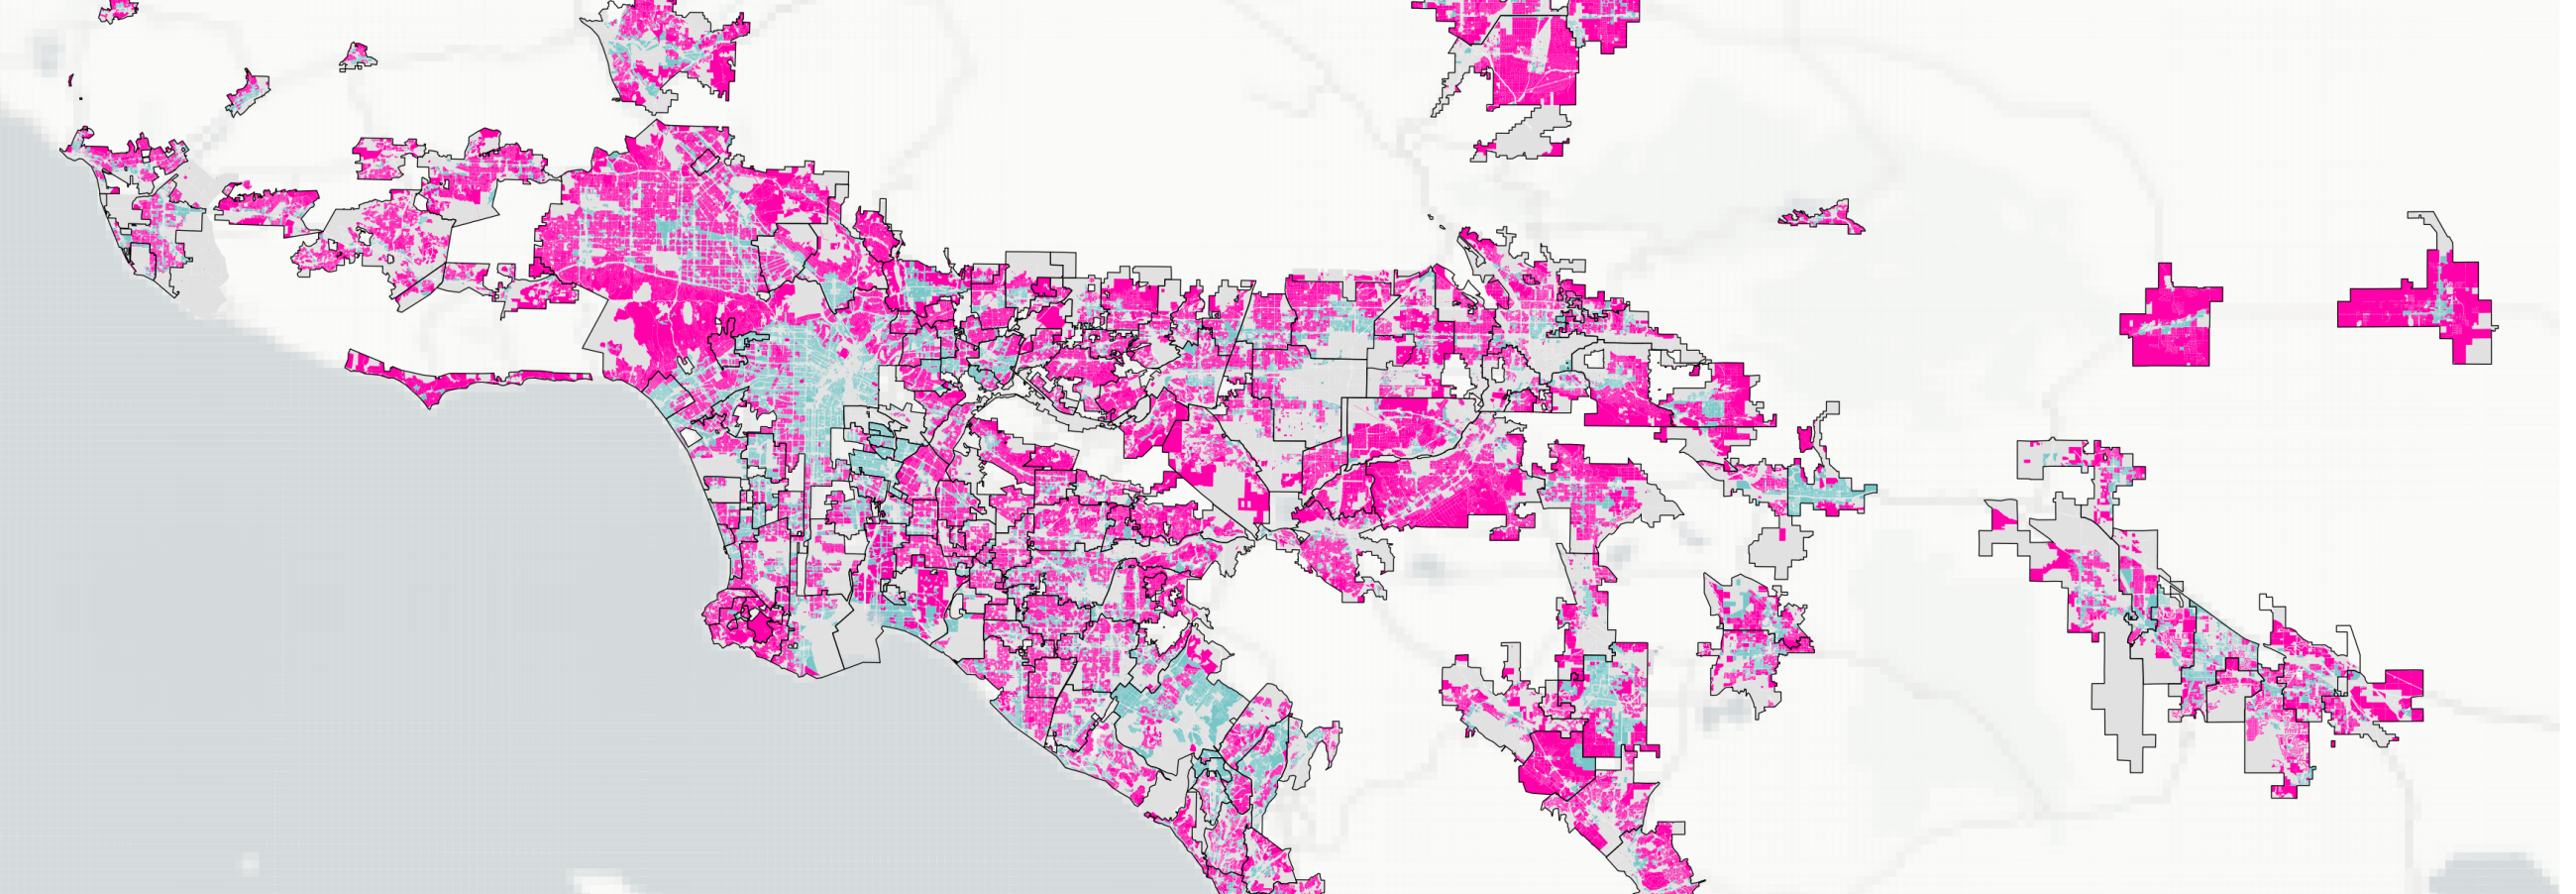
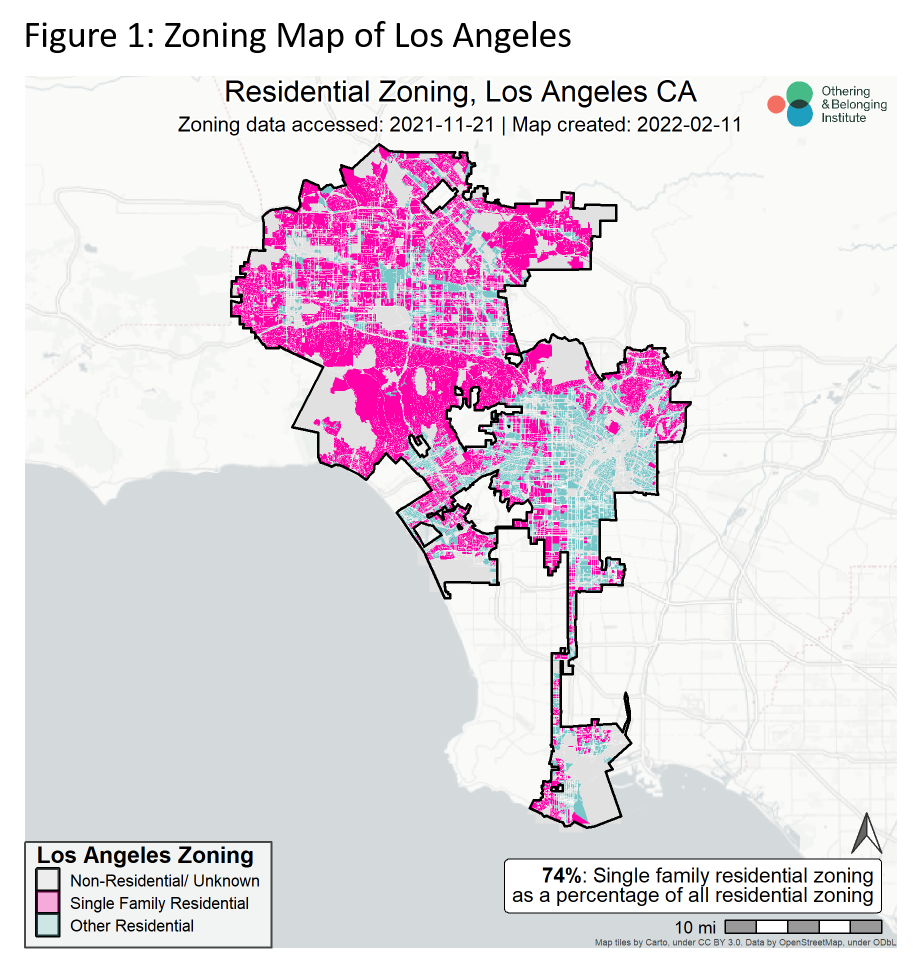
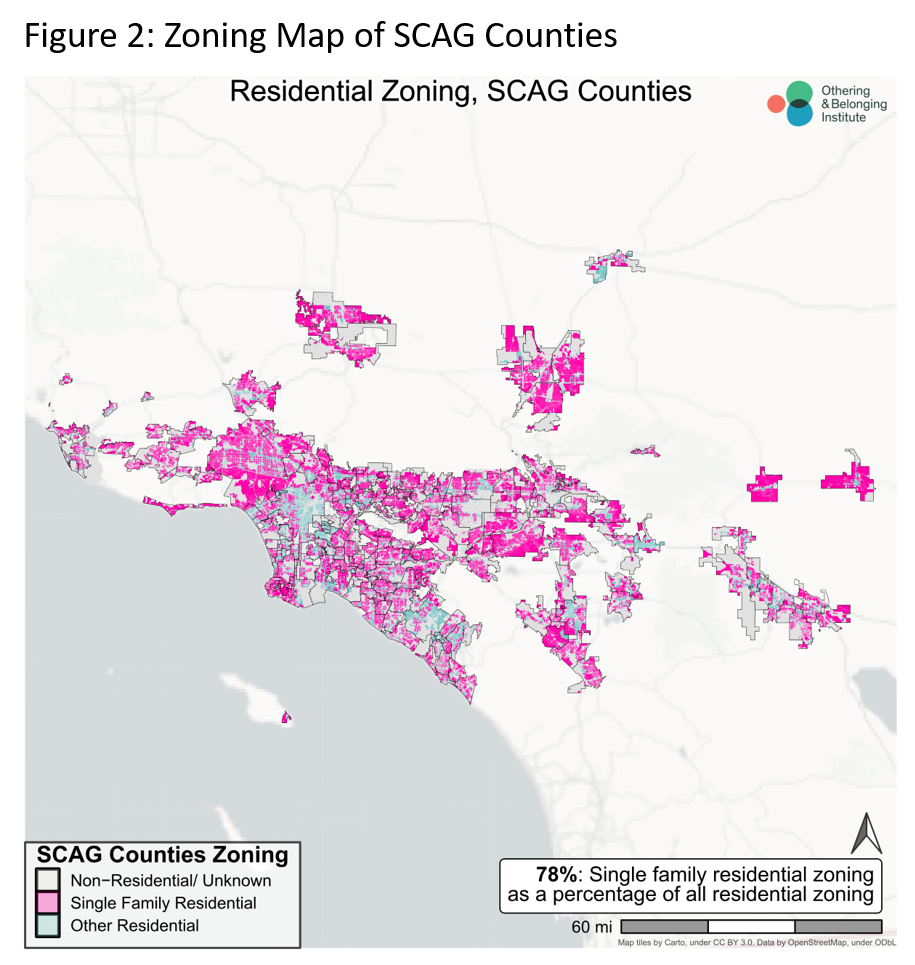
Accompanying this report is a similar repository of 191 static maps for the SCAG region, one map for each municipality with zoning ordinances in the region. It also includes one zoning map of each of the six examined counties. Each map illustrates the extent of single-family-only residential zoning, multi-family and mixed-use residential zoning, and non-residential zoning by area. It also indicates the percentage of single-family zoning relative to all residentially zoned areas, as well as the date upon which the underlying zoning ordinance was accessed and the date the map was created. See Figure 1, as an example, of the City of Los Angeles.
We have shared all the parcel-level data for each city with its original zoning code as well as OBI’s simplified zoning categories in a Github repository for researchers to download for the purpose of conducting their own analyses.
We conclude our report by identifying the municipalities in the SCAG region that appear to be most in need of zoning reform, using a similar analysis to the one we employed in our Bay Area report. Specifically, we examine the percentage of single-family-only zoning in the jurisdiction, the distance of the jurisdiction from the central business district, performance on Regional Housing Need Assessment compliance, and the percentage of the jurisdiction that is designated by the Tax Credit Allocation Committee as “high opportunity.”5 These criteria yield a list of 13 municipalities we believe are most in need of zoning reform.
Over the next year or so, we will be releasing similar reports on a periodic basis for other regions of California until we have created a statewide database of zoning in California. Therefore, consider this the second in a series, following our Bay Area report.
Methodology & Challenges
There are many daunting research challenges to studying municipal zoning. Foremost among them are the lack of consistent classifications or base formulae for zoning designations from which they may be derived. Zoning codes are generally dense, technical, and difficult to access. While there may be strong similarities in zoning taxonomies across jurisdictions with land use authorities, the particulars of each zoning code are often idiosyncratic to the jurisdiction. Certain designations may mean different things in different jurisdictions. This means that efforts to study regional zoning patterns require either imprecise shortcuts or tedious and time-intensive effort.
The most common and widely relied upon shortcut is the use of survey instruments (e.g. the Wharton Regulatory Land Use Index). We summarized notable zoning surveys, going back to the 1970s, and their respective strengths and limitations, in our Bay Area report.6 Although there are a number of other proposed methodological shortcuts, including restricting analysis to a sample of cities, using American Community Survey samplings of housing units within cities, or drawing inferences about zoned density from property tax records, the vast majority of research conducted on this issue relies upon these survey instruments.7
While these surveys may be generally useful, there is evidence to suggest that their results contain systematic errors, partly due to the inaccurate perception of the survey respondents.8 These surveys also suffer from lack of reliability, since, in many cases, respondents fail to complete the survey, creating holes in the datasets.9 These instruments are also limited, and tend to focus on the largest jurisdictions, meaning that smaller municipalities are less likely to be included. This may be another source of systematic bias in such data, since smaller municipalities may have a greater share of restrictive zoning.
Another challenge in studying zoning is that zoning ordinances and codes do not necessarily indicate actual zoning, especially for planned developments. Planned development is typically a designation that allows for more flexible or dynamic zoning and land use, where planners anticipate or intend future development. The intended use for such parcels may not be defined in the municipal zoning code, meaning that it has to be observed directly.10
Our research is focused on better understanding how zoning designations themselves shape or correlate with certain community characteristics and life outcomes.
A related problem is that zoning codes do not always reflect the built environment, and vice versa. This is probably the single biggest source of confusion regarding our zoning maps, as evidenced from inquiries we have received about them. Our maps and analysis are of zoning, not the built environment. While the actual built environment may be the most relevant piece of information for some purposes (such as researchers or policymakers who are primarily concerned with the production of housing), our research is focused on better understanding how zoning designations themselves shape or correlate with certain community characteristics and life outcomes.
So-called “non-conforming uses,” which create a divergence between the built environment and zoning laws, exist for many reasons. Some developments, especially older ones, may have been constructed before zoning codes were adopted or prior to a down-zoning of the neighborhood to prevent new, higher density developments. Developers of more recent developments may petition for, and receive, a “spot variance,” which is permission to build at a higher density or taller than what is permitted by ordinance. Certain state laws, like density bonus laws, may similarly create override mechanisms that generate non-conforming structures. One cannot easily scan an environment and accurately infer a zoning designation.
Because we are specifically interested in the effects and/or correlates of restrictive zoning itself, and most of the zoning codes were idiosyncratic across municipalities, for purposes of this report, we simplified zoning designations into three broad categories: Single Family Residential, Other Residential, and Non-Residential/Unknown, defined as follows:
- Single Family Residential is land designated for detached, single-family residential land use (one or two dwelling units per parcel of land) in both low and high density. This includes single-family homes and two-family detached dwellings, and usually includes single-family zones, low-density zones, agriculture zones (if single-family homes are permitted) or estate zones.
- Other Residential includes both multi-family residential and mixed-use residential.
- Multi-family residential is land designated to allow for multiple dwelling units per parcel of land. This includes apartment buildings, duplexes, triplex, fourplex, townhouses, condos, mobile home parks, and two-family attached dwellings.
- Mixed-Use Residential is land designated to blend multiple uses that includes residential use. This includes mixed-use commercial zones permitting residential use, zones allowing multi-family buildings with commercial spaces (e.g., on the group floor), and zones where residential use and other non-residential uses such as commercial or industrial uses are both permitted.11
- Non-Residential is land that is designated for non-residential uses. This includes parks and open space, commercial, industrial, and public land. Non-developable land was removed from the overall land area, including water, waterways, marshland, and highways or streets.
Municipal zoning code documents are the primary source to identify each zoning category for each city, describe the purpose of each, and list what is permitted to be built in each of these zones. We utilized these documents for each city to recode each zone into the typology listed above.
We accessed parcel-level zoning data primarily from the repository of shapefiles collected and shared by SCAG.12 We applied our classification of simplified zoning categories to the zones found in the zoning shapefile for each city. We also checked if a more recent update to the zoning shapefile was available from the website of the department responsible for zoning in the city before using the available shapefiles from SCAG. In the absence of a zoning shapefile for a particular city either from the SCAG repository or the city planning/GIS department, we searched for these shapefiles from ESRI’s ArcGIS Hub and other online sources.13
Once we obtained the zoning shapefile, we created a list of all zoning codes available within the shapefile. We used the description of each zone in the municipal code document, and re-coded each of those to one of the three categories listed above. We then applied our simplified typology to each of the parcels in the shapefile. We mapped the data to display this typology. A more detailed description of our methodology is presented in the appendix to this report.
We realize that our simplified taxonomy of myriad zoning designations into three categories (in order to draw out the degree to which single-family-only zoning predominates residential areas) conceals many other aspects of zoning codes that impede or restrict development or certain types of developments. For example, height limitations, setback requirements, discretionary reviews, parking requirements and the like can all inhibit density, even in multi-family residential or mixed-use zones. For that reason, in constructing this tranche of maps, we have separately created a database of additional zoning characteristics for each jurisdiction, which we will release at a future point in completing a statewide “zoning atlas” for California.14 Until then, our focus is on single-family-only residential zoning as the principal form of restrictive and exclusionary zoning.
Overview of Single-Family Zoning in SCAG Region
We find that single-family-only zoning is a predominant form of zoning within the SCAG region, especially within residential areas. Specifically, we find that 77.70 percent of residential land in Greater LA is exclusively reserved for single-family housing (See Figure 2 below). From a cross-sectional view of local jurisdictions rather than a regional view, we find that, on average, about 72 percent of residential land is restricted to single-family homes only, with a median of about 78 percent.15 The average amount of total land (including commercial areas and parks) exclusively reserved for single-family housing was 40.67 percent.16 In contrast, we also find that only 11.80 percent of total land is available for multi-family developments. Zoning ordinances throughout the greater LA region are exceptionally hostile to density.
These findings are not out of line with other regional assessments. Our initial analysis of the San Francisco Bay Area found that 82 percent of all residential land was zoned for single-family-only dwellings. When we extended our analysis to include jurisdictions with fewer than 10,000 people, that figure rose to 85 percent. That analysis found that the average amount of residential land in each city is 81 percent, with a median of 86 percent. Although the Bay Area has more single-family zoning than the SCAG region, it also has more land zoned residential as well.
To use an example from outside California, a report by the Twin Cities’ Star Tribune found that 73 percent of residential land in the Twin Cities (104 jurisdictions) is governed by local zoning ordinances that only allow single-family detached homes. Similarly, a statewide analysis of Connecticut (including over 2,600 jurisdictions) found that 70 percent of residential land was zoned exclusively for single-family-only dwellings.17 These results are strikingly similar to our findings here, although the SCAG region encompasses just 191 jurisdictions with zoning ordinances.
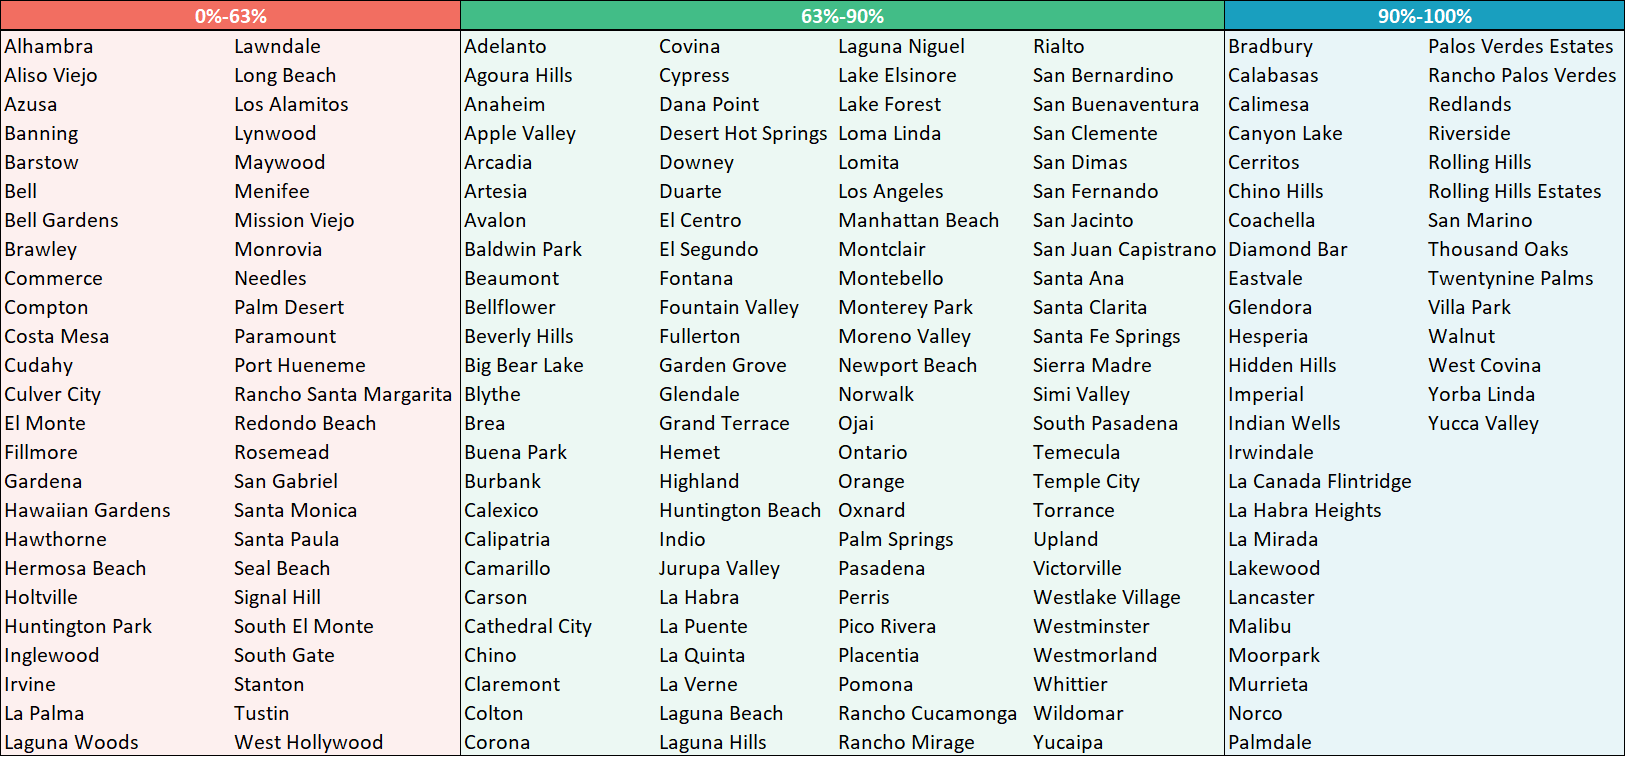
Table 1 below presents each jurisdiction in the SCAG region by its percentage of single-family-only zoning, broken into three categories: 0-63 percent (low to moderate), 63-90 percent (high), and 91-100 percent (very high).18 We will use that delineation for our analysis in the next two sections of this report.
Table 1: Local Jurisdictions by Percent of Single-Family Only Zoning
Single-Family Zoning and Race
In this part of our report, we present findings regarding the observed relationship between single-family zoning and race, including racial demographics and levels of racial residential segregation, for the SCAG region.
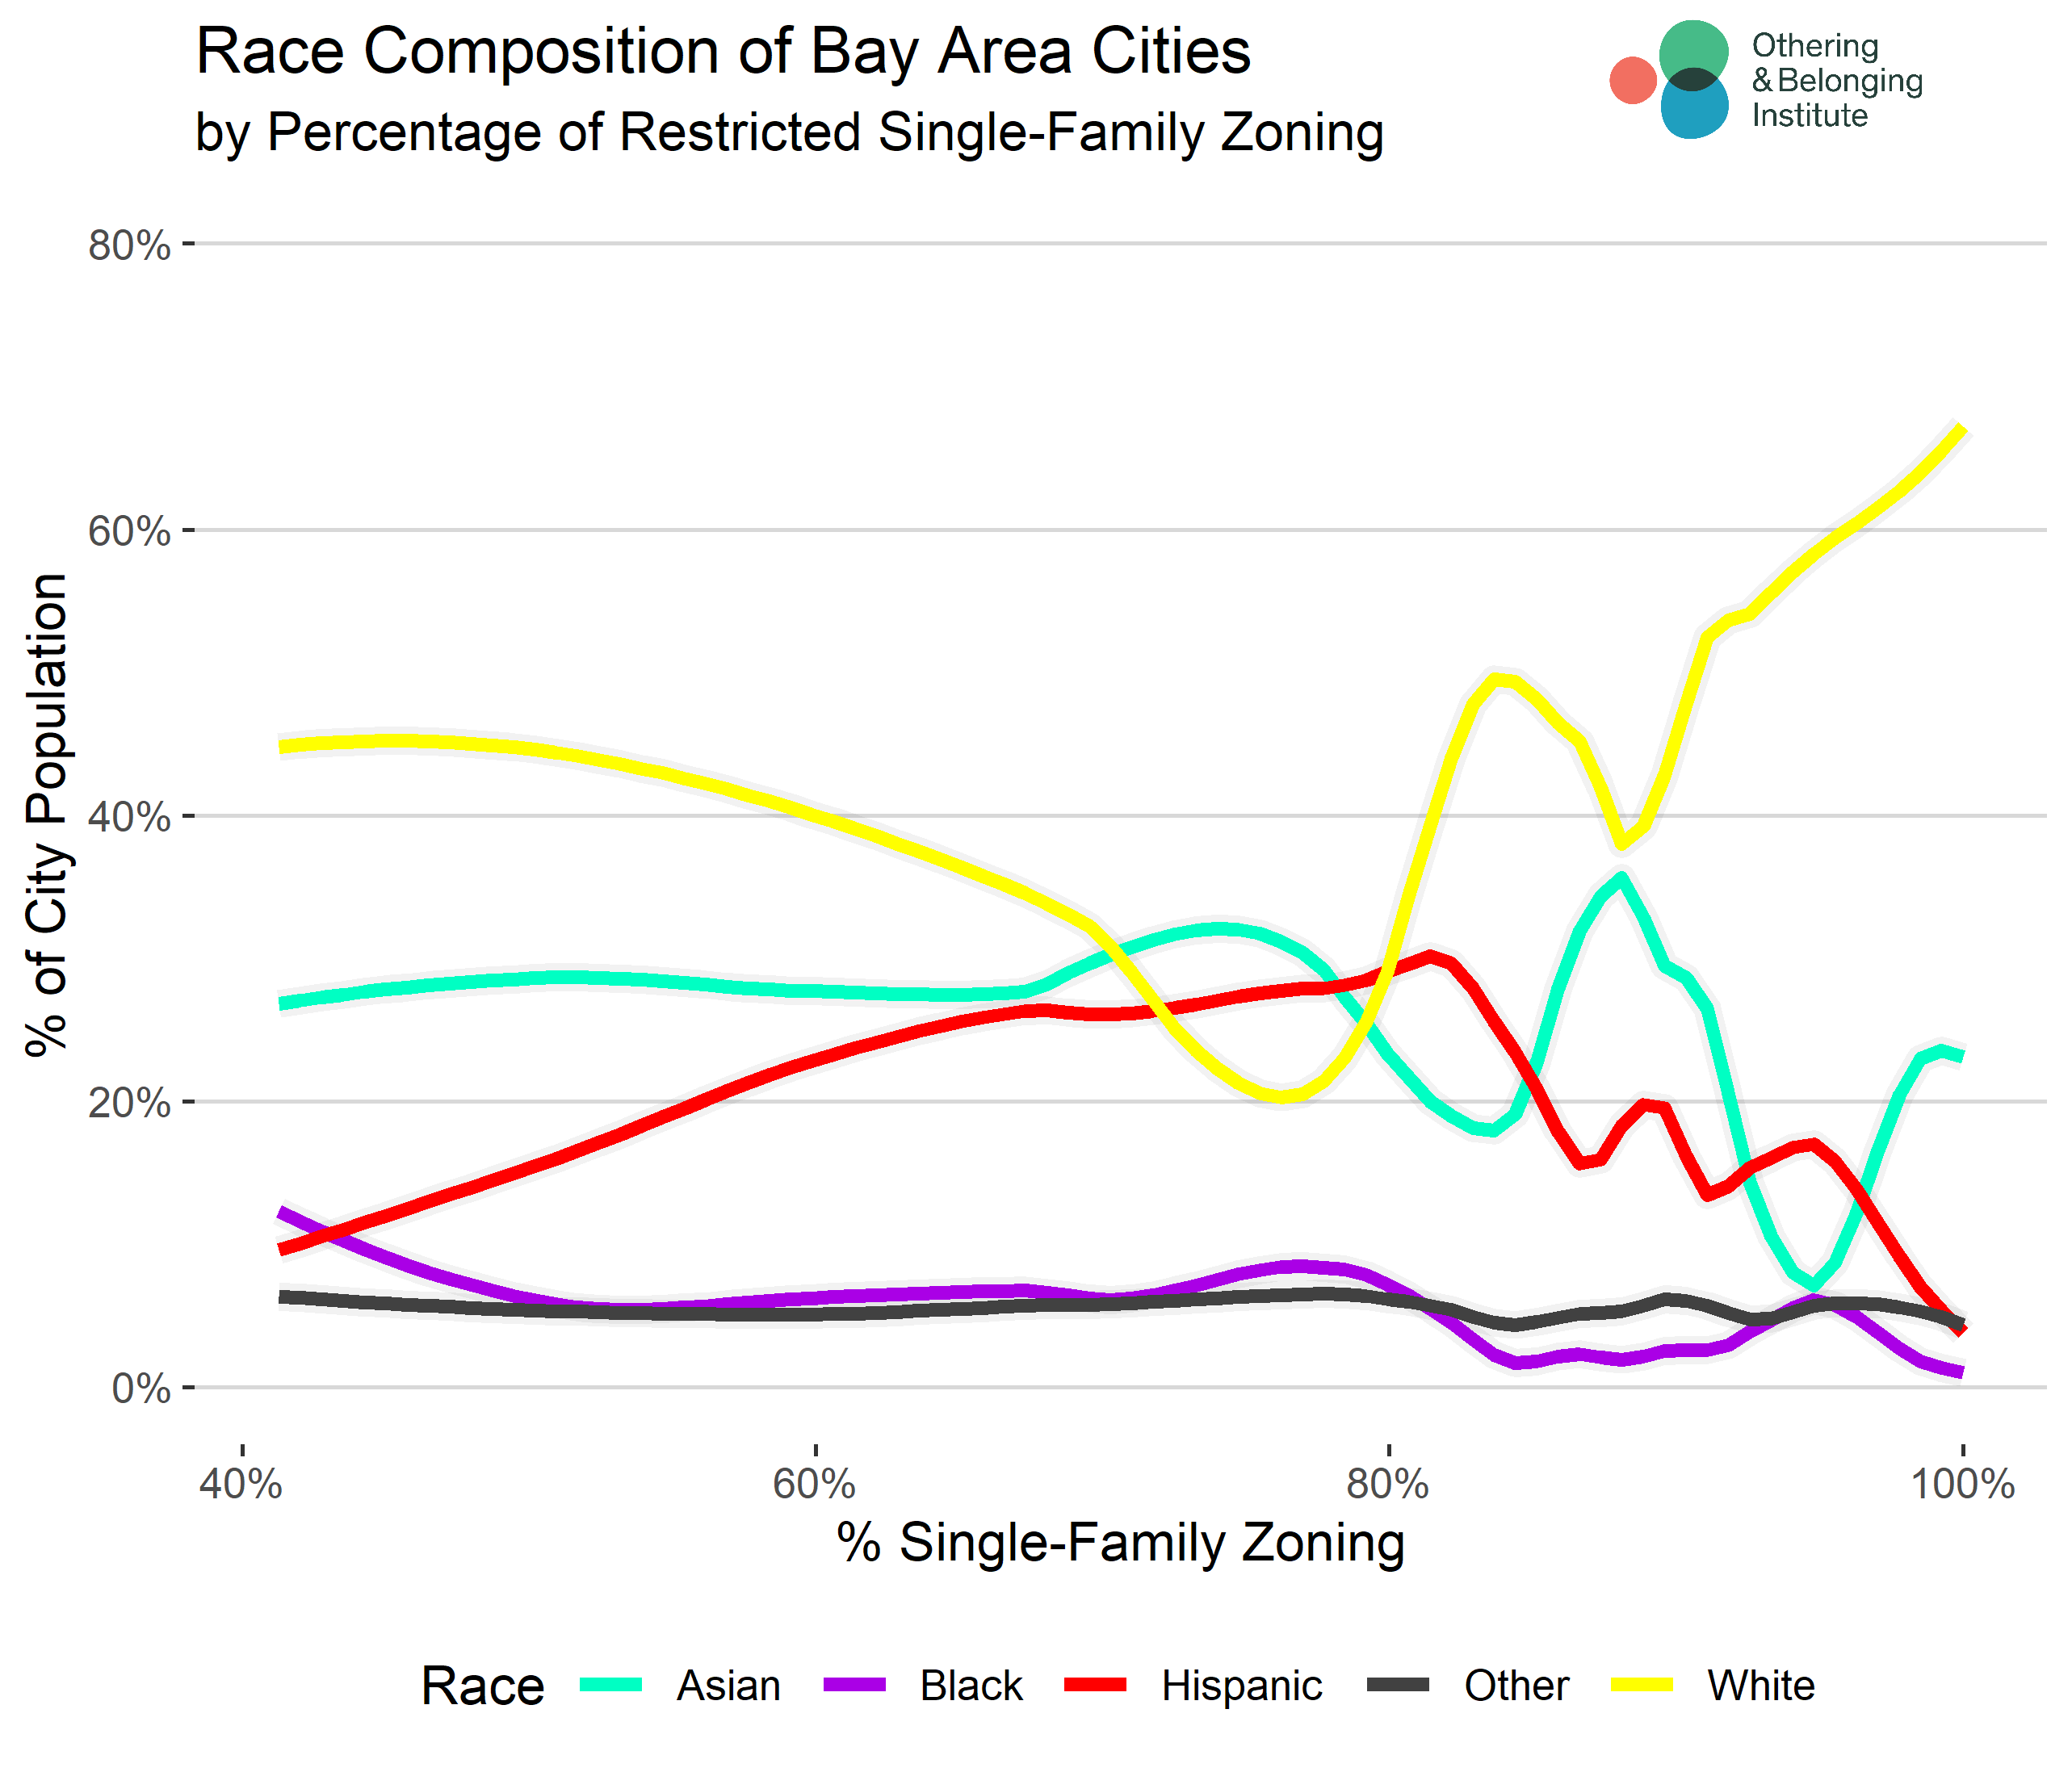
Unsurprisingly, we find a striking relationship between jurisdictions with an extremely high degree of single-family-only zoned residential areas and the racial composition of those communities. Figure 3 below shows the percentage of each racial group represented in each community based upon the percentage of single-family-only zoning as a portion of residential land along with a dashed line to show the SCAG regional average for all cities. What Figure 3 specifically illustrates is that Latinos are most heavily represented in jurisdictions with the smallest percentage of single-family-only zoning, and decline sharply as the percentage of single-family-only zoning exceeds 80 percent of all residential land, declining further as that percentage approaches 100.
Conversely, the percentage of white residents per jurisdiction rises steadily (with the exception of a small downturn in the middle range) as the percentage of single-family-only zoning increases, and rises sharply as the percentage of single-family-only zoned residential land exceeds the upper eighties.
This pattern confirms that, for the SCAG region, single-family-only zoning has a racially exclusionary appearance: the more single-family-only zoning, the whiter the jurisdiction and the proportion of Latinos declines relative to the regional population.
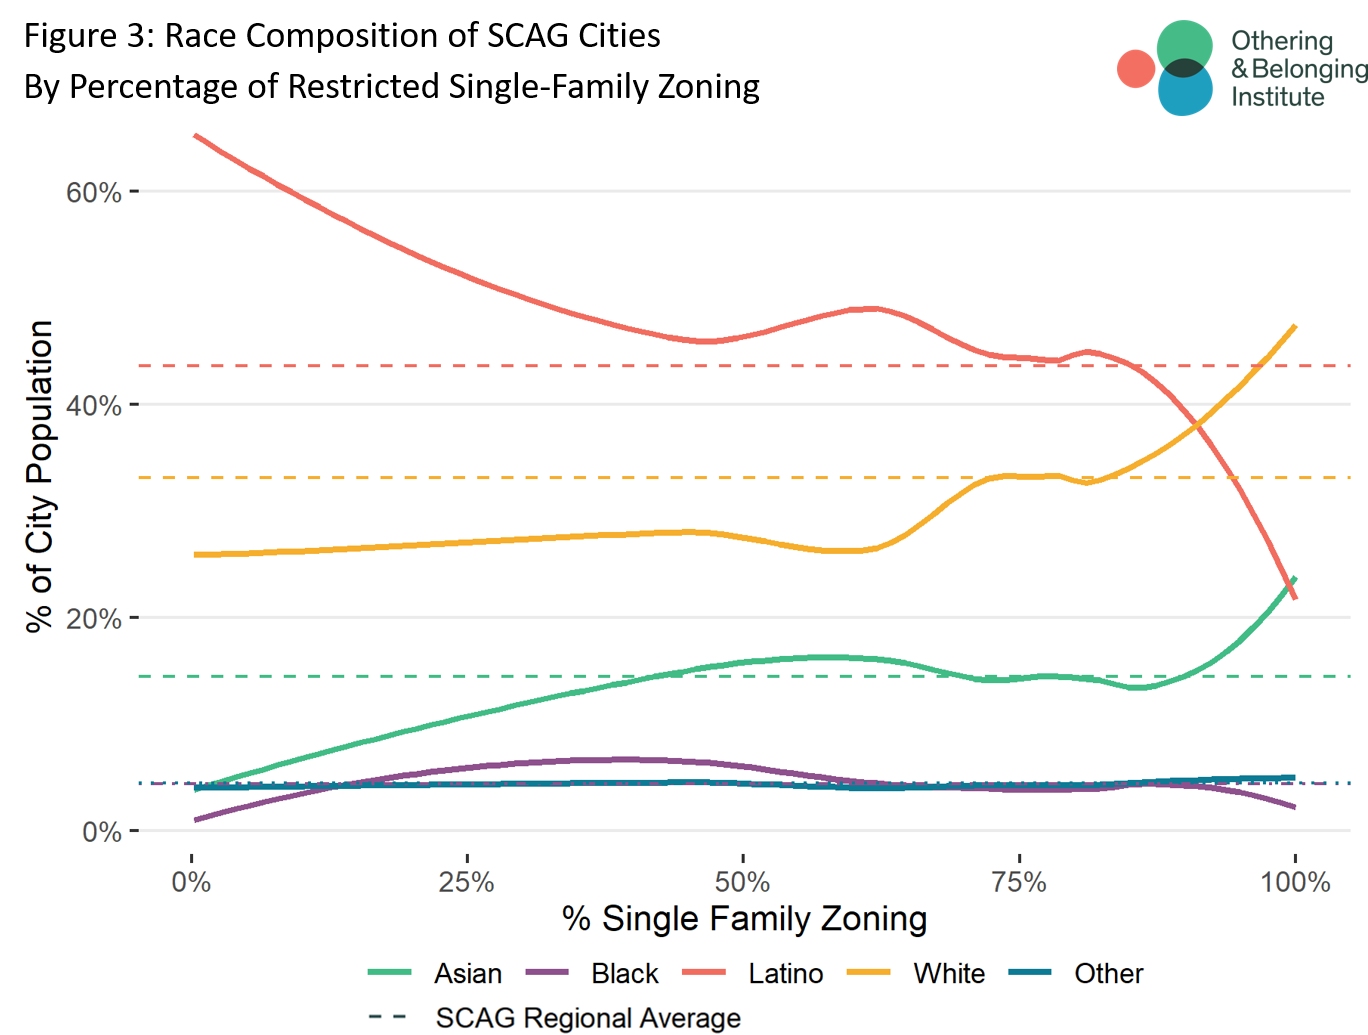
It should be noted, however, that the percentage of Black residents does not appear to follow as stark a pattern as was observed in the San Francisco Bay Area, although there is a noticeable decline. Another notable difference from our Bay Area report is that the proportion of Asian residents rises even more sharply as the percentage of single-family-only zoning increases than that of white residents, although the percentage white starts at a higher overall level.
Table 2 below indicates the racial breakdown and level of segregation according to three groupings of jurisdictions by their extent of single-family-only zoning.
Table 2: Race and Single-Family Zoning by Jurisdiction
| % Single-Family Only | 0%-63% | 63%-90% | 90%-100% | All |
| Divergence from Metro | 0.321 | 0.185 | 0.261 | 0.236 |
| % Asian | 13.64%19 | 13.34% | 18.93% | 14.49% |
| % Black | 5.21% | 4.20% | 3.55% | 4.36% |
| % Hispanic | 50.40% | 44.51% | 30.99% | 43.58% |
| % White | 26.51% | 33.59% | 41.61% | 33.13% |
| Number of Jurisdictions | 50 | 100 | 39 | 19120 |
Table 2 not only denotes significant differences in racial composition and demographics among these three categories of jurisdictions based on their relative proportion of single-family-only zoning, but it also shows differences in the level of observed racial residential segregation. Specifically, it indicates that cities with a low to moderate or very high percentage of single-family-only zoning diverge more from the region as a whole in terms of their racial proportions, suggesting a higher degree of inter-municipal racial residential segregation in these communities.21
Single-Family Zoning and Other Community Characteristics
In this section, we present a number of important findings regarding the characteristics of jurisdictions, including household income,22 home value,23 educational attainment,24 educational performance,25 and environmental health,26 in relation to their percentage of single-family-only zoned areas.
Single-Family Zoning and Household Income
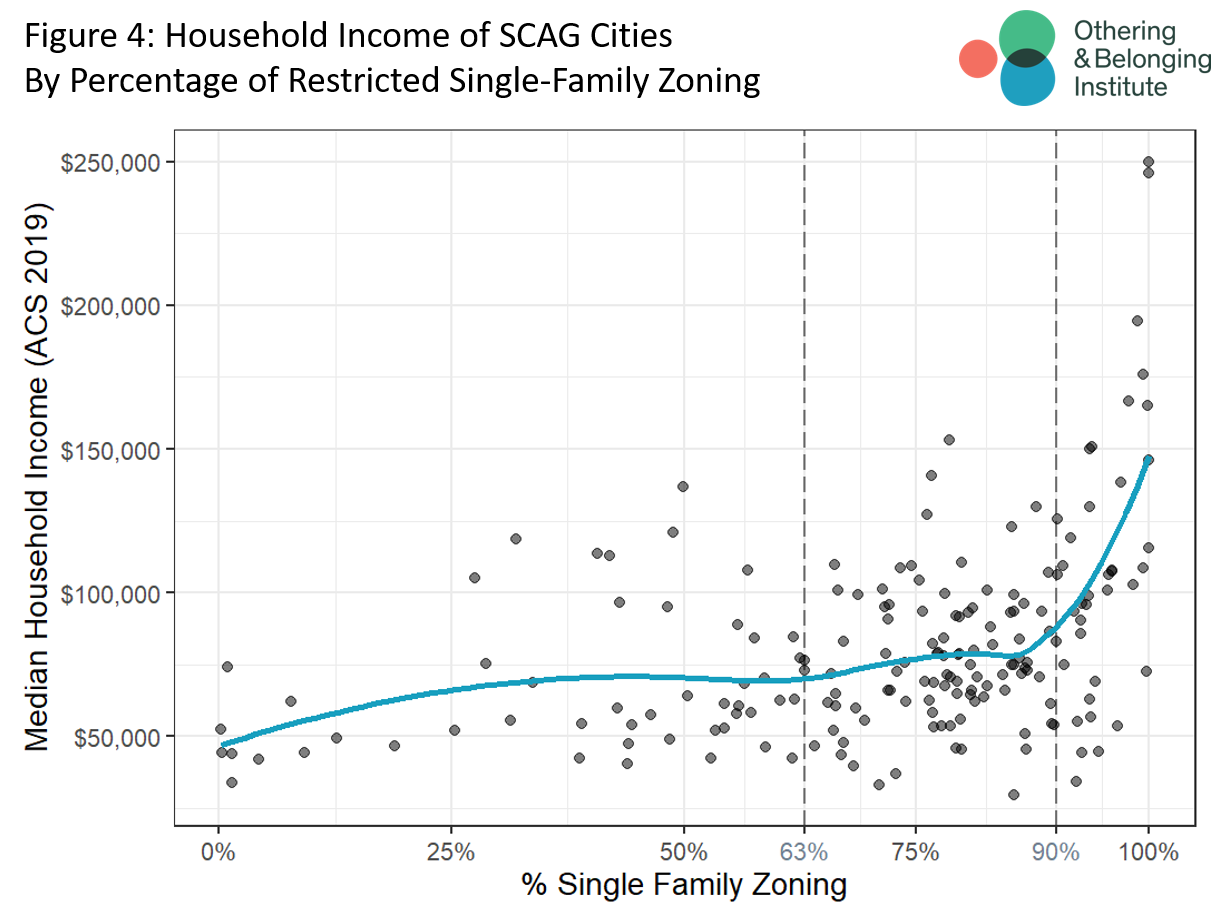
First, we find a direct relationship (a positive correlation) between median household income and the percentage of single-family-only zoning by jurisdiction.27 Household incomes increase as the percentage of single-family-only zoning rises. We interpret this pattern to support the supposition that this type of zoning has an economically exclusionary effect, making residential property more expensive so that lower-income people are unable to afford to live in such jurisdictions. Figure 4, below, illustrates this relationship.
Single-Family Zoning and Home Values
Second, we find a similar relationship between the percentage of single-family-only zoned areas per jurisdiction and median home values. Figure 5 below illustrates this dynamic. Even more than the relationship between zoning and household income, this relationship suggests that restrictive zoning plays a role in making housing more expensive.28
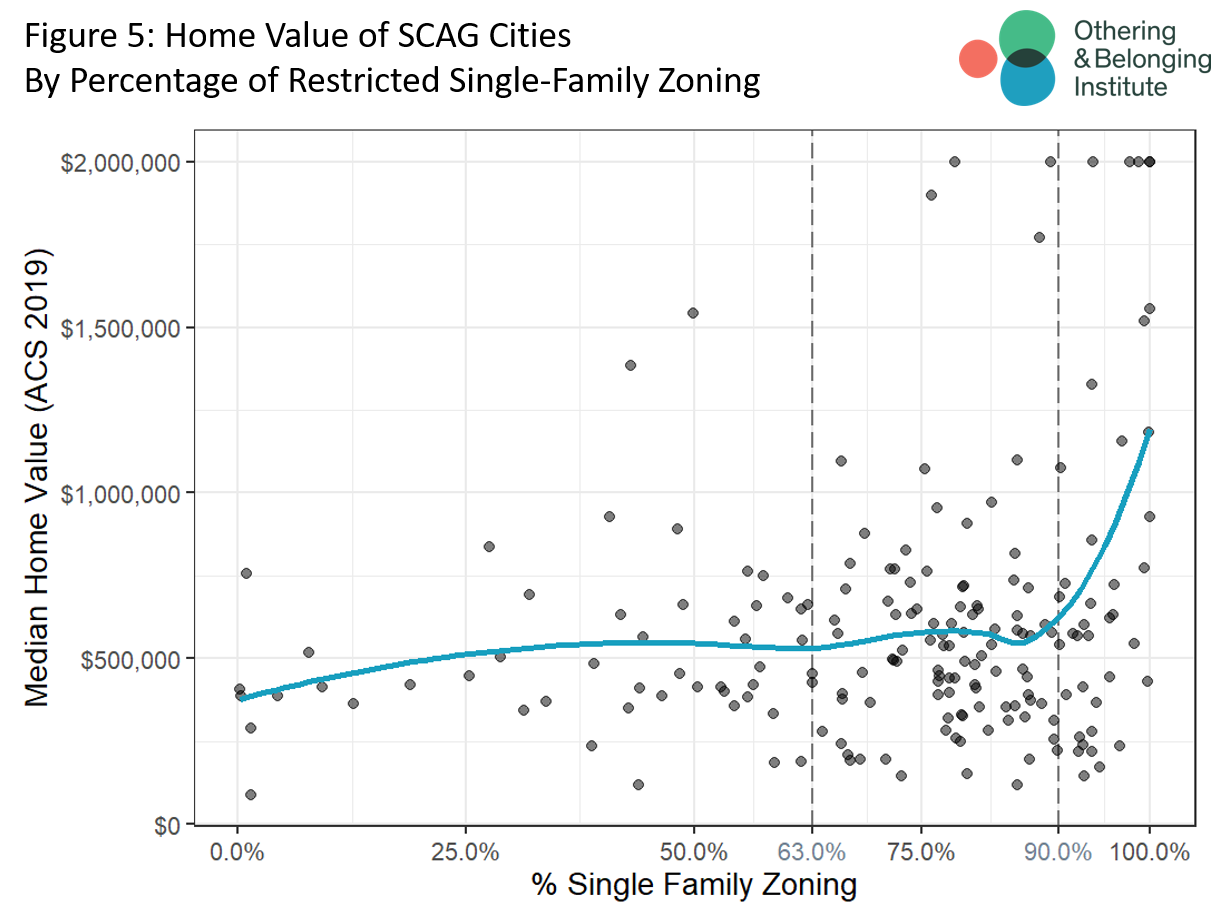
Although this data may be skewed by the extraordinarily high housing prices in California, it is notable that the average of median home values are more than twice as great in jurisdictions with more than 90 percent single-family-only residentially zoned areas ($811,492) compared to those with less than 10 percent ($405,875).
Single-Family Zoning and Educational Outcomes
In the San Francisco Bay Area, we found that single-family zoning appeared to contribute to the sorting of people by educational attainment, which helps explain the sorting by income and wealth (as measured by housing prices) as well. We find similar results here. Figure 6, below, shows the relationship between the percentage of single-family-only zoning and high school graduation rates, test scores, and the percentage of residents with a college degree.
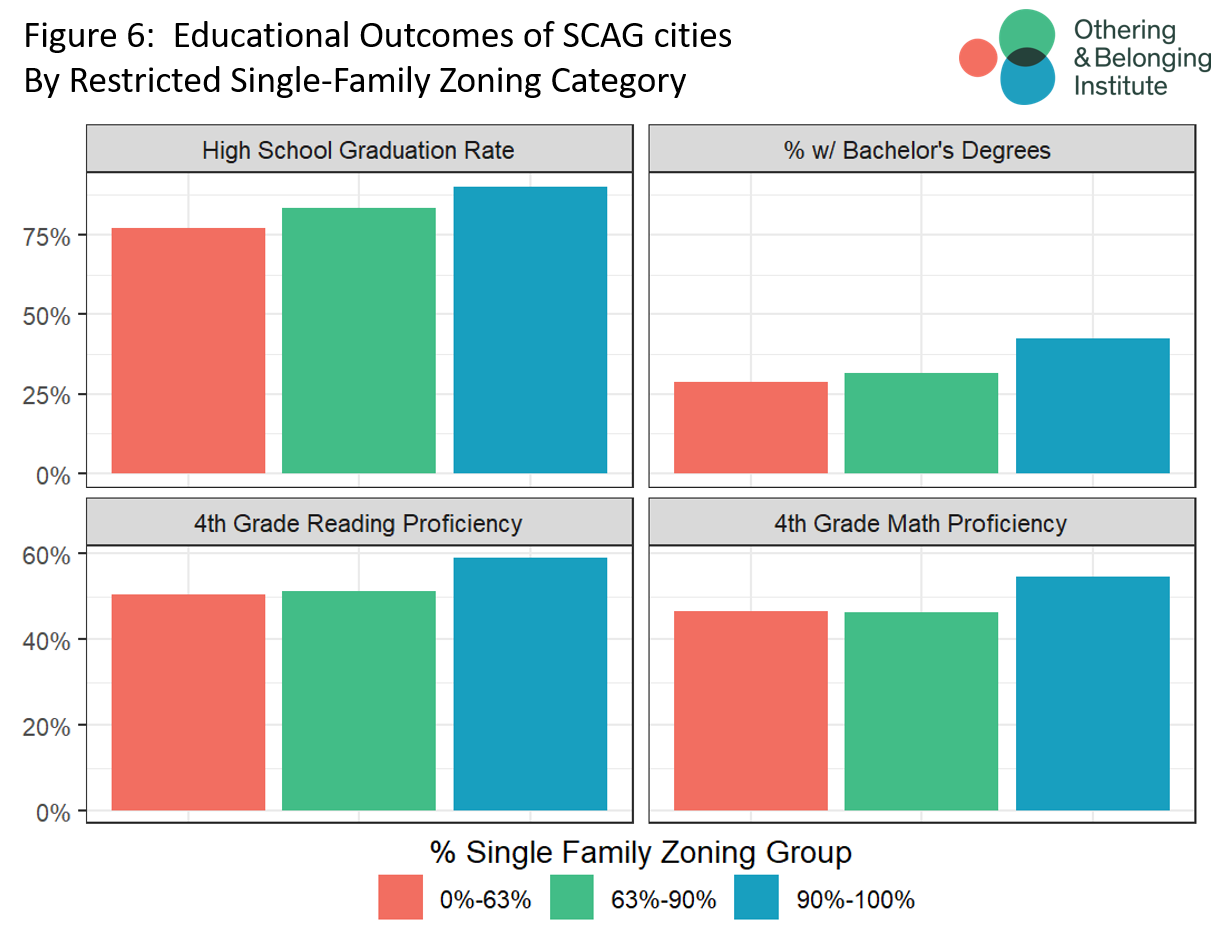
As above, this shows a class formulation, with jurisdictions with more restrictive zoning having higher rates of high school graduation and a greater concentration of college graduates as well as higher proficiency scores. Since this analysis is based on a population mean (and not a statistical sample), we can be confident that the differences in performance relative to the percentage of single-family-only zoning displayed here is accurately represented.
Single-Family Zoning and Environmental Health
Zoning does not just contribute to the sorting of people by class, educational attainment and race, but it also appears to shape the quality of the environment. To the extent that zoning is used to hoard or channel resources, it makes sense that environmental conditions would vary with the extent of single-family-only zoning and other restrictive land use regulations
CalEnviroScreen is a mapping tool that “helps identify California communities that are most affected by many sources of pollution, and where people are often especially vulnerable to pollution’s effects.” Figure 7, below, uses indicators from CalEnviroScreen 4.0 (as well as the instrument itself) to show how certain environmental conditions change as the degree of single-family zoning changes.29
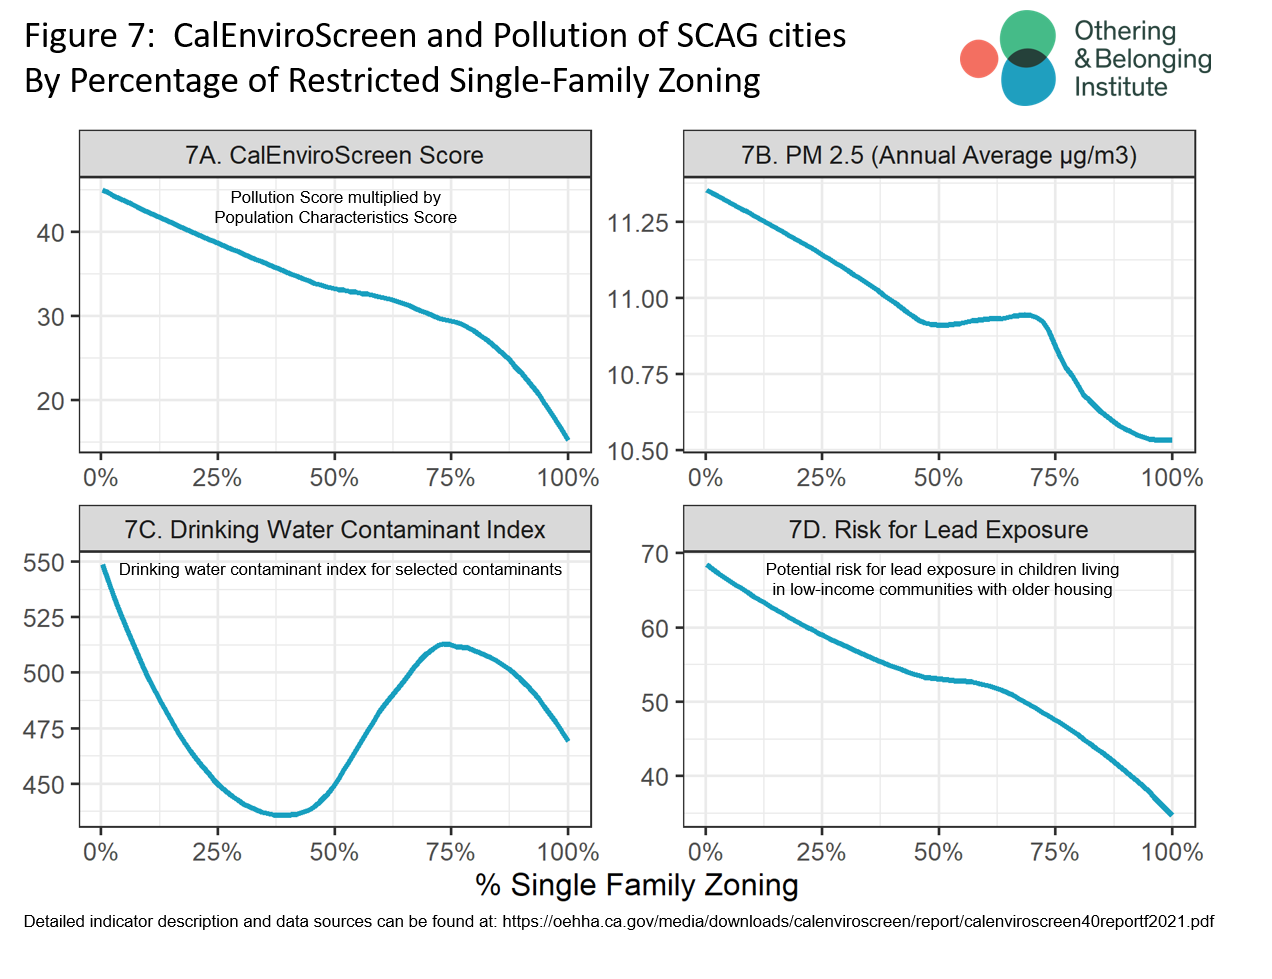
As you can see from Figure 7A, the vulnerability observed by CalEnviroScreen drops precipitously as the percentage of single-family-only zoning increases. Similarly, Figure 7B shows that particulate matter PM 2.5 (a known contributor to asthma) declines as the percentage of single-family-only zoning increases.
The quality of drinking water (displayed in Figure 7C) does not quite follow the same pattern, but we noted in our Bay Area report that urban municipal facilities often produce the cleanest drinking water, so this is not a surprising result.30 We also noted that many suburban and exurban areas have more fertilizer run-off and other pollutants less commonly found in urban neighborhoods.
Lead is a known neuro-toxin, so it is extremely alarming to discover that there is an almost perfectly linear inverse relationship between the lead levels and percentage of single-family zoning, as shown in Figure 7D.
Single-Family Zoning and Economic Mobility (Opportunity)
The foregoing analysis examined the relationship between the degree of restrictive zoning and certain community characteristics. This analysis supports the theory that restrictive zoning is used to hoard opportunity and exclude people on the basis of race and class. Perhaps more revealing in this regard are the outcomes for children raised in different environments based on the degree of single-family zoning present.31
The Opportunity Atlas contains information on childhood outcomes for nearly every American child born between 1978 and 1984.32 Examining tracts in the SCAG region, we are able to see a clear and consistent correlation between single-family zoning and positive outcomes for children across income distribution born in this time frame. Figure 8 below shows that, for these children, there is a direct relationship between the degree of restrictive zoning in their environment and their ultimate income level as an adult. We theorize that this is explained by the degree to which zoning controls communal resources for human capital investment and development.
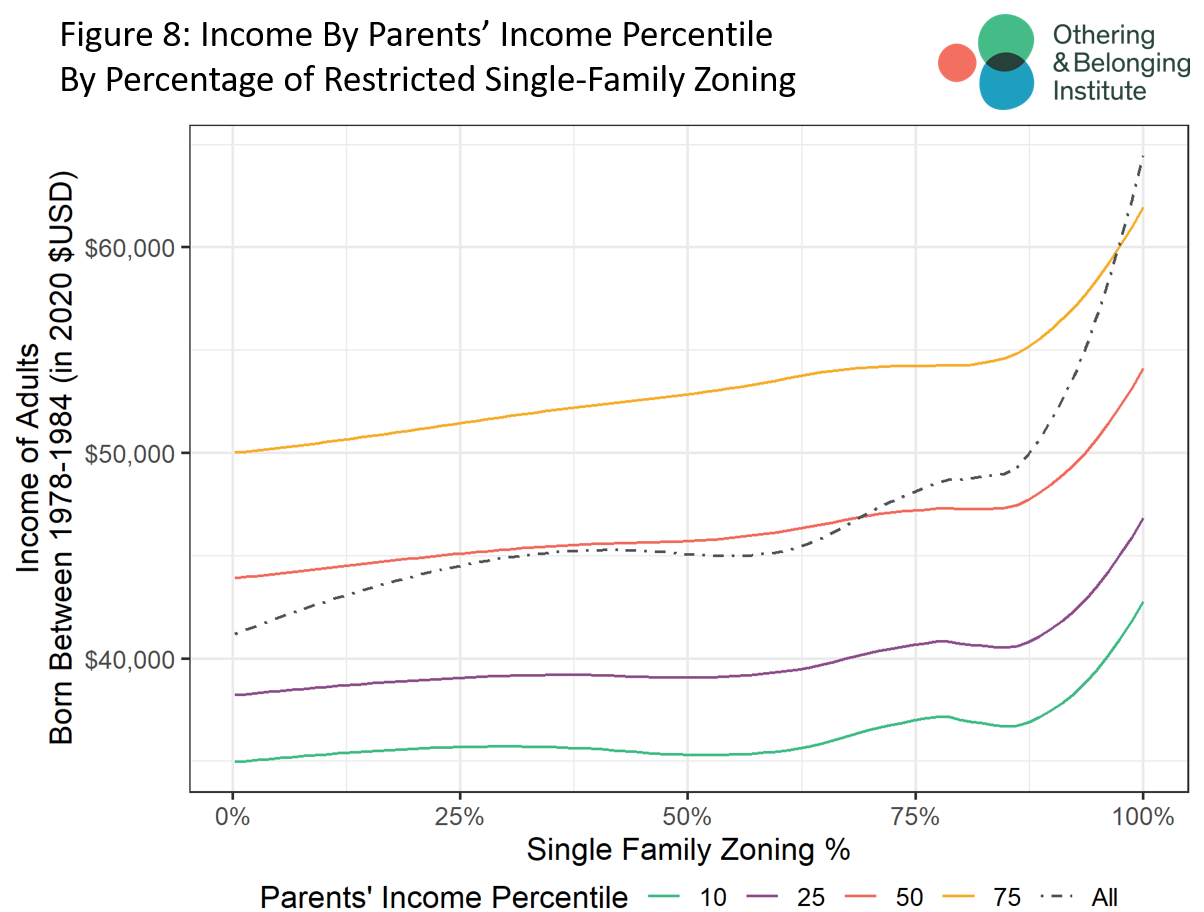
It is not just that children raised in environments with a higher percentage of single-family zoning appear to have higher annual incomes as adults. This basic relationship appears to be true for children born in every segment of the income distribution (i.e. irrespective of their parents' income). The ultimate level of income in adulthood is strongly influenced by parental income during childhood, but the overall pattern shown by the lines in Figure 8 is strikingly similar across the income distribution.
For example, Figure 8 shows that children born into families with incomes at the 75th percentile of the income distribution and residing in communities with nearly 100 percent single-family-only residential zoning ended up making more than $10,000 per year as adults than children born into families at the same income level but living in communities with 25 percent or less single-family-only zoned residential areas.
Importantly, we find that this relationship holds across all racial groups as well, as shown in Figure 9 below.
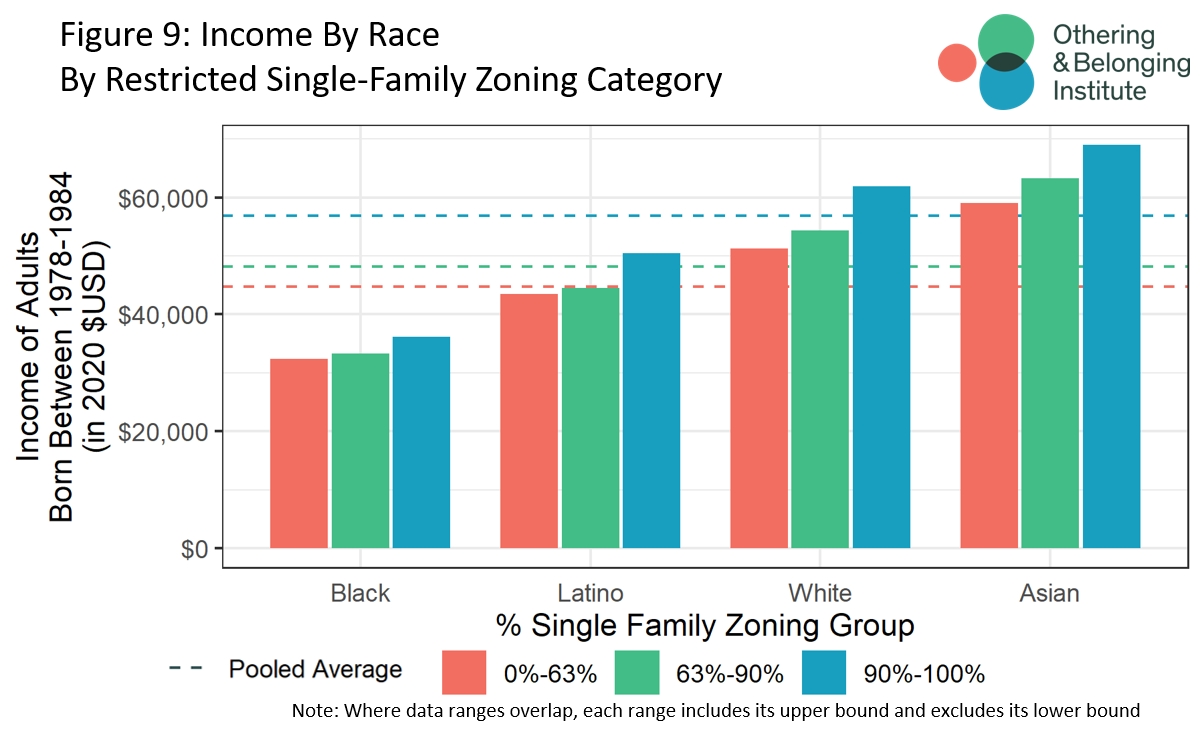
Figure 9 shows the adult annual incomes for children raised in the SCAG region based upon the percentage of single-family-only zoning, broken down by race. For every racial group, the greater the percentage of single-family-only zoning, the higher the observed adult income level.
In short, upward mobility for all racial groups appears to be correlated with the proportion of single-family zoning.33 Although this pattern could be interpreted to suggests that restrictive zoning is a beneficial community feature, we believe instead that a predominance of single-family zoning reflects dynamics of opportunity hoarding, and that the class and race exclusion (shown earlier) of restrictive zoning is a central reason why opportunity remains so unequal in the United States.
To appreciate this fundamental insight more deeply, we also looked at the intersection of race, class, and zoning in terms of upward economic mobility. Specifically, we calculated the probability that children from each racial group would make it to the top quintile (the top 20 percent) of the income distribution as adults based on the degree of restrictive zoning in their community. The results, shown in Figure 10, are stunning.
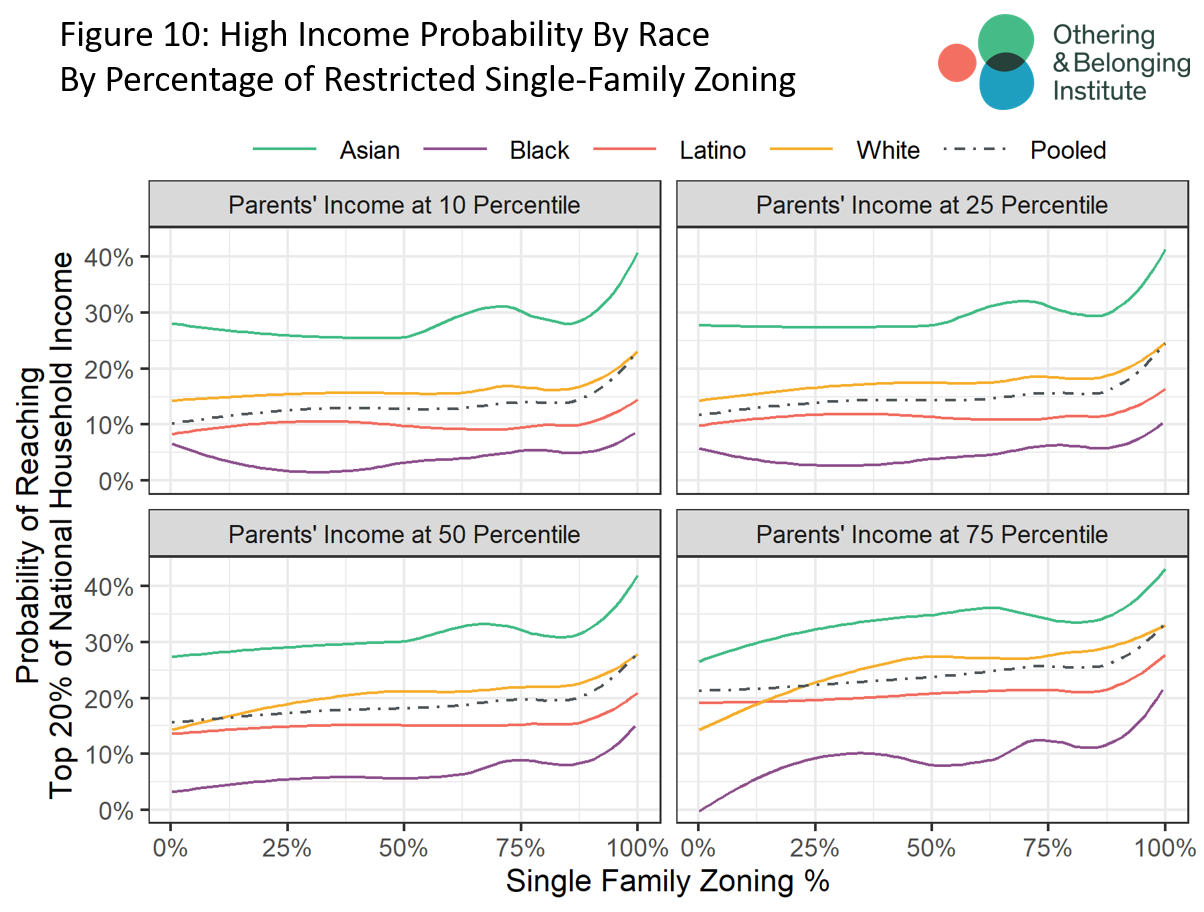
If opportunity were “equal,” children born into any part of the income distribution would have an equal shot at making it to any other part of the income distribution as adults. Since Figure 10 displays the chances of making it to the top 20 percent of the income distribution, perfect equality of opportunity should exist only if those children have a 20 percent chance of making it there. If they have a greater than 20 percent chance of landing there, then other children, by definition, must have a less than 20 percent chance of landing there as adults.
Figure 10 shows that in the SCAG region, children of different races have vastly different rates of upward economic mobility, with parental income (class position) playing a less powerful role. Black children, in particular, have the lowest rate of upward economic mobility, irrespective of the extent of zoning in the community in which they were raised or their family income (consistently below 10 percent chance of making it to the top income quintile as adults).34 Conversely Asian children have high rates of upward economic mobility (consistently above 20 percent chance of making it to the top income quintile as adults). Latino and white children perform somewhere in between.
Figure 10 is also consistent with the findings presented in Figures 8 and 9 above, showing race and class dynamics in relation to the degree of restrictive zoning by community. Children raised in communities with a greater degree of restrictive zoning appear to have significant advantages over and more upward economic mobility than their peers. Rates of upward mobility grow as the community’s percentage of single-family-only zoning increases for all racial groups at all income levels.
What we find most disturbing in this data, however, is how few Black children raised in higher income families make it to the top quintile of the income distribution if they reside in low single-family-only zoned areas, but how many more approach theoretically perfect economic opportunity (20 percent making it to the top 20 percent) when raised in jurisdictions with near 100 percent single-family-only zoning.
Figure 10 suggests that the only way for Black children to get an even theoretically equal shot at the American Dream is to grow up in highly-exclusionary communities raised by upper-income parents. We leave it to you to ponder the implications.
Identifying Cities For Zoning Reform
Anti-density zoning ordinances appear to play a powerful role not only in propagating race- and class-based exclusion, but in shaping life outcomes for children in those communities. Restrictive zoning is a powerful mechanism for hoarding resources, and that will not fundamentally change without reforming or overriding zoning regulations at the municipal level. In the short term, zoning reform alone cannot accomplish the goal of creating more affordable housing or providing more resources to lower-performing schools. In the long term, however, it will be exceedingly difficult to accomplish any equity objective without significant zoning reform.
Given the overall predominance but variability of restrictive zoning across the region, one intuitive policy response is to target reform efforts at jurisdictions with the highest levels of single-family zoning. While this has a certain mathematical appeal, it may be overly simplistic in relation to ultimate equity objectives. For that reason, we use four factors to pinpoint jurisdictions that may be the best candidates for reform:
1) The percentage of single-family-only zoned residential areas
This indicator selects only jurisdictions with an extremely high level of single-family-only zoned areas.
2) The percentage of the jurisdiction that is designated as “high opportunity” on the state’s COG-based opportunity maps35
The Tax Credit Allocation Committee’s official opportunity maps already guide the state’s allocation of federal subsidies for affordable housing, and for that reason are useful indicators for identifying jurisdictions with a high degree of opportunity. Jurisdictions with a greater share of high-opportunity neighborhoods are better targets for reform in relation to equity objectives.
3) Distance from regional economic centers (central business districts)
This indicator is a proxy for access to jobs. Upzoning areas that are remote or difficult to access makes far less sense than neighborhoods that are already accessible and proximate to jobs and businesses. Therefore, we excluded jurisdictions too remote from job centers as places to prioritize reform. We selected municipalities that were 40min or less from the CBD. There are other possibly more direct measures of job proximity, but this measure has the additional benefit of reflecting significant existing transit infrastructure. Central business districts are accustomed to accommodating large numbers of daytime workers. We apply this criteria both in terms of distance and travel time.
These are the same three criteria we used for our Bay Area analysis of cities that are most deserving of reform. To these criteria, we are adding a fourth:
4) Poor performance with RHNA targets
The Regional Housing Needs Assessment requires that every jurisdiction in the state plan for housing at five different income levels, "very-low," "low," "moderate," "above-moderate," and “high.”36 Jurisdictions are required to zone for local needs, but in practice, jurisdictions do not meet their RHNA requirements.37 Jurisdictions that perform especially poorly with respect to RHNA targets for low and very-low income housing are excellent candidates for zoning reform because government agencies have already determined that they should shoulder a greater share of affordable housing developments. Table 3 below contains our results.
Table 3: Candidates for Zoning Reform and Selection Indicators
| Cities | Single Family % | % of Neighborhoods in High Opportunity Category | RHNA Low & Very Low Income Completion38 | Minutes from CBD | Miles from CBD39 |
| Bradbury | 100% | 100% | 0% | 32 | 17.3 |
| La Habra Heights | 100% | 100% | 0% | 31 | 15.2 |
| Rolling Hills | 100% | 100% | 0% | 40 | 21.1 |
| Villa Park | 100% | 100% | 0% | 15 | 6 |
| La Canada Flintridge | 99% | 100% | 0% | 18 | 11.1 |
| Walnut | 99% | 100% | 0% | 33 | 19.6 |
| Moorpark | 96% | 100% | 5% | 34 | 18.3 |
| Chino Hills | 96% | 100% | 0% | 38 | 16.3 |
| Diamond Bar | 94% | 100% | 0% | 28 | 17.6 |
| Rolling Hills Estates | 94% | 100% | 0% | 33 | 20 |
| La Mirada | 93% | 100% | 0% | 21 | 13.1 |
| Glendora | 93% | 100% | 0% | 38 | 23.7 |
| Cerritos | 90% | 100% | 0% | 24 | 13.8 |
Given the extent of exclusionary zoning in the region, it would be a mistake to conclude that these are the only cities that should be the focus of zoning reform efforts, but these appear to be especially worthy targets of such efforts, using our simple set of criteria. There may be other factors or considerations to bring into this analysis. Consider this analysis provisional, and a starting point for local organizing.
Conclusion
Zoning plays an outsized role in shaping community demographics and other characteristics. In particular, we found that anti-density zoning appears to play a sharply exclusionary function, used by municipal jurisdictions to exclude lower-income people and people of color, or at least has that effect, in the greater LA region. It is not simply that these exclusionary communities use land-use regulation to maintain their exclusivity, they are denying access to vitalizing resources by hoarding those resources for themselves.
We also presented systematic evidence that communities with more single-family-only zoning have greater incomes, higher home values, higher levels of educational attainment, better performing schools, and fewer environmental hazards. We also found that children raised in communities with a greater share of single-family-only zoning had higher incomes as adults and were more likely to make it to the top of the income distribution, with outcomes that appear to grow more pronounced (and disturbing) when controlling for family income.
The evidence developed in this report consistently supports the theory that restrictive zoning is used to hoard critical resources, including good schools, access to jobs, and safe work and play environments. Although this study cannot make definitive causal claims, the evidence suggests a powerful relationship between these outcomes and the degree of restrictive zoning, whether that is a direct cause-effect relationship or a byproduct of some other causal connection.
There are good reasons, however, to think that restrictive zoning may be both a cause and an effect of these outcomes. Restrictive zoning may spur high-income people to cluster by providing a mechanism by which they can leverage the powers and prerogatives of local government to hoard resources for themselves and their children. This, in turn, may lead such jurisdictions to adopt even more restrictive zoning regulations hostile to density and housing affordability. These investments and policy preferences tend to result in better outcomes for their children, which, in turn, perpetuates the cycle of advantage.
The evidence developed in this report consistently supports the theory that restrictive zoning is used to hoard critical resources, including good schools, access to jobs, and safe work and play environments.
This research unequivocally confirms that the general patterns observed in the San Francisco Bay Area, and those observed by other researchers, also exist for the Greater Los Angeles (SCAG) region. Although certain details vary, the general pattern is strikingly similar. This suggests the need for state-wide reform, enacted either at the state or federal level, which are more far-reaching than reforms such as SB 9, and more comprehensive than piecemeal municipal reforms.
Absent such reform, the pattern of racial and economic exclusion is likely to persist, if not worsen, locking Californians into a cycle of inequality of opportunity and outcomes from which they may never escape.
APPENDIX: Methodology for zoning categorization
Data procurement: Zoning shapefiles for each city in the region were gathered from multiple sources, including the SCAG MPO repository, city planning/GIS or relevant departments, and ESRI’s ArcGIS Hub in the listed order to ensure we have the most updated shapefiles to conduct our analysis.
Zoning categorization: We reviewed municipal code documents for each city within the region to clearly identify each zone within the city. By referencing city ordinances for each unique zone in each municipality, we recorded the type of housing development permitted and conditionally permitted as follows:
- P: permitted as right. We did not include building types that were permitted for accessory use only.
- C: conditionally permitted; requires review; requires minor use permit
And we sorted the zones into three categories:
- Single Family Residential: This includes single-family zones, low-density zones, agricultural zones (if single-family homes are permitted), and estate zones. This category usually permits detached single-family homes or two detached single-family homes on the same lot or parcel, but not duplexes. The zone is not classified as single-family residential if it only permits the following: caretaker’s residence, employee housing, or live-work units.
- Other Residential: This includes both multi-family residential and mixed-use residential.
- Multi-family residential includes attached two family homes, condos, apartments, town homes, and mobile homes (parks). Additionally, if a zone’s intent allows for both single-family homes and any of the multi-family housing above, it is sorted into the multi-family category. This category does not include employee housing and student housing.
- Mixed-Use Residential is land designated to blend multiple uses inclusive of residential use. This includes zones that are not strictly residential but permit or conditionally permit residential uses, e.g., industrial/commercial zones where residential uses are permitted or conditionally permitted, commercial zones where residential units are allowed in commercial buildings, mixed-use zones, or office professional districts that permit single-family homes.
- Non-residential/unknown: This zone includes all other zones which are not residential. This includes open space, public districts, commercial zones, and industrial zones that do not allow residential uses. Non-developable land such as right-of-way, railroad, highway, water body, and marshland are included in this category.
We prioritized and focused on the intent and the purpose of the zone to sort the zones into one of the three categories: non-residential/unknown, single-family, and other residential. For example, a residential zone intended for both single-family and multi-family developments would be classified in the other residential category (which includes multi-family zones), even if multi-family is only conditionally permitted. This is because the zone’s intention was for both single-family and multi-family developments.
When the intent and purpose of the zone was unclear, we classified the zone based on what is permitted in the zone. For example, consider a “general residential” zone that does not specify whether it is strictly for single-family homes in its intent. If it permits single-family homes but only conditionally permits multi-family homes, it would be classified in the single-family category. And if it permits both single-family homes and multi-family homes, it would be classified in the other residential category. Since we prioritized the zone’s stated intent and purpose in the city ordinance, we would only rely on the permitted use if the intent and purpose was unclear.
For planned development and specific plan zones where the municipal ordinance does not detail the intent and purpose enough for us to classify the entire zone or zones that are missing in the municipal ordinance, we used the standardized land use class from SCAG to categorize the parcels in these zones into one of the three categories above.
Quality check procedures: Human errors could impact the quality of the analysis so it was important to establish data quality checking protocols to reduce any human errors. We followed these procedures at different stages of data collection and classifying our zoning categories:
- We checked for updated zoning shapefiles from individual city planning departments for each municipality to ensure we procured the most updated version of each shapefile.
- Once the zoning codes were extracted from the shapefiles and were re-coded to our three simplified zoning categories, another team member conducted a spot check to ensure the extraction and coding was done properly and with internal consistency.
- We cross-checked our final maps against the zoning maps provided by the city to ensure our processing was accurate.
Though attempts were made to minimize any human error while interpreting various zoning codes and recoding those to our simplified categories, it was beyond our capacity to check the input data for accuracy. We were not able to check that the zoning shapefiles supplied by SCAG or any city’s planning department had the data entered correctly. We solicit any inputs or suggestions from the general public or city departments to highlight any inconsistencies in identifying the correct zoning categories and/or share updated zoning data to ensure our mapping and analysis are accurate.
Endnotes
1 The authors would like to thank Othering and Belonging Institute graduate student researchers Shahan Shahid Nawaz and Marina Blum for their invaluable assistance in helping build the repository of municipal maps that made this analysis possible as well as their insights and analysis, and Martine Johannessen for her additional research assistance.
2 We presented this information as part of a set of five different policy recommendations (one of which was zoning reform) to reduce racial residential segregation.
3 Sara C. Bronin, “Zoning by a Thousand Cuts: The Prevalence and Nature of Incremental Regulatory Constraints on Housing,” Cornell Journal of Law and Public Policy (February 24, 2021): 24–25. https://papers.ssrn.com/sol3/papers.cfm?abstract_id=3792544, noting five such studies completed in or before 2020.
4 We also released a more technical analysis in mid-2021 that attempted to track and demystify zoning reform efforts. See Karina French, “Decoding Zoning: Regulation and Reform in California” (Berkeley, CA: Othering & Belonging Institute, May 13, 2021), https://belonging.berkeley.edu/decoding-zoning.
5 "California renews use of affordable housing site maps," Othering & Belonging Institute, December 14, 2021, https://belonging.berkeley.edu/california-renews-use-affordable-housing-site-maps.
6 For greater detail on notable zoning surveys, see footnote 4 in Stephen Menendian et al., “Single-Family Zoning in the San Francisco Bay Area: Characteristics of Exclusionary Communities” (Othering & Belonging Institute, October 7, 2020), https://belonging.berkeley.edu/single-family-zoning-san-francisco-bay-area.
7 See report section “Difficulties with Zoning Research and Limitations of Existing Zoning Datasets” in Stephen Menendian et al., “Single-Family Zoning in the San Francisco Bay Area: Characteristics of Exclusionary Communities” (Othering & Belonging Institute, October 7, 2020), focused on the paragraphs that contain footnotes 5-9. For an example of a report presenting zoning figures using the ACS sampling, see: 2015 Suffolk County: Analysis of Impediments to Fair Housing Choice, (Suffolk County Department of Economic Development and Planning, 2015), 39. https://suffolkcountyny.gov/Portals/0/formsdocs/ecodev/Community%20Development/AI%20final%20draft%202015.pdf?ver=2015-10-22-115354-200. As part of the research we conducted for this report, we compared the ACS sampling of the percentage of single-family residential units in the greater LA region with our manually collected zoning data. Given that the unit used for the ACS survey is in housing units as built, the results are very different than ours where we used the unit of residential land as zoned. Here is a link to the scatterplot, which illustrates the difference, and should be a warning to researchers relying on such shortcuts.
8 Stephen Menendian et al., “Single-Family Zoning in the San Francisco Bay Area: Characteristics of Exclusionary Communities” (Othering & Belonging Institute, October 7, 2020), citing Moira O’Neill, Giulia Gualco-Nelson, and Eric Biber, “Comparing Perceptions and Practice: Why Better Land Use Data is Critical to Ground Truth Legal Reform,” The Terner Center for Housing Innovation, June 28, 2019, https://ternercenter.berkeley.edu/blog/comparing-perceptions-land-use-data.
9 Sara C. Bronin, “Zoning by a Thousand Cuts: The Prevalence and Nature of Incremental Regulatory Constraints on Housing,” Cornell Journal of Law and Public Policy Forthcoming (February 24, 2021): 23. https://papers.ssrn.com/sol3/papers.cfm?abstract_id=3792544.
10 For planned development and specific plan zones where the municipal ordinance does not detail the intent and purpose enough for us to classify the entire zone, we used the standardized land use class from SCAG to categorize the parcels.
11 The approach used in the present study differs slightly from our Bay Area single-family zoning study mentioned earlier. In our Bay Area report, mixed-use commercial zones were categorized as part of the “Non-residential” category if the zones were dominated by commercial uses regardless of whether residential uses are allowed. In our present study, commercial mixed-use zones are classified as “Other residential” if these zones permit residential uses according to the city ordinance, regardless of the dominant uses as suggested by the built environment. The rationale behind this divergence is our intention for the results in the present study to reflect the zoning code text even more directly, instead of basing it on the built environment, as was the approach we used in a few ambiguous mixed-use zones in our Bay Area study. We do not believe that this significantly changes the overall results or the comparability of the maps, but we note it nonetheless.
12 Southern California Association of Governments, 2019 Annual Land Use Dataset (ALU v.2019.2) (Southern California Association of Governments, 2021), https://gisdata-scag.opendata.arcgis.com/datasets/SCAG::2019-annual-land-use-dataset-alu-v-2019-2/about.
13 Esri. “ArcGIS Hub”, https://hub.arcgis.com/search.
14 See e.g. Sara C. Bronin et al., “Connecticut Zoning Atlas” (Desegregate Connecticut, n.d.), https://www.desegregatect.org/atlas.
15 By "cross-sectional" we mean that we averaged or identified the median from the sum of the individual jurisdictions rather than dividing the percentage of single-family-only zoned land out of the percentage of all residentially zoned land in the region as a whole. The fact that the regional percentage of single-family-only zoning is higher than the cross-sectional average suggests that a few jurisdictions with a very small amount of single-family-only zoning may be pulling down the average. We find this to be the case. As you can see from our thumbnail maps, a few jurisdictions like West Hollywood have virtually no single-family-only zoning.
16 And, if you were curious, the average amount of residential land in each jurisdiction is 56.67 percent, with a median of 57.34 percent, which means that, across jurisdictions, most land is available for residential development.
17 Sara C. Bronin et al., “Connecticut Zoning Atlas” (Desegregate Connecticut, n.d.), https://www.desegregatect.org/atlas.
18 This delineation was drawn based on some unique disjunctures we observed in our preliminary analysis. It is not based on an even distribution of municipalities. Please also note that the cities of Industry and Vernon have no residential zoned parcels. See Table 2 for a breakdown of the summary grouping of municipalities.
19 These are averages by city, and not as a percentage of the total population.
20 Two cities (Vernon and Industry) with no residential land are not included in any but the final column. There are still people living in these two cities, so included in the total group (hence 191), but are excluded from the rest of the table.
21 For a description of this measure of segregation, the formula and its utility, see: Stephen Menendian, Samir Gambhir, and Arthur Gailes, “The Roots of Structural Racism Project: Technical Appendix” (Berkeley, CA: Othering & Belonging Institute, June 21, 2021), https://belonging.berkeley.edu/technical-appendix.
22 United States Census Bureau, American Community Survey: 2015-2019 5-Year Data (United States Census Bureau, 2020), https://www.census.gov/programs-surveys/acs/data.html.
23 Ibid.
24 Ibid.
25 California Assessment of Student Performance and Progress, English Language Arts/Literacy and Mathematics: 2018-2019 (California Department of Education, n.d.), https://caaspp-elpac.cde.ca.gov/caaspp/ResearchFileListSB.
26 California Office of Environmental Health Hazard Assessment, CalEnviroScreen 4.0 (California Office of Environmental Health Hazard Assessment, 2021), https://calenviroscreen-oehha.hub.arcgis.com/.
27 The correlation coefficient between percentage of single-family-only zoning and median household income for the city is 0.387. Notably, the correlation is 0.541 for cities in the 90-100 percent range of single-family-only zoning. The blue line in Figures 4 and 5 represent a moving regression which fits local relationships between household income and home value to the single-family portion of the residential land.
28 Although the correlation between the percentage of single-family zoning and median home values is only 0.224 for all cities, it is 0.519 for communities with more than 90 percent single-family-only zoning. This means that the theorized impact of highly restrictive zoning on home values is most strongly observed in communities with the highest level of restrictive zoning.
29 Lauren Zeise and Jared Blumenfeld, “CalEnviroScreen 4.0” (California Office of Environmental Health Hazard Assessment, October 2021), https://oehha.ca.gov/media/downloads/calenviroscreen/report/calenviroscreen40reportf2021.pdf. Also, the smoothed lines in Figure 7 are created using LOESS (locally weighted least squares regression). It shows the moving regression which fits local relationships between environmental health factors to the single-family portion of the residential land.
30 Stephen Menendian et al., “Single-Family Zoning in the San Francisco Bay Area: Characteristics of Exclusionary Communities” (Othering & Belonging Institute, October 7, 2020), citing San Francisco Public Utilities Commission, City of San Francisco 2019 Annual Water Report, (San Francisco: San Francisco Public Utilities Commission, 2019), accessed October 2, 2020, https://sfwater.org/modules/showdocument.aspx?documentid=15360.
31 As a caveat, we are measuring the degree of restrictive zoning today, which is not necessarily the same as was the case a generation ago, although there is likely a strong correlation.
32 Opportunity Insights, The Opportunity Atlas (Harvard University, 2019), accessed October 2, 2020, https://www.opportunityatlas.org/.
33 The correlation coefficient for all racial groups and upward mobility is 0.3444. For white children it is .3762.
34 Raj Chetty, Nathaniel Hendren, Maggie R Jones, and Sonya R Porter, “Race and Economic Opportunity in the United States: An Intergenerational Perspective,” The Quarterly Journal of Economics 135, no. 2 (May 2020): 711–83.
35 This opportunity map uses the same methodology as the state’s TCAC Opportunity Map but all tracts within Councils of Governments (COGs) are scored against each other. Tracts that do not fall within a COG are scored against tracts within their county. By comparison, the TCAC opportunity map uses TCAC regions as the reference geography. The TCAC/HCD map also scores rural areas separately because rural affordable housing developments compete in a separate funding pool, but such a distinction is not made here.
36 “Regional Housing Needs Assessment,” Southern California Association of Governments, https://scag.ca.gov/rhna.
37 Heather Bromfield and Eli Moore, Unfair Shares: Racial Disparities and the Regional Housing Needs Allocation Process in the Bay Area (Berkeley, CA: Haas Institute for a Far and Inclusive Society, 2017), http://belonging.berkeley.edu/sites/default/files/haasinstitute_unfairshares_rhnabayarea_publish.pdf.
38 Annual Progress Report Permit Summary Table: RHNA 5th Cycle Full Summary (California Department of Housing and Community Development - Division of Housing Policy Development, 2019), https://www.hcd.ca.gov/community-development/housing-element/docs/annual_progress_report_permit_summary.xlsx. See also Nikie Johnson and Jeff Collins, “Report Card: California Cities, Counties Failing Again on Affordable Housing Goals,” The Orange County Register, January 31, 2021, https://www.ocregister.com/2021/01/31/report-card-california-cities-counties-failing-again-on-affordable-housing-goals/.(for a grade ranking of cities by RHNA performance).
39 Central Business District Coordinates Dataset, (2013), distributed by Daniel Hartley, https://www.danielaaronhartley.com/.

