

The Inclusiveness Index is a comparative analysis, thus the index values are relative to other countries in the global context, and to other states in the US context. The data for indicators in each domain as described in the “Indicators” section is collected, cleaned and prepared for analysis. Each data value for any indicator is analyzed relative to other data values for the indicator based on how far each value is from the mean value.
This outcome of this “standardization” of data is known as z-score. A z-score is a statistical measure that quantifies the distance (measured in standard deviations) a data point is from the mean of a data set. The use of z scores allows data to be measured based on the relative distance of the data value from the data average for the entire dataset for each indicator. Z-score is calculated for all indicators in each dimension – Race, Gender, LGBTQ+, Religion, Disability and General Population, and adjusted (multiplied by ‘-1’) where higher values of indicators meant lack of inclusion (e.g. higher index values for government restrictions on religion). This allows consistency in accepting higher values as positive outcomes. These z-score values are then scaled from 0-100 for each indicator. The dimension index score is the average of scaled scores of each indicator within the dimension, e.g. the Race index score for the US = Average (Scaled score for political representation by race, and scaled score of income ratio of non-whites over non-Hispanic whites).
The Inclusiveness Index value is the average of index scores for all dimension. The level of inclusiveness (High to low) is determined by sorting the data in descending order and categorizing into quintiles. Thus, the countries or US states identified with “high” inclusiveness represent the top 20 percent of scores among respective geographies. Conversely, countries or US states identified with “low” inclusiveness represent the lowest scoring 20 percent of respective geographies. This average allows states/nation-states scores to improve from year to year even if they are lagging or worsening in one area but are excelling in another area.
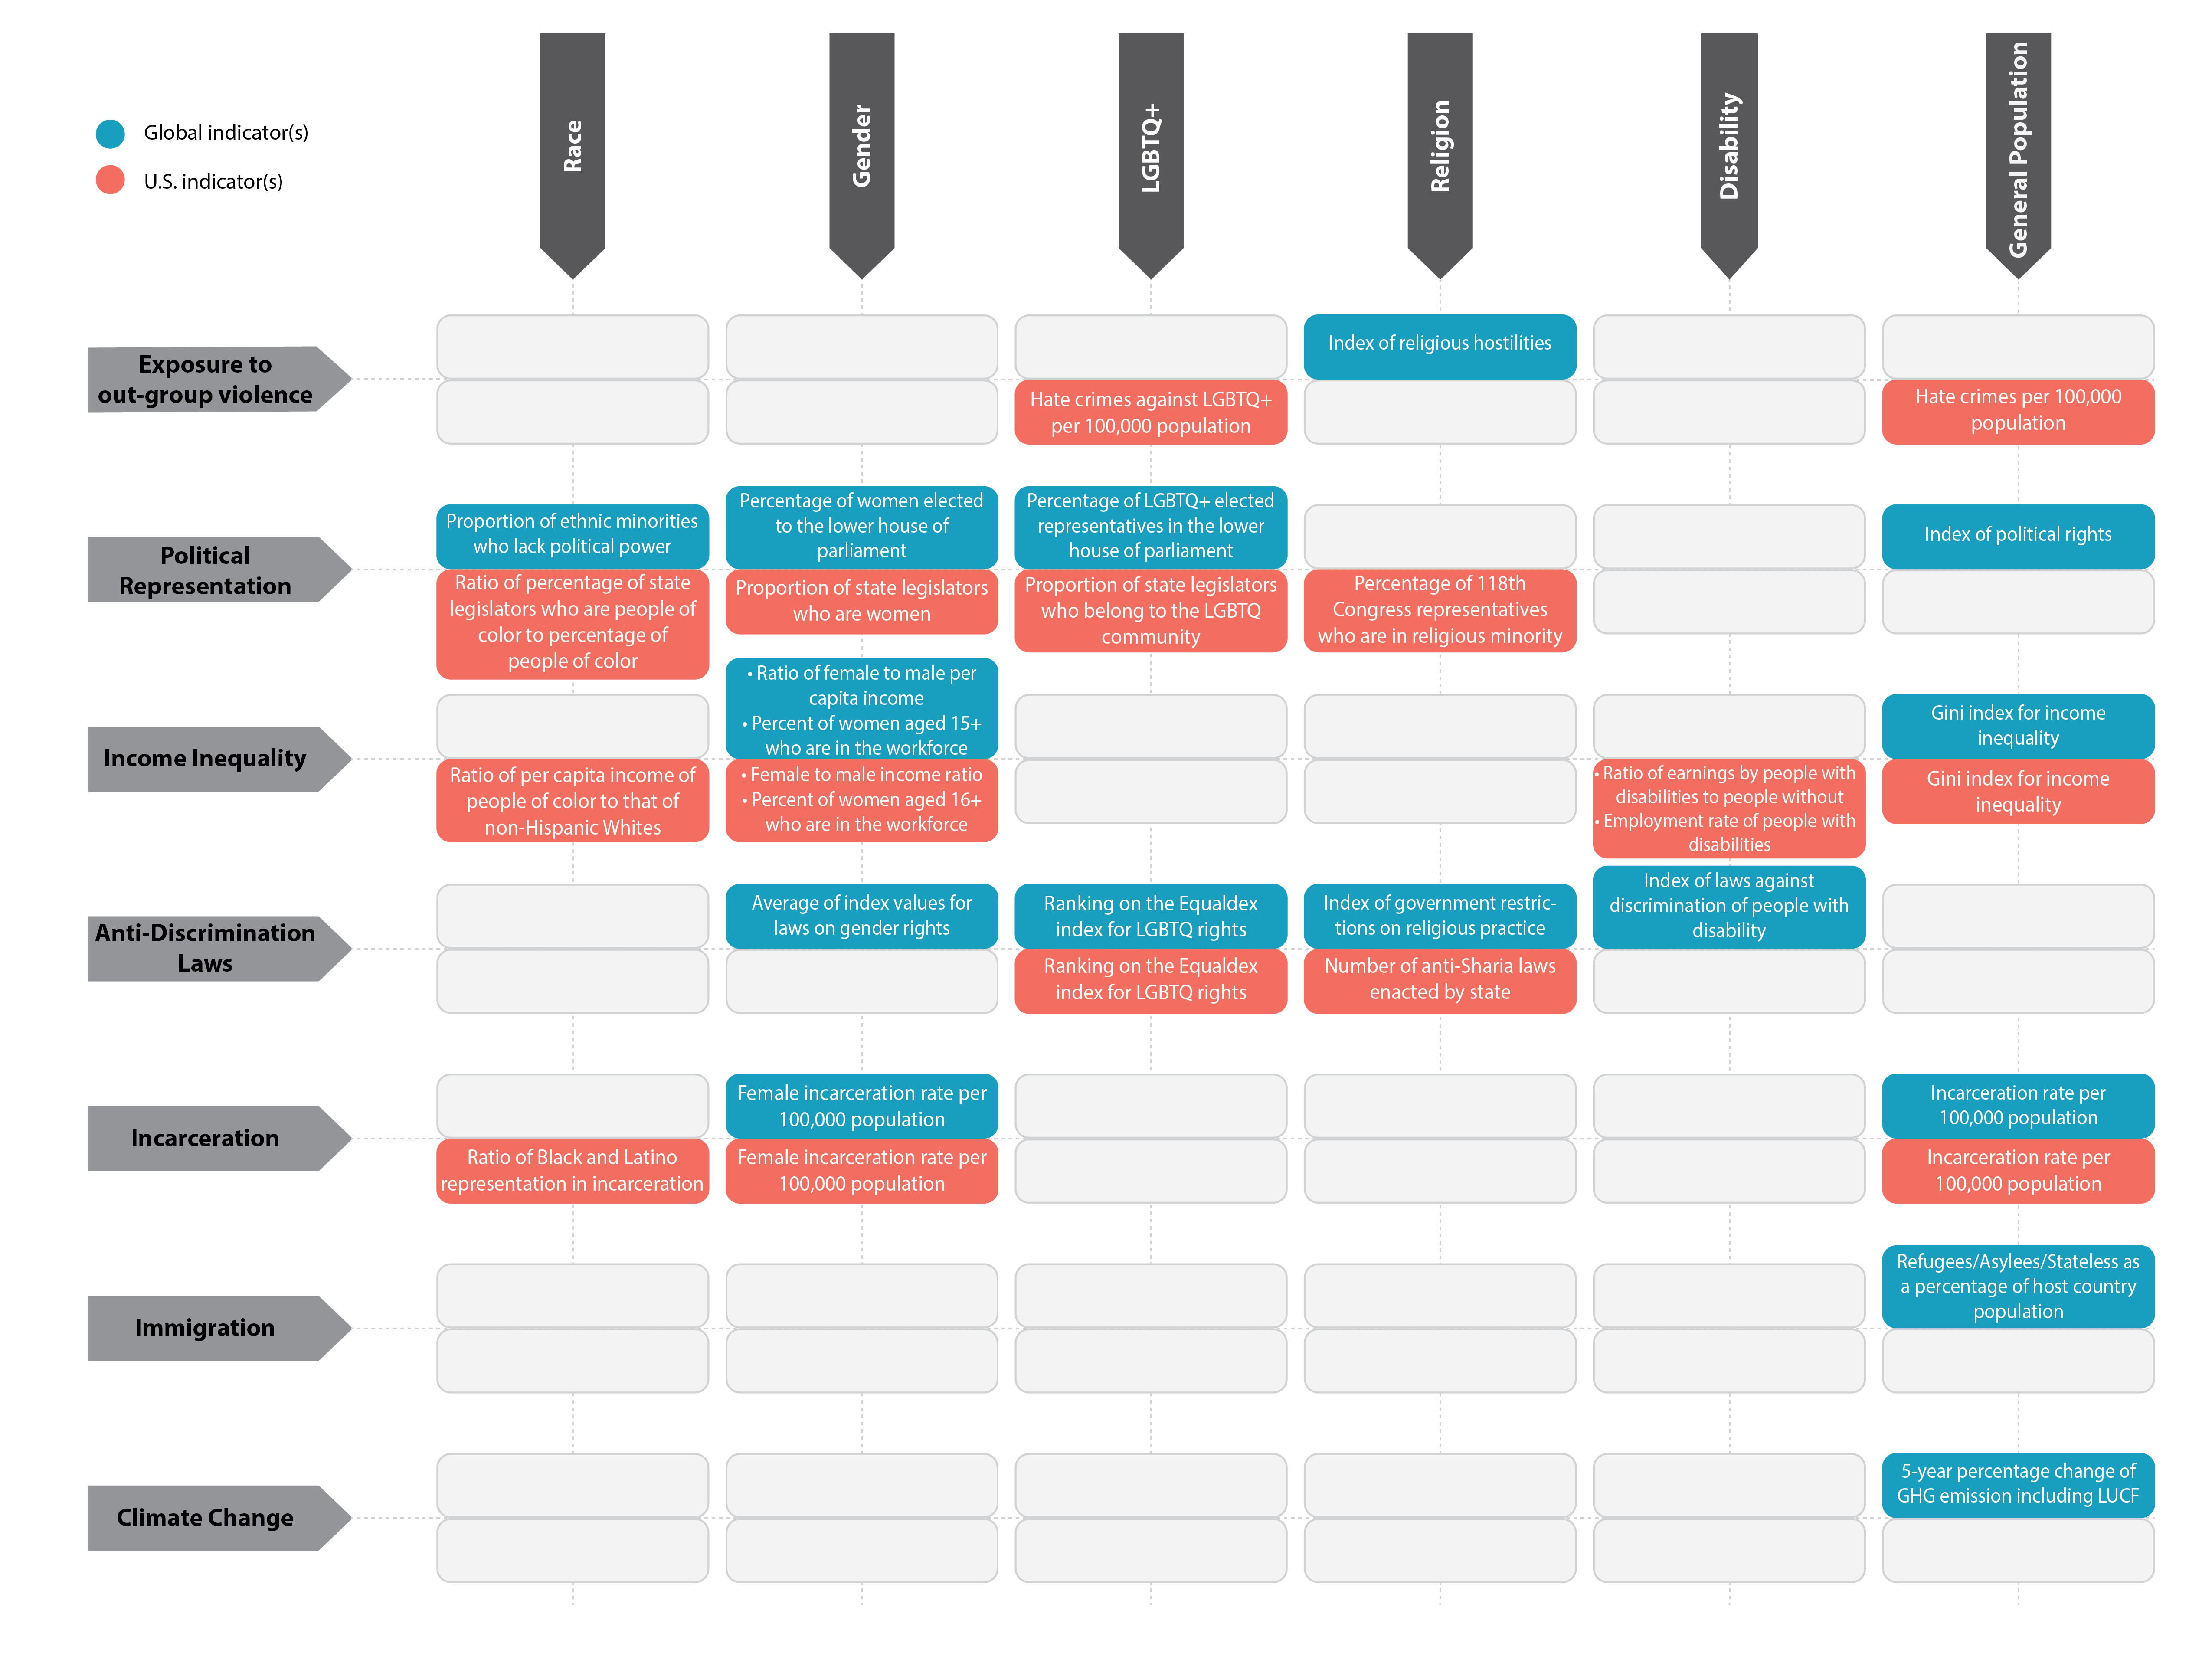
Infographic: 2024 Data Matrix. (Download the 2021 Data Matrix here, the 2022 Data Matrix here, and the 2023 Data Matrix here) .


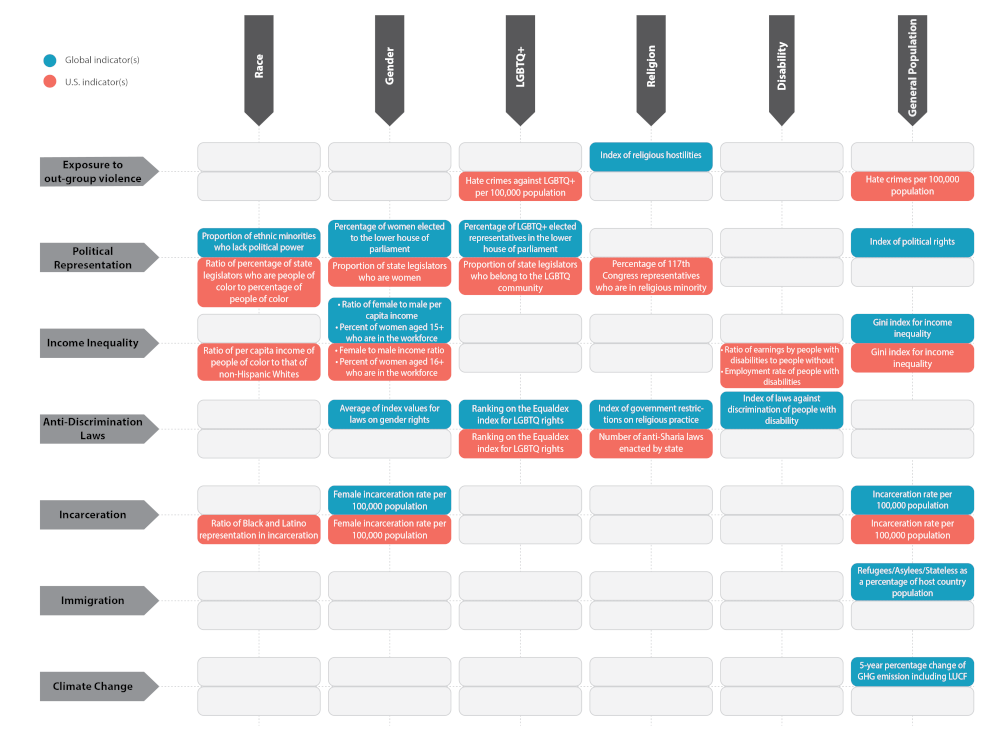