San Francisco, with just under 900,000 residents, is among the most diverse and affluent cities in the country. Its population is approximately 40% white, 35% Asian, 16% Hispanic, and 5% Black. While it boasts one of the nation’s highest median household incomes, San Francisco also exhibits stark racial and economic divides, especially in housing and wealth.
The San Francisco Progress Report Cards are an extension of the Othering & Belonging Institute’s National Progress Report Cards. These Report Cards allow users to track changes within the City of San Francisco from 2000 to 2023 across 13 key indicators between Black and white residents:
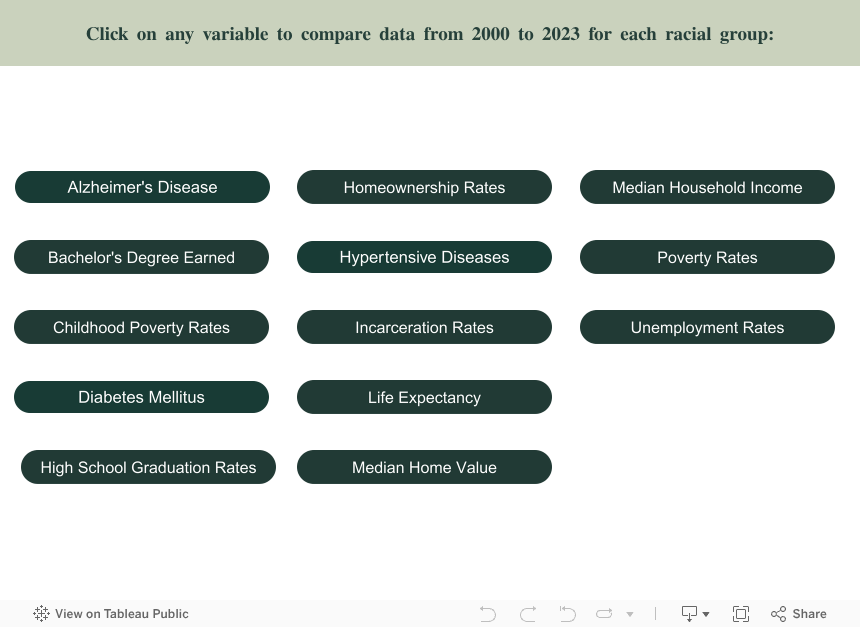
A complete and nuanced portrait of race in residents’ lives requires both an understanding and an awareness of the full range of outcomes. As you click on each indicator in the above dashboard, you can quickly see whether disparities are narrowing or widening, while also observing the absolute progress—or regress—experienced by each racial group.
Progress Grading Report Card:
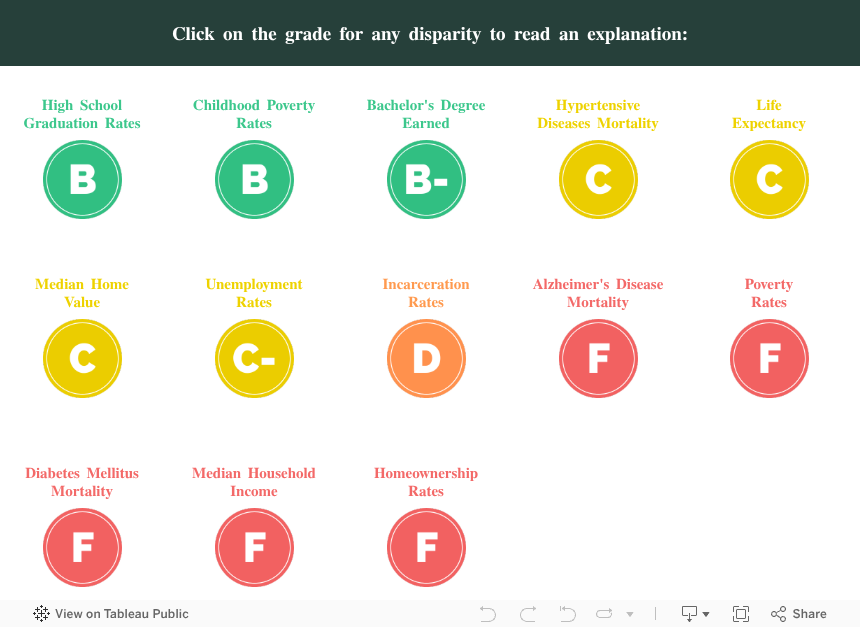
Among these 13 indicators, only two—high school graduation rate and child poverty rate—earned a grade of B, the highest scores compared to the others. This suggests that Black residents have made meaningful progress in education and in reducing child poverty, yet continue to face significant inequities, or in some cases worsening conditions, in areas such as health outcomes, incarceration rates, income, poverty, median home value, unemployment, and homeownership.
In both high school graduation and child poverty, we see not only a narrowing of disparities but also real improvements in overall outcomes for Black residents. By contrast, the white–Black gap in bachelor’s degree attainment has widened by 4.53 percentage points, lowering its grade to B-. Health outcomes remain especially troubling: hypertensive disease mortality rates and life expectancy were graded C, while Alzheimer’s disease mortality rates and diabetes mellitus mortality rates received failing grades, underscoring the urgent need for progress in public health equity. Philadelphia reveals similar patterns. In economic domains, consistent with findings from the national dashboard, median home value earned a C, while poverty rates, median household income, and homeownership rates all received failing grades. These results show that Black residents still face substantial economic disadvantages compared to white residents, with significant gaps remaining across income, poverty, homeownership, and wealth-building opportunities. In addition, unemployment rates received a C- and incarceration rates a D, both on the lower end of the grading scale.
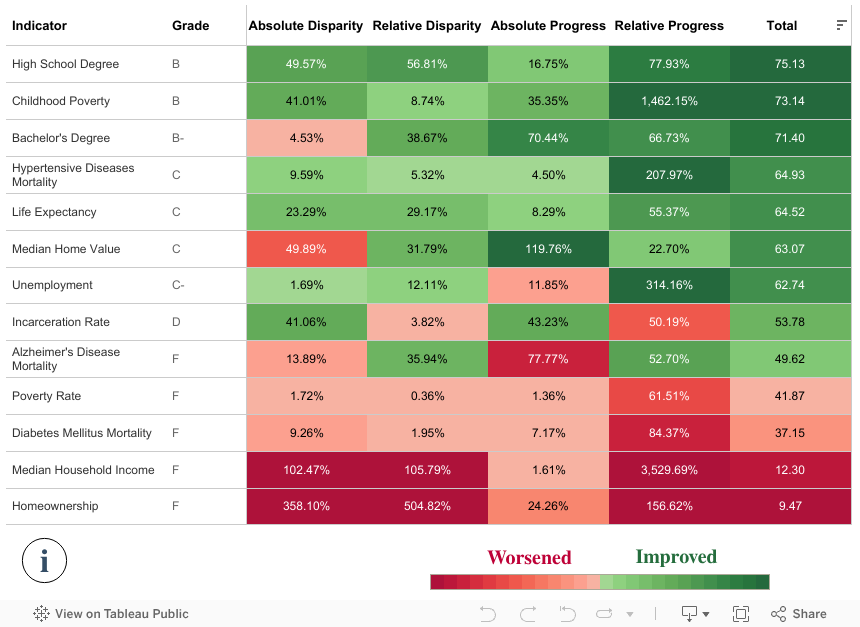
The Progress Report Grade is based upon four components (you can refer to the methodology outlined in the National Dashboard): the change in the absolute and relative magnitude of the disparity, and the absolute and relative progress toward closing the disparity. Below is a legend and a summary of the four factors we used to calculate the grades. All four factors are equally weighted. Click any item on the summary table to highlight that row.
Summary Chart: