Philadelphia, home to roughly 1.6 million residents and the sixth largest U.S. city, is a racially and ethnically diverse community with a population that is about 40% Black, 36% white, 15% Hispanic, and 8% Asian. Despite this diversity, Philadelphia continues to grapple with high rates of poverty, uneven health outcomes, and educational disparities, making it a critical case study for understanding racial inequities in large urban areas.
The Philadelphia Progress Report Cards are an extension of the Othering & Belonging Institute’s National Progress Report Cards. These Report Cards allow users to track changes within the City of Philadelphia from 2000 to 2023 across 16 key indicators between Black and white residents:
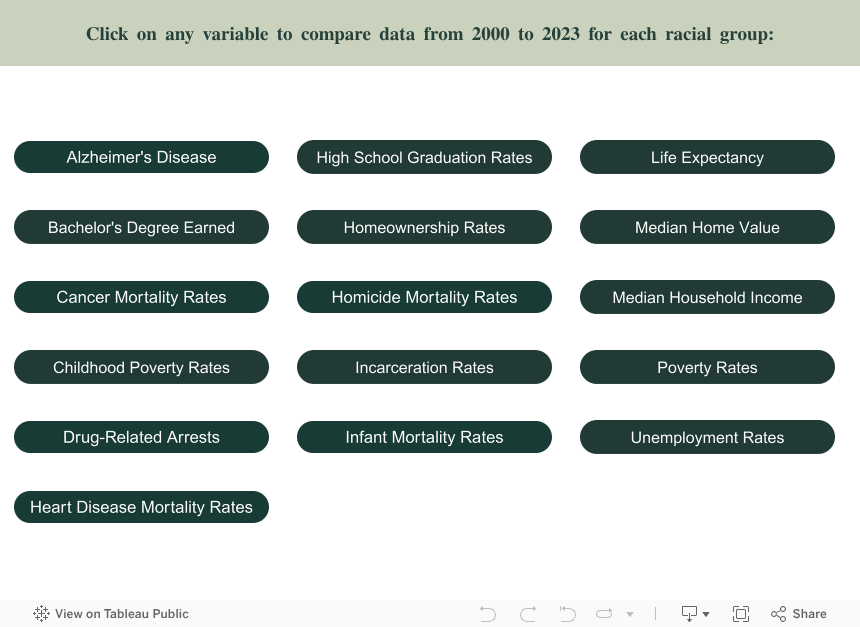
A complete and nuanced portrait of race in residents’ lives requires both an understanding and an awareness of the full range of outcomes. As you click on each indicator in the above dashboard, you can quickly see whether disparities are narrowing or widening, while also observing the absolute progress—or regress—experienced by each racial group.
Progress Grading Report Card:
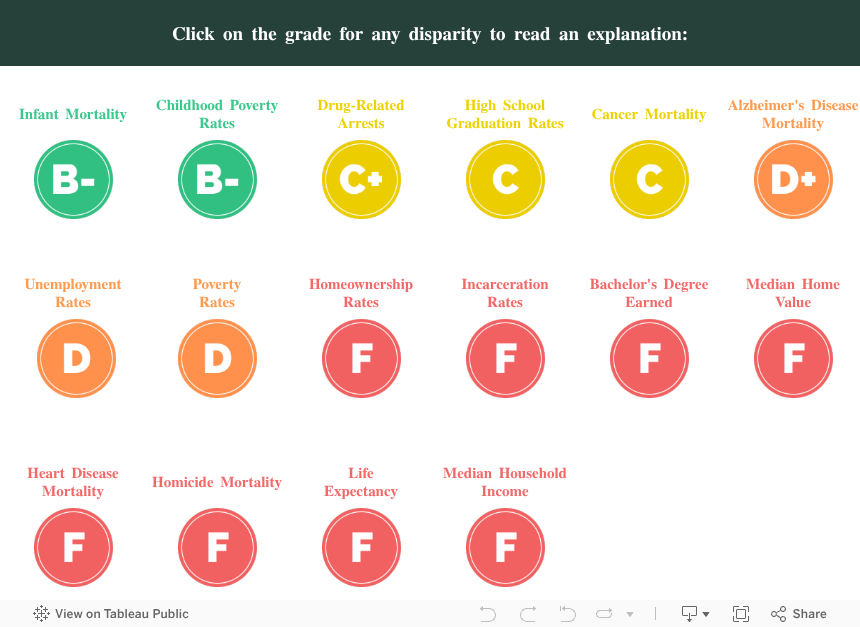
We have 16 indicators available for Philadelphia—three more than in San Francisco—allowing for a broader view. However, the results point to a more challenging picture. Infant mortality rates and child poverty rates earned the highest marks at only B-, highlighting areas of modest progress. In contrast to San Francisco, high school graduation rates slipped to a C and bachelor’s degree attainment received a failing grade, signaling a widening of racial inequities in education that diverges from both San Francisco and national trends.
Health outcomes are especially concerning, much like in San Francisco. Cancer mortality rates earned a C and Alzheimer’s disease mortality rates a D+. Both heart disease mortality rates and life expectancy received failing grades, underscoring severe racial health inequities. The economic domain shows a similarly troubling pattern at both the city and national levels: poverty rates earned a D, while homeownership, median home value, and median household income all received failing grades. The persistent gap in economic opportunities between Black and white residents—locally and nationally—raises important questions that warrant deeper exploration. Unemployment rates were graded D and incarceration rates an F. Two safety-related measures unique to Philadelphia—drug-related arrest rates (C+) and homicide mortality rates (F)—further reveal the city’s significant challenges.
Taken together, these results illustrate how local conditions mirror broader national patterns, reinforcing the value of the dashboard as a tool to identify, compare, and ultimately address racial disparities across different contexts.
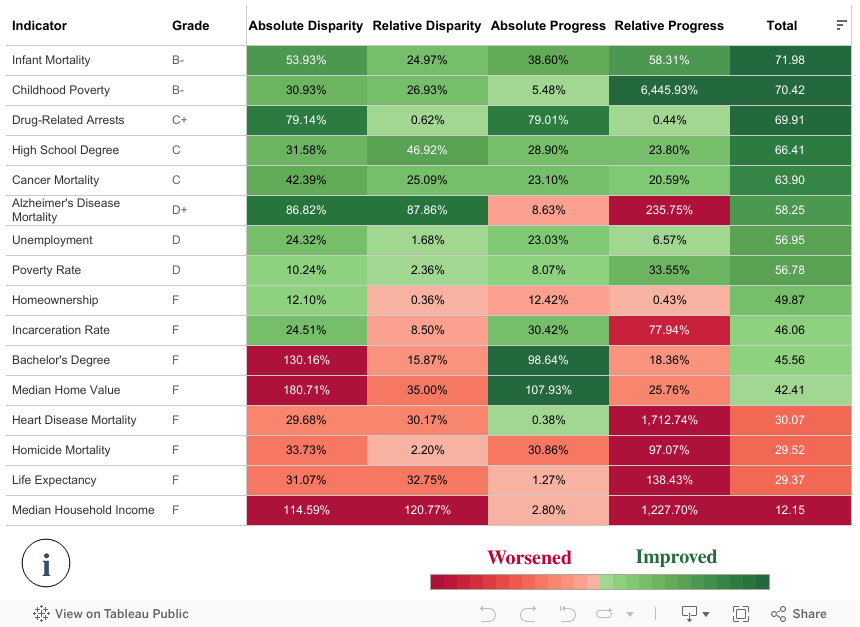
The Progress Report Grade is based upon four components (you can refer to the methodology outlined in the National Dashboard): the change in the absolute and relative magnitude of the disparity, and the absolute and relative progress toward closing the disparity. Below is a legend and a summary of the four factors we used to calculate the grades. All four factors are equally weighted. Click any item on the summary table to highlight that row.
Summary Chart: