
Contents
- Introduction
- Operationalizing Equity in Transportation Planning
- Research Process and Methods
- Inventory of Transportation Equity Metrics
- Critical Discussion of Metrics
- Conclusions and Recommendations
- Endnotes
Introduction
What data should be collected to measure how equitable a transportation project is, and measure progress toward a more equitable transportation system? How can the various planning documents, projects, and divergent funding sources used in transportation be integrated with a framework to ensure their overall impact is socially equitable? How can the transportation strategies for reducing climate impacts and enhancing social equity be approached in a coherent, systematic way? In the context of fiscal crises, how can equitable transportation strategies be communicated to mobilize broad support for new revenue? These critical questions are urgent as transportation planners, policymakers, and advocates face the mounting climate crisis, persistent inequities, and barriers to expanding and improving systems.
In a clear sign of progress, social equity is now widely considered a key pillar of transportation planning and the urban planning field more broadly.1 But what equitable transportation means in practice and how it is measured often still reflect shortcomings and contradictions typical of a field of practice that is nascent and under development. This report provides a discussion about operationalizing equity in transportation planning, an inventory and critical discussion of commonly used transportation equity metrics, and recommendations for more effective and meaningful equity frameworks and metrics in transportation planning. This research is based on the authors’ direct observations as a technical assistance provider and evaluation partner to equitable transportation planning initiatives in California, as well as a review of professional and academic research and planning tools, and input from workshops held with practitioners in three regions of California. This research also draws from ongoing work on equitable transportation planning, reimagining urban planning, equity metrics, and targeted universalism.
Operationalizing Equity in Transportation Planning
“Equitable transportation” can hold many different definitions and applications. The definition of equity and how it is applied can determine vastly different outcomes in plans, project designs, and community impact. What follows is a discussion of the ways equity can be defined, some shortcomings of how it is often operationalized, and an overview of targeted universalism as a framework for equitable transportation planning.
In reviewing relevant research and our experience, we conclude that measuring equitable transportation must include setting a threshold for minimum acceptable levels of accessibility. Setting this threshold is a moral and technical decision that must be supported by community participatory planning and research. The threshold provides a basis for a universal goal that is an objective measuring stick with which to assess diverse geographic areas and social groups' access to transportation across time.
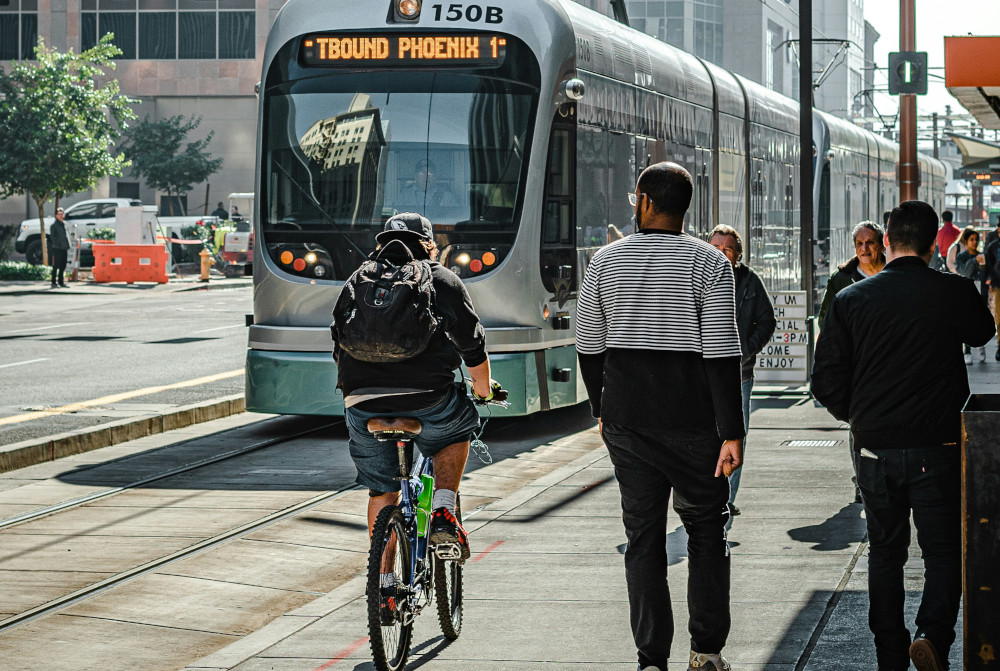
A tram arrives to a station in Phoenix, AZ. (Photo by Jared Murray / Unsplash)
Often, equitable transportation focuses on closing a gap between two social groups or neighborhoods. For instance, this applies to a finding that African American residents have an average travel time to job dense areas that is twice the average travel time of white residents. This approach recognizes that the groups have different levels of access to transportation and then sets the goal of closing (or at least shrinking) that gap. The problem emerges that neither group may have what they actually need, and closing the gap will bring the group with less access to the level of access that the more privileged group has, but won’t bring both groups to the level of access that they desire and deserve. This often generates backlash from the more privileged group because they aren’t making progress toward a goal, and frustration from the less privileged group because the progress they experience isn’t sufficient to achieving their goal. Put another way, closing a gap doesn’t mean both groups are better off than before.
One study that illuminates the limits of conventional equity metrics looked at the impact of service cuts during COVID-19, which were expected to exacerbate inequities in transportation access. But in fact, when the researchers used the standard measures for assessing equitable transportation (Lorenz curve, Gini coefficient, and needs/service gap or “transportation desert” indicators),2 some of the metrics showed less inequality and smaller areas of “transportation deserts” after the service cuts.3 The service cuts had definitely reduced jobs accessible by a forty-five-minute commute, a measure of transportation access. But the level of equity actually improved when measured with some standard metrics of equitable transportation: Counterintuitively, the spatial extent of the deserts shrinks during the time at which public transit service in the region is the lowest. Indeed, the number of people residing in deserts decreases by about 60,000, or 5%, when public transit service is objectively much worse across the region. This outcome is possible because the method used for quantifying gaps is normalized, giving relative estimates within a single cross section in time. These do not provide meaningful comparisons across time periods. If transit accessibility was reduced uniformly by 50% within every block group, the needs-gap assessment would not change at all.4
In other words, the amount of transit decreased, but the equity metrics focused on how that smaller pie was distributed, failing to capture the way transportation worsened for communities who already had been disadvantaged. The researchers conclude that measuring equitable transportation must include setting a threshold for minimum acceptable levels of accessibility.
The minimum acceptable level of accessibility is an objective measuring stick with which to assess diverse geographic areas and social groups’ access to transportation across time. Having this objective threshold allows planners to set a universal goal and measure progress on equity and access for all groups.
Lorenz Curve and Gini Coefficient
This method is most commonly used in economics and social sciences to graphically represent the distribution of income or wealth inequality (Lorenz curve) and quantify the degree of inequality into a single numerical value (Gini coefficient) within a given study area. Within this context, the cumulative proportion of a transit supply is mapped to the cumulative proportion of the disadvantaged population to create the Lorenz curve. The Gini coefficient is then calculated as the ratio between the area between the curve and the line of equal distribution to the total area under the line of equal distribution. The Gini coefficient will fall between 0 (representing total equality) and 1 (representing total inequality).
The coefficient can be thought of as a global measure that reflects a single condition for an entire study area. Global measures such as the Gini coefficient are relatively simple to interpret and to communicate. On the other hand, global measures tend to be spatially ambiguous. For example, the measure may express the inequality of service within a given city but says nothing about where neighborhoods lacking transit service are located. For spatially discrete approaches, researchers focus on the subdimension of accessibility poverty.
Needs-Gap Analysis
A needs-gap analysis “involves identifying the transit-dependent populations as a measure of transit demand, calculating the transit supply, and then subtracting the supply from the demand to measure the gap.”5 This is often the method for identifying “transit deserts.” In one article, a measure of multimodal supply is constructed using the following metrics:
- Number of transit stops within each block group
- Frequency of transit service within each block group (based on weekday service)
- Number of transit routes within each block group
- Total length of sidewalks (miles) in each block group
- Total length of bike routes (miles) in each block group
- Total length of low-speed-limit roads (miles) in each block group
- Intersection density in each block group
And a measure of demand constructed using the following formula:
Transit-dependent household population = (household drivers) – (vehicles available) * national level carpooling ratio
The needs gap is then measured as Supply (Z score) – Demand (Z score), and the result is mapped to be spatially analyzed to identify areas where demand most outweighs supply.
Targeted universalism is a framework for identifying a universal goal and the targeted strategies needed for achieving that goal for all residents. Sometimes referred to as “Equity 2.0,” this framework helps clarify how social equity is applied in policy analysis, planning, and communications.6 Targeted universalism is defined thus:
Targeted universalism means setting universal goals pursued by targeted processes to achieve those goals. Within a targeted universalism framework, universal goals are established for all groups concerned. The strategies developed to achieve those goals are targeted, based upon how different groups are situated within structures, culture, and across geographies to obtain the universal goal. Targeted universalism is goal oriented, and the processes are directed in service of the explicit, universal goal.7
The primary difference between this framework and other equity frameworks is that targeted universalism measures a groups’ situation in relation to a defined goal, not solely in relation to another group.
There are five steps in a generalized process for applying targeted universalism:
- Establish a universal goal based upon a broadly shared recognition of a societal problem and collective aspirations.
- Assess general population performance relative to the universal goal.
- Identify groups and places that are performing differently with respect to the goal. Groups should be disaggregated.
- Assess and understand the structures that support or impede each group or community from achieving the universal goal.
- Develop and implement targeted strategies for each group to reach the universal goal.
This framework is particularly relevant and useful for planning in an age when transportation systems must evolve to meet multiple goals related to climate change and social equity. For instance, meeting climate goals typically involves increased use of transit by people who own cars and do not experience the harm of inequities. Meanwhile, social equity goals demand improvements for transit-dependent residents with inequitable access. These goals and populations are typically considered separately, with a metric and strategy for increasing transit use by car owners, and a separate strategy and metric for closing the gap in access for transit-dependent residents. Often the two goals are pursued with separate plans, separate projects, and even separate funding. But a more holistic approach to meeting multiple goals and enhancing transportation systems design is possible with a targeted universalism framework. For instance, planners and policymakers may ask themselves, what would a future transportation system look like that had such frequent, high-quality, safe, and accessible transit that residents with cars prefer transit and residents without cars have full mobility and dignity?
Setting overarching goals requires envisioning a transportation system that is meeting these goals in the varied communities in a city or region. A version of this has been achieved in Toronto, where “nearly every Torontonian is within a 15-minute walk of a 24-hour bus route. Virtually every one of the major roads on the city’s grid has a bus route that comes at least every 10 minutes, all day long.”8 Clarity in an overarching aspiration provides a North Star for systems design that exists above particular projects or plans. A system that meets the goals may be qualitatively different from the existing system in that it has services and infrastructure that do not yet exist. Where a focus on closing gaps in access leads to projects that make niche expansions in targeted communities, a systems design approach to meeting a long-term goal may require rethinking the existing services entirely.
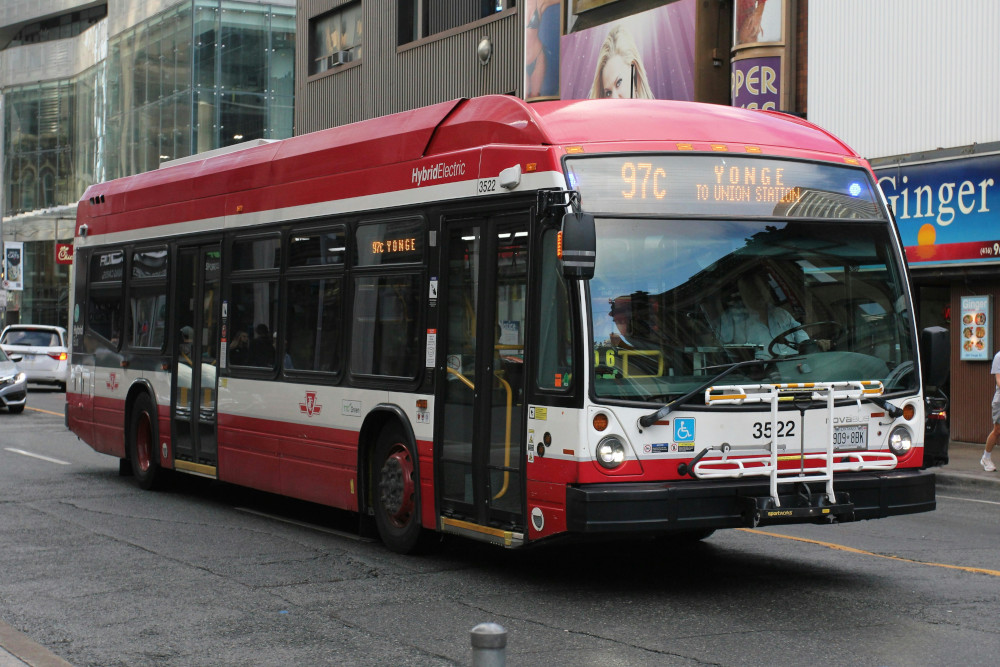
Red bus driving down a street in Toronto, Canada. (Photo by Lennon C. / Unsplash)
Setting overarching goals also assists with determining the resources needed to meet all residents’ needs and provides language for communicating how all residents will benefit from investing those resources in the transportation system. With most transportation agencies struggling to sustain the revenue they need to operate, there is a dire need for new revenue strategies. Where a focus on equity gaps can appeal to communities experiencing inequities, a focus on universal goals and targeted strategies can appeal to both these and more privileged communities, and thus foster broad support. There is also research showing that communications about equity gaps are weaker even for the marginalized communities they aim to benefit because they focus more on the community’s deficits rather than their aspirations and possibilities.
The reality of transportation planning is that it entails multiple agencies and varied plans focused on everything from pedestrian safety to capital projects, transit service plans, land use zoning, and beyond. The nesting of these plans and the communication channels and practices to ensure that they “talk to each other” and are implemented is essential to achieving equitable transportation. For instance, a pedestrian safety plan identifies areas where streets can be upgraded for safe crossing, and a bike plan can identify which streets should be improved to accommodate cycling, but the primary work on these streets is done by a public works agency concerned with street pavement. The interagency coordination is essential so that projects involving these streets incorporate the relevant plans. A set of long-term goals, with objective thresholds for minimum acceptable levels of access, can provide an overarching framework for connecting varied plans and projects, assessing their impact, and not losing sight of what they need to add up to.
Defining a minimum acceptable level of transportation access is as much an ethical as it is a technical decision, so it must involve people who have the most at stake in reaching this level of access. As any good planner knows, equity is not just about the outcomes or impact of planning, but about the planning process itself. Who is engaged in the planning will always shape what is implemented, thus the saying: “nothing about us without us.” Engaging the groups whose transportation access is furthest from the universal goal, often called “priority populations” or “marginalized communities,” means addressing the barriers that have kept them from fully participating and facilitating their involvement with engagement strategies tailored to their community. This often looks like going to the social spaces and organizations where these community members already gather, offering food and childcare and language interpretation, hiring staff that come from these communities, and investing the necessary time and resources so that the technical aspects, planning process, and decision points are easy to understand for people without formal training. Most importantly, it provides clarity about when and how the planning process will be accountable to residents’ input, through tools like the Spectrum of Public Participation.
Research Process and Methods
While assisting awardees of the Sustainable Transportation Equity Project’s (STEP’s) Planning and Capacity Building Grant with technical assistance,9 the team noted that the number one question and support requested by the grantees was on data collection. Many of the grantees expressed having difficulty understanding and knowing what data needed to be collected to better understand the transportation needs in the community through an equitable lens. The underlying question was, how do you measure equity?
Based on the observations during the technical assistance, the Othering & Belonging Institute (OBI) team decided to dive deeper to better understand how equity within transportation planning is being discussed and measured. This report is the first iteration of that deep dive.
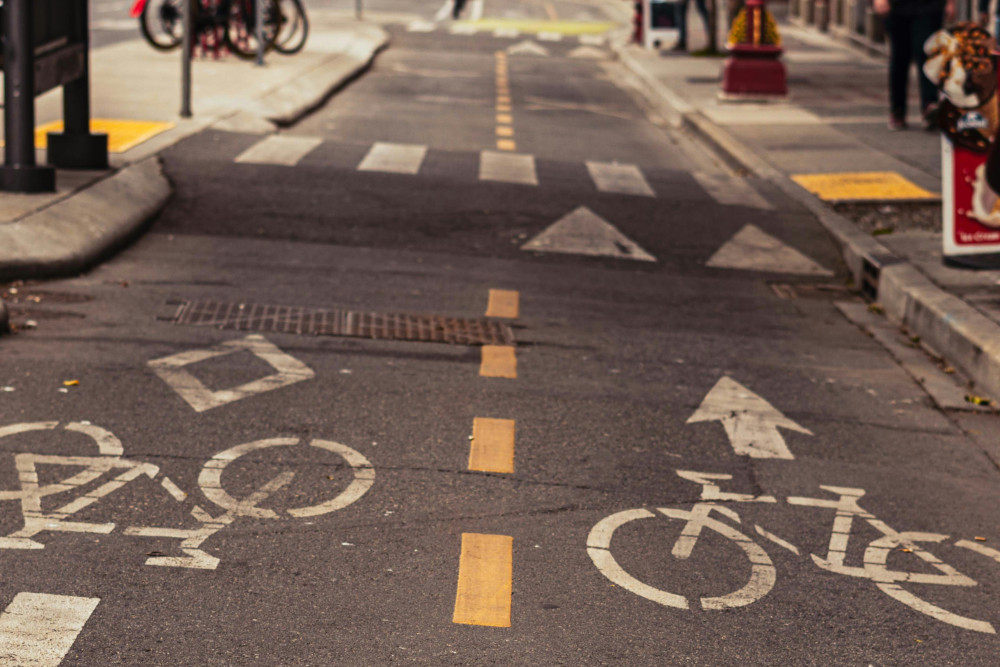
Bicycle lanes in Fan Tan Alley, British Columbia, Canada. (Photo by Jasper Garratt / Unsplash)
To complement the insights from practitioners, we reviewed professional reports, academic articles, and online dashboards that provide guidance on metrics for equitable transportation. Using these sources to understand the state of the field of practice, we identified four domains for measuring equity:
- priority populations
- accessibility
- safety and health
- financial burden and funding equity
These domains were identified as common topic areas for equity in transportation planning. We then gathered examples of transportation equity metrics and grouped them into the four domains as an inventory of potential metrics.
To gather insight on the inventory of metrics, the research team conducted three focus groups, where we presented the metrics and facilitated structured discussion with practitioners. The focus groups were held in Los Angeles, Fresno, and Oakland. Each group had ten to fifteen participants, including transportation advocates, transportation planning professionals, and leaders that have experienced and work with other leaders that have experienced transportation inequities.10
Each participant received a copy of the draft inventory and a brief overview of the work, and engaged in a discussion assessing the validity of the metrics proposed and their application to the work that each community member carried out. Below is a list of questions asked to each participant:
- Which metrics do you use? Why those?
- Which metrics are most relevant to the communities you are part of? What are the barriers or limits of using these metrics?
- What domains and metrics are not here that should be?
- Is there a lived experience or phenomenon that you want to measure but haven’t been able to?
- Do these metrics align with what matters in the community? Do they capture the lived experience and necessities of the community?
Participants engaged in an open conversation facilitated by OBI staff. All comments and feedback were recorded on paper by OBI staff assigned as notetakers. Once comments were collected, the OBI team met to discuss and analyze the comments. The OBI team decided to integrate comments into the critical discussion section of this report.
Inventory of Transportation Equity Metrics
The inventory includes commonly used metrics from professional reports, academic articles, and online dashboards that provide guidance on equitable transportation metrics. This inventory is not intended to be comprehensive, nor does it suggest best practices for measuring transportation equity. Instead, it aims to catalog common approaches to measuring transportation equity, focusing on metrics that are relatively accessible to a wide audience. More complex analytical approaches, such as transportation and land use models, which can also generate equity metrics, were omitted to ensure that the metrics and examples would be approachable to all focus group participants, not just those with technical transportation backgrounds. The inventory is designed to be a reflection tool for critically discussing how equity is typically measured in transportation.
|
Dimension |
Measure |
Example |
|
Priority Populations |
1. Census tract share of people of color |
The Metropolitan Transportation Commission (MTC) uses specific thresholds for each of the listed measures to determine census tracts with moderately above-average equity needs. According to MTC’s definition, 20% of total census tracts in the Bay Area are considered to be equity priority communities.11
|
|
2. Census tract share of low income (less than 200% federal poverty level) |
||
|
3. Census tract share of limited English proficiency |
||
|
4. Census tract share of zero-vehicle households |
||
|
5. Census tract share of seniors 75 years and over |
||
|
6. Census tract share of people with a disability |
||
|
7. Census tract share of single-parent families |
||
|
8. Census tract share of severely rent-burdened households |
||
|
Accessibility |
1. Total accessible jobs, childcare seats, park space (in acres) by mode of transportation |
On average, households can access 78,650 jobs within a 30-minute transit commute in Fresno.12 |
|
2. Travel time to urgent care facilities, hospitals, pharmacies, colleges and universities, supermarkets, early voting locations by mode of transportation |
In the Bay Area, the average travel time on transit to early voting locations for the Black population is 53 minutes.13 |
|
|
3. Ratio of transit-to-auto access |
3.4% of total jobs reachable by automobile within 45 minutes are also reachable by public transit within the same time frame in the Los Angeles region.14 |
|
|
4. Total/share of population near high-frequency transit |
77% of households in Oakland live within a half mile of high-frequency transit.15 |
|
|
5. Total/share of Low-Income Housing Tax Credit (LIHTC) buildings near transit |
92% of LIHTC buildings (28 buildings in total) in Bakersfield are located within a half mile of a transit stop.16 |
|
|
6. Total/share of car-share locations near transit |
There are 31 car-share locations within a half mile of a transit stop in San Jose.17 |
|
|
7. Total/share of bike-share locations near transit |
There are 337 bike-share locations within a half mile of a transit stop in San Francisco.18 |
|
|
Safety and Health |
1. High-injury networks |
In Los Angeles, 65% of all deaths and severe injuries involving pedestrians occur on just 6% of the street network.19 |
|
2. Fatalities per 100 million passenger miles by mode of transportation (passenger death rate) |
In the United States in 2022, the passenger death rate for automobiles was 0.54. Contrastingly, the passenger death rate for buses was 0.004.20 |
|
|
3. Traffic proximity and volume (traffic exposure) |
Census blocks with traffic proximity and volume at or above the 80th percentile could be considered to have high traffic exposure.21 |
|
|
4. Crashes resulting in injuries or fatalities weighted by highest level of injury (crash exposure) |
Census blocks with injury-weighted crashes at or above the 80th percentile could be considered to have high crash exposure.22 |
|
|
5. Diesel particulate matter exposure |
Areas with diesel particulate matter exposure above the 90th percentile could be considered to be pollution burdened.23 |
|
|
6. Total/share of extreme commuters (travel time greater than 90 minutes each way) |
In the Bay Area, about 4.6% of commuters are extreme commuters.24 |
|
|
Financial Burden and Funding Equity |
1. Per rider subsidy by type of transit |
AC Transit passengers receive a subsidy of public funds of $2.78 per trip, whereas BART passengers receive $6.14, and Caltrain passengers received $13.79.25 |
|
2. Total/share of riders by transit mode |
In 2019, LA Metro bus ridership was 92.4% people of color and 7.6% white.26 |
|
|
3. Total/share of workers who commute by different transportation modes (e.g., driving, carpooling, walking, bicycling, micromobility, public transit) |
In the Bay Area, 54.8% of workers drive alone to work, 24.9% work from home, 8.6% carpool, 5.5% use transit, and 3.2% walk.27 |
|
|
4. Percent of income spent on transportation costs |
In the United States, lower income households spend roughly 30% of their after-tax income on transportation.28 |
Critical Discussion of Metrics
What are the strengths and weaknesses of different metrics for equitable transportation? How do these metrics fit into a targeted universalist approach to transportation planning? What is missing and should be added to the metrics inventory? The following discussion explores these questions by weaving together what we heard in the Research on the Road Residencies workshops and what we found in our review of professional and academic literature and data tools.
While participants appreciated the categorization of the four domains in the metrics inventory, they advocated for more interconnectedness between domains and different transportation modalities. For example, the metrics used to measure accessibility are defined differently based on modality: vehicles, active transportation, micromobility, and/or pedestrians. Participants proposed a “supradomain” for modality that would overlay the other domains.
Priority Populations
A common step in measuring transportation equity is identifying transportation disadvantaged groups, which becomes the basis for analyzing potential inequities and guiding targeted investments or improvements.29 In equity analyses, historically marginalized groups are often categorized, using labels like equity priority communities, disadvantaged groups, or priority populations, and outcomes for these groups are measured relative to other segments of the population. For instance, the Caltrans Transportation Equity Index identifies areas with high percentages of low-income residents or tribal lands, and then analyzes the transportation conditions in these areas.30
Although definitions of disadvantage vary across studies, they often encompass common socioeconomic and needs-based factors that can reflect the intersections of race, ethnicity, income, transportation cost burden, household vehicle availability, age, disability, employment status, gender, language fluency, immigrant status, and single- parent status.31,32 While these different groups rely on the same transportation system and depend on the same institutions, they may experience profoundly different situations and transportation experiences. For instance, low-income residents may experience unreliable transit options, while seniors may struggle with physical accessibility challenges. In a targeted universalism framework, simply grouping these populations together as “disadvantaged” is inadequate; instead, it is necessary to assess how each group is situated relative to a universal goal. Limited data can also obscure populations who face unique transportation challenges, such as formerly incarcerated people or people who are unsheltered. In these cases, direct community engagement and qualitative input is essential.
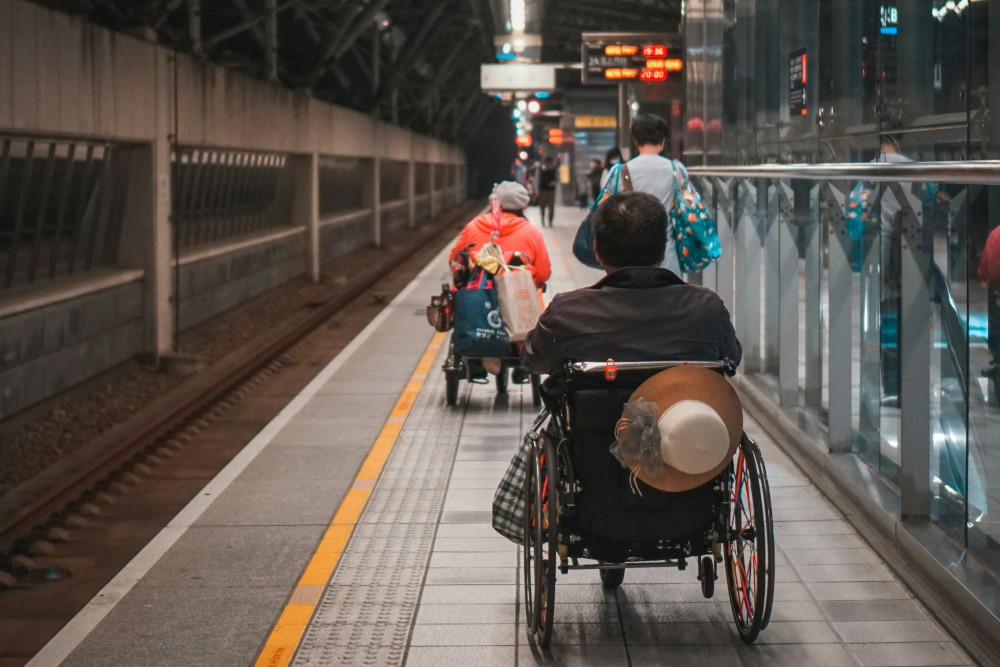
Wheelchair riders on a train station platform in Taichung, Taiwan. (Photo by Lisanto / Unsplash)
Participants in our workshops appreciated that these metrics are helpful in understanding local areas within regions but that transportation differences across regions also need to be considered. For example, participants in Fresno expressed that “while urban areas like Los Angeles and the Bay are hoping for the ecosystem to work, folks in rural areas are hoping to build an ecosystem.” Some modality options like public transit may not work in communities that lack the infrastructure, and thus driving or ride-share is their only option.
Accessibility
Transportation planning is undergoing a paradigm shift from mobility-based to accessibility-based planning.33 Mobility-based analysis has evaluated performance based on factors such as vehicle travel speeds, focusing on metrics that capture level of service and congestion delay. Alternatively, accessibility-based analysis is focused on access to key destinations and services, such as places of employment, health-care facilities, and schools, emphasizing nonauto modes of transportation, system connectivity, development density, and affordability.34 While this shifting of focus in transportation planning and research is critical to evaluating equity for marginalized groups, accessibility can be measured in a variety of different ways.
Participants in our workshops named an aspect of equitable access that is rarely measured in transportation metrics: jurisdictional fragmentation. Community needs and transportation improvement often exceed city boundaries and may spill over into county lines. They also often cross the lines of authority of different agencies, such as the need for public works or other agencies that were not included in the proposed scope of work. Participants expressed the importance of communicating and jurisdictional limitations to community members, which should be included in the metrics inventory.
Measuring accessibility inequality in public transit is common in transportation research.35,36,37 Accessibility inequality refers to a systemic condition in which some socioeconomic groups have lower access to transportation than others,38 and the conventional equity metric is the Lorenz curve and Gini coefficient. In application, this approach can be used to measure the inequality (not equity) in transit service supply relative to multiple groups. The Lorenz curve and Gini coefficient would allow someone to make a conclusion such as “70% of the population was delivered only 20% of the supply,” indicating that the provision of service is unequal. This highlights an advantage of the Lorenz curve and Gini coefficient in that they provide a straightforward sense of transit equality across an entire area of interest.
Accessibility poverty is a related but conceptually distinct approach to measuring accessibility. It refers to the condition in which a person’s ability to access essential destinations is so low that they are unable to fulfill basic needs, and it often focuses on public transit. Accessibility poverty is commonly measured through approaches referred to as “needs gap” or “transit desert” because they attempt to identify areas where the transit demand is significantly greater than the supply. Unlike the Lorenz curve and Gini coefficient, needs-gap analyses provide information at the neighborhood level, allowing for simplistic comparisons of transit supply and demand across space.39,40

Braille sign at a Bay Area Rapid Transit station. (Photo by Levi Meir Clancy / Unsplash)
Yet another approach to measuring accessibility is cumulative accessibility. Cumulative accessibility metrics typically capture a total number of opportunities (e.g., jobs, schools, day care, or health-care facilities) one can reach within a specified time limit using different transportation modes. At the time of this report, cumulative accessibility measures are available in multiple publicly available analytical tools, such as the Metropolitan Chicago Accessibility Explorer,41 the Environmental Protection Agency’s Access to Jobs and Workers Via Transit mapping tool,42 the TransitCenter Equity Dashboard,43 and the Caltrans Transportation Equity Index (EQI)44 tool. The EQI tool, for example, measures multimodal access to destinations as the ratio between nonauto access (transit, walking, or bicycling) to auto access, identifying geographies with comparatively worse multimodal accessibility.45
Cumulative Access
One approach calculates cumulative accessibility for both automobile and public transit, focusing on access to manufacturing and service jobs, two important job types for lower-skilled workers.46 An access ratio is calculated as the ratio of transit access to job access, where a ratio of 0.33 would imply that transit users have access to one-third of the number of jobs accessible by car. Access ratios are then combined with socioeconomic and needs-based factors (priority population) to identify areas with high shares of transit-dependent populations and low access ratios.
Disadvantages of this include its sensitivity to boundary effects, and that competition (i.e., passenger capacity) is not accounted for within trip origins, nor is competition typically controlled for in terms of destinations (e.g., competition in the labor market).
There are several challenges related to the accessibility measures discussed above. The first is that these comparative approaches focus on how accessibility is distributed between different geographies/socioeconomic groups and may fail to capture whether transportation improves or worsens for disadvantaged groups over time. Additionally, a threshold of acceptable accessibility is rarely defined,47 and when it is defined, it is difficult to determine what should be considered a reasonable threshold. The EQI tool, for example, designates census blocks with a transit-to-auto access ratio below 0.12 as having poor relative transit access to destinations. A census block could theoretically have an access ratio of 0.13, just above the threshold, but does that mean adequate accessibility has been achieved? Thresholds used in equity metrics can often feel arbitrary, especially when thresholds are not explicitly tied to a program or policy goal.
Safety and Health
Measures of safety and health in transportation equity are often focused on the grim realities of traffic-related injuries and death, or negative externalities of the transportation sector such as air pollution. Traffic exposure in a community might be measured by counting transportation-related injuries or fatalities in a given area.48 Communities experiencing disparate environmental burden can be identified by measuring concentrations of diesel particulate matter.49 Excess commuting, which is associated with negative health effects,50 can be measured as the number or share of workers in a given community whose commute is ninety minutes or more in each direction. A comprehensive approach to transportation equity must include health and safety as central pillars, recognizing that communities already facing systemic disadvantages are disproportionately impacted by the transportation sector’s negative health and safety outcomes.
Participants in our workshops highlighted additional aspects of healthy transportation, pointing out that the metrics inventory does not account for the user experience of public transit riders, including bus shelter conditions, shading, and benches. One participant proposed “the logistics of waiting” as a new domain.
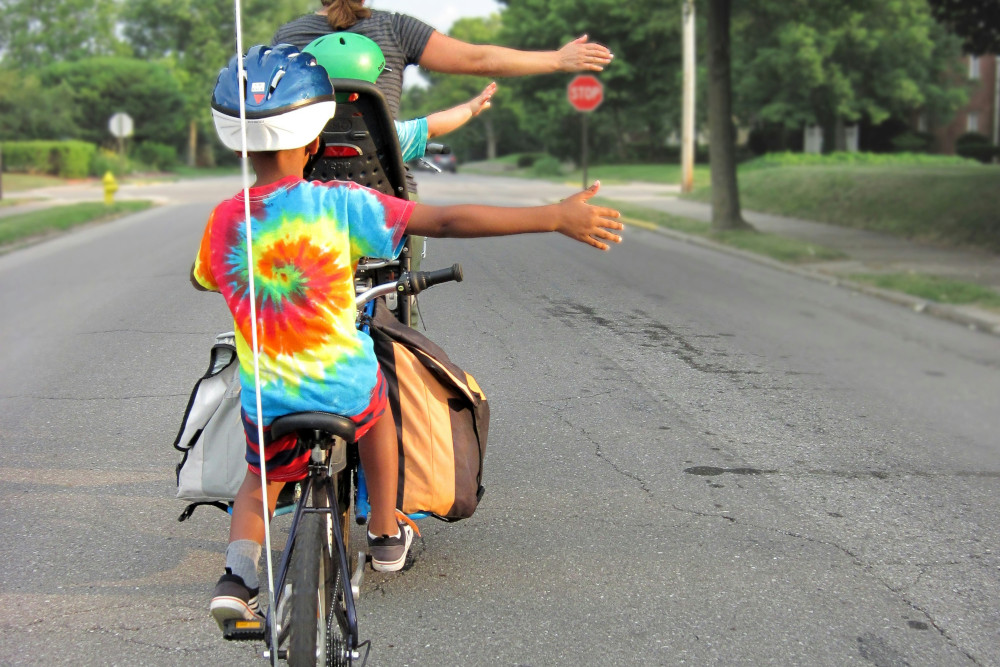
An adult, a baby, and a child riding on a two-person bike while practicing hand signals for safety in Richmond, IN. (Photo by Mark Stosberg / Unsplash)
An important framework for prioritizing safety and health in transportation equity efforts is the Vision Zero campaign.51 Vision Zero is especially relevant because it aligns well with the principles of targeted universalism, focusing on reducing harm for everyone while addressing specific needs within vulnerable communities. The campaign, which began in Sweden in the 1990s, aims to eliminate traffic fatalities and severe injuries while promoting safe, healthy, and equitable mobility.52 Since then, Vision Zero has been adopted widely across the United States, including by thirteen cities in California that have established their own Vision Zero programs or policies.53
Vision Zero aligns well with a generalized approach of targeted universalism:
- A clear goal of eliminating traffic fatalities and severe injuries while increasing safe, healthy, equitable mobility is established.
- General population performance is measured relative to the universal goal. This usually means counting the number of severe injuries and fatalities according to different modes of transportation across a given city.
- Groups and places that are performing differently with respect to the goal are identified. This is most often done by identifying high-injury networks (HINs), represented by street segments with high numbers of fatalities and severe injuries. HINs are typically mapped and overlaid with socioeconomic measures (e.g., disadvantaged communities) to assess the distribution of HINs from an equity perspective.
- Structures that support or impede each community from achieving the universal goal are assessed. This might look like assessing how protected bike lanes or streets with excessive automobile speeds are distributed across different types of communities.
- Targeted strategies for each community to reach the universal goal are developed and implemented. In Vision Zero, this could be geographically targeted speed management in HINs, as well as development of a comprehensive active transportation network to encourage shifting away from reliance on automobiles.
This process played out in San Francisco, where Vision Zero was adopted as policy in 2014.54 Since adoption, the Department of Public Health has tracked and reported on severe traffic injuries over time, showing that the city overall continues to experience significant traffic fatalities and severe injuries. The Department of Public Health and the San Francisco Municipal Transportation Agency develop and update a HIN map.55 When overlaid with “equity priority communities”56 as defined by the Bay Area’s Metropolitan Transportation Commission, the map demonstrates that HINs are overrepresented in these communities. The HIN map and methodology57 guide the city’s efforts, helping to target investments in engineering, education, and enforcement, where they will most effectively reduce fatalities and severe injuries.58
San Francisco’s Vision Zero policy demonstrates both the potential and challenges of achieving safe, equitable mobility. While these targeted interventions help direct resources where they’re most needed, persistent traffic injuries highlight the need for deeper structural changes. As more cities adopt Vision Zero, examples from cities like Oslo and Helsinki—which recorded zero or nearly zero traffic fatalities in 2019—can offer valuable insights on reducing traffic harm and creating healthier, more livable cities.59
Financial Burden and Funding Equity
Understanding who is burdened most by transportation costs and how it intersects with other forms of systemic disadvantage is key to measuring and evaluating transportation equity. According to the US Department of Transportation, “transportation cost burden” refers to households that spend more than 15% of their annual income on transportation and/or 45% or more of their income on transportation and housing costs combined.60 Intertwined with transportation cost burden is where a household can afford to live, how far they travel to work or other necessary destinations, and what mode of travel they rely on to get there. The cost of transportation to the user is largely dependent on the amount of subsidy supporting the mode of transportation, whether this is public funding of freeways or of a bus or metro system. The size of the fees to users is proportional to the amount of subsidy provided.
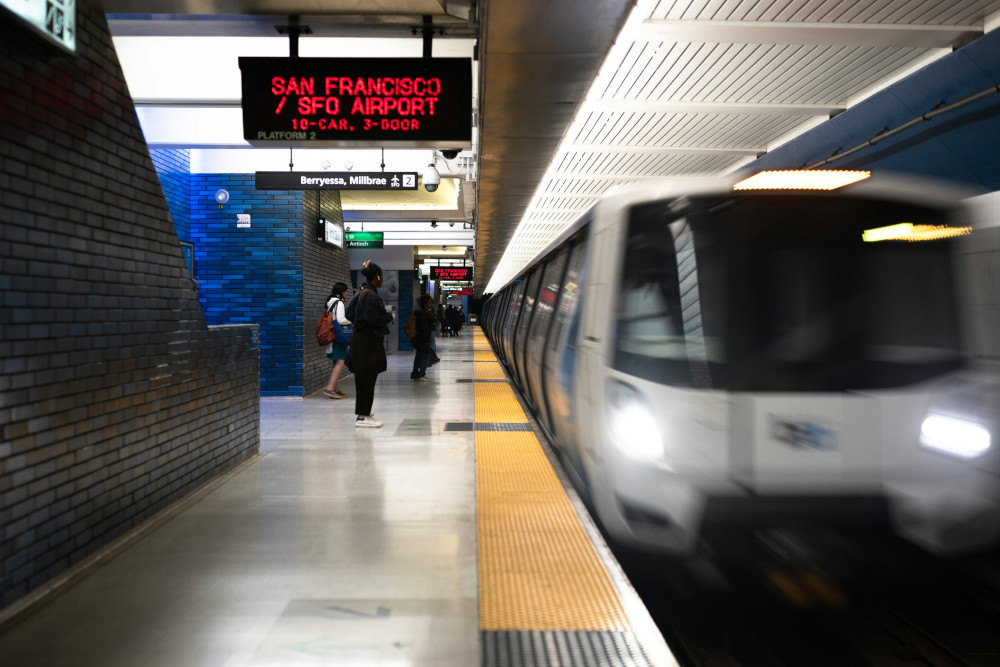
Travelers stand on a Bay Area Rapid Transit platform as a train leaves the station. (Photo by Derek Zhang / Unsplash)
Central to transportation equity is how public funds are allocated to different types of projects and who benefits from those investments. There have been several high-profile examples of discriminatory funding practices in public transit infrastructure in California. In LA, the Bus Riders Union filed a civil lawsuit against the Metropolitan Transit Authority (MTA) in 1994 claiming that funding of commuter light-rail predominately served and benefited white suburbs at the expense of bus service mostly used by LA’s low-income communities of color.61 In the Bay Area, Darensburg v. Metropolitan Transportation Commission was filed in 2005, claiming a very similar scenario of underfunding bus service used predominantly by people of color in favor of expensive commuter rail projects where white passengers were overrepresented.62,63 In both cases, funding equity could be measured and evaluated by combining ridership’s socioeconomic data with per rider subsidy for different transit modes. One study summarized the subsidy disparity in the LA MTA case as follows:
While 94% of MTA’s riders rode buses, MTA customarily spent 60–70% of its budget on rail. Data in 1992 revealed a $1.17 subsidy per boarding for an MTA bus rider. The subsidy for a Metrolink commuter rail rider was 18 times higher, however ($21.02). For a suburban light-rail streetcar passenger, the subsidy was more than nine times higher ($11.34); and for a subway passenger, it was projected to be two-and-a-half times higher ($2.92).64
These high-profile cases underscore the critical role of funding allocation in shaping transportation equity outcomes. Disparities in public subsidies across different transportation modes and projects not only influence the cost burden on riders but also reflect broader patterns of systemic inequities that disproportionately impact low-income communities and communities of color. STEP demonstrates equitable funding practices through initiatives such as the West Oakland STEP65 and the South Los Angeles Universal Basic Mobility Pilot Program,66 but designing the necessary metrics to evaluate them requires addressing similar challenges in defining meaningful thresholds as previously discussed in this report. These thresholds should be designed to advance broader societal goals, including reducing transportation cost burden to the extent that all communities have the opportunity to build toward long-term economic mobility and stability.
Conclusions and Recommendations
Measuring equity must be about more than closing gaps between groups; it should measure progress toward a universal goal with targeted strategies set through a participatory process. This requires setting a threshold for minimum acceptable levels of progress toward the goals, which provides a measuring stick that can assess progress across time for diverse geographic areas and social groups. Setting this threshold is a moral not just technical decision that must be supported by community participatory planning and research.
Without these elements, equity metrics risk focusing on how resources are divided, overlooking whether the overall pie is shrinking. This has the potential of leaving disadvantaged communities objectively worse off overall, even if their share of the pie is larger. Targeted universalism provides a framework for measuring each groups’ situation in relation to a defined goal, not solely in relation to another group. Determining universal goals and targeted strategies can align varied plans, departments, and projects, and communicate with the public a compelling vision of the future that justifies support and illuminates the scale of funding needed overall.
Transportation intersects with people’s lives in a wide range of meaningful ways, so the consideration of equity must be done in multiple domains: priority populations, accessibility, safety and health, and financial burden and funding equity. Defining priority populations brings into focus the groups of people with unique transportation experiences and needs to understand their particular relation to universal goals and their visions for strategies to reach those goals. The domain of accessibility illuminates how well the system enables residents to arrive from origins to destinations. Safety and health includes exposure to traffic accidents and pollution, but also interpersonal safety and appropriate protection from weather. Financial burden and funding equity considers how the costs of sustaining transportation are distributed through interdependent systems of revenue generation like fares, fines, and subsidies.
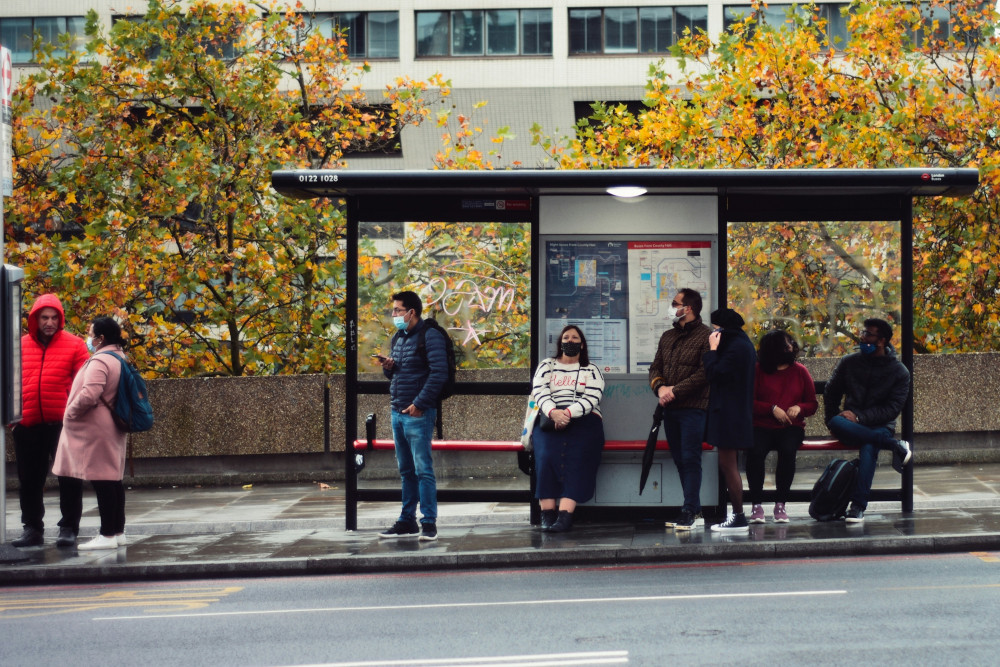
People wait at a bus stop in London. (Photo by Sandy Ravaloniaina / Unsplash)
Too often transportation planning goals are narrowed based on assumptions about available funding, voter support, and other factors. Yet the imperatives of stabilizing the climate and ensuring social equity require bold transformation that reaches beyond these limits. A general retreat from articulating universal goals leads planners and advocates to settle for niche improvements with limited impact, which then fail to inspire broader support for the broader transformation needed. Hope requires a belief that there is a feasible pathway to a better future, and transportation leaders can build hope by articulating what this future scenario looks like and what strategies it would require, with all the necessary support in place.
Rather than a list of recommendations, we end this report with a hypothetical example of transportation planning with equity metrics reflecting the lessons from this research:
A partnership of community groups and a transportation agency facilitate a year-long planning process that sets an overarching goal for their region, a specific threshold for minimum accessibility, and targeted strategies for equitable progress. The goal is “all residents can safely reach their workplace, health-care facility, and a grocery store safely and affordably within thirty minutes using public transit.”
Performance in the general population is measured relative to this goal by calculating each worker’s travel time if they used public transit. To understand how different groups and locations are performing, this metric is disaggregated by socioeconomic characteristics and areas with varying levels of transit accessibility. Geographic areas and social groups with transit commutes of over forty-five minutes are prioritized.
The planning collaborative creates a community advisory committee made up of leaders from the priority geographic areas and social groups. The collaborative works with the advisory committee to design and carry out a survey, community workshops, and interviews to understand the particular transportation needs and visions of the priority communities. Each engagement invites input on health and safety, affordability and financing, accessibility, and open-ended inquiries about transportation challenges and needs. This process generates insights into the targeted strategies needed for priority communities to reach the goal, as well as metrics that will provide meaningful measures of progress.
The planning collaborative and community advisory committee do an analysis of the existing financing, plans, infrastructure, and other elements of the transportation system to identify the barriers and opportunities to achieving the universal goal with the targeted strategies. For example, these could include the unequal distribution of transit infrastructure or a shortage of affordable housing near job centers, among other interconnected factors. The collaborative interviews agency staff, elected officials, scholars, advocates, and others to understand the bottlenecks and opportunities for improving transportation systems in the region.
The collaborative and advisory committee drafts a plan that leads with an inspiring description of how life in the region could be if the universal goals are achieved. The plan presents stories and data on the transportation challenges facing communities within the region, the faults in existing systems, and the proposed pathways forward. These pathways include details on the funding needed, potential revenue strategies, partnerships, and policy changes.
The collaborative and advisory committee continue their work by bringing the plan for discussion with the priority communities and other parts of the region. They partner with artists and media leaders to create and distribute creative expressions of the stories and visions in the plan. As the planning collaborative finishes its work, some of its members form a coalition to launch a campaign for a new revenue measure that would fund equitable transportation in the region.
Endnotes
- American Planning Association, “Knowledge Base Collection: Social Equity” (2024), https://www.planning.org/knowledgebase/equity/.
- These and other metrics are defined and discussed in the explainer box “Lorenz Curve and Gini Coefficient.”
- Alex Karner, Rafael H. M. Pereira, and Steven Farber, “Advances and Pitfalls in Measuring Transportation Equity,” Transportation, January 12, 2024, https://doi.org/10.1007/s11116-023-10460-7.
- Karner, Pereira, and Farber, “Advances and Pitfalls in Measuring Transportation Equity.”
- Junfeng Jiao, “Identifying Transit Deserts in Major Texas Cities Where the Supplies Missed the Demands,” Journal of Transport and Land Use 10, no. 1 (2017): 529–540, https://rosap.ntl.bts.gov/view/dot/41808#tabs-2.
- john powell, Stephen Menendian, Wendy Ake, “Targeted Universalism Policy and Practice,” Othering & Belonging Institute (2019), https://belonging.berkeley.edu/targeted-universalism.
- powell et al., “Targeted Universalism Policy and Practice,” 5.
- Jonathan English, “Why Public Transportation Works Better Outside the US,” Bloomberg, October 10, 2018, https://www.bloomberg.com/news/articles/2018-10-10/why-public-transportation-works-better-outside-the-u-s.
- The Othering & Belonging Institute (OBI) received funding from the California Air Resources Board to conduct a program evaluation of their two pilot equity projects: the Clean Mobility Options Voucher Pilot Program and the Sustainable Transportation Equity Project (STEP). As part of the research project, OBI also provided technical assistance to eight of the STEP grant recipients; this memo is part of that body of work.
- Based on a list of community partners, elected officials, transportation planning practitioners, and consulting firms in the following regions: Los Angeles, Fresno, the Bay Area, and Sacramento. An invitation email was sent out, and fifteen to twenty participants were selected to participate in each project area.
- “Equity Priority Communities (EPCs): 2024 EPCs and Re-Envisioning for the Future,” MTC Policy Advisory Council, accessed November 16, 2024, https://mtc.ca.gov/sites/default/files/meetings/attachments/6115/7aii_24_1152_PowerPoint_Attachment_A_2024_EPCs_Comments.pdf.
- “AllTransit,” AllTransit, accessed November 16, 2024, http://alltransit.cnt.org/metrics/.
- “Chart Builder—TransitCenter Equity Dashboard: Average Access to Early Voting Locations in San Francisco Bay Area,” TransitCenter, accessed November 16, 2024, https://dashboard.transitcenter.org/charts?region=SFO&area=urban&period=WEDAM&opportunity=early_voting&tripOption=t1&autoRatio=false&affordableTrips=false.
- “Chart Builder—TransitCenter Equity Dashboard: Transit vs Auto average Access to Employment in Los Angeles,” TransitCenter, accessed November 16, 2024, https://dashboard.transitcenter.org/charts?region=LA&area=urban&period=WEDAM&opportunity=C000&tripOption=c45&autoRatio=true&affordableTrips=false.
- “AllTransit.”
- “AllTransit.”
- “AllTransit.”
- “AllTransit.”
- Vision Zero Los Angeles—Eliminating Traffic Deaths in Los Angeles by 2025, (City of Los Angeles, 2015).
- “Deaths by Transportation Mode,” Injury Facts (blog), accessed November 16, 2024, https://injuryfacts.nsc.org/home-and-community/safety-topics/deaths-by-transportation-mode/.
- “Caltrans Transportation Equity Index (EQI) V.1 Documentation,” Caltrans, March 1, 2024.
- “Caltrans Transportation Equity Index (EQI) V.1 Documentation.”
- “CalEnviroScreen 4.0,” n.d.
- “Extreme Commuting,” Bay Area Equity Atlas, accessed November 16, 2024, https://bayareaequityatlas.org/indicators/extreme-commuting?geo_compare=02000000000006000.
- Keith Carson, “Alameda County Urges MTC to Halt Funding Bias against East Bay Bus Riders,” n.d., https://district5.acgov.org/wp-content/uploads/sites/8/2021/07/busriders.pdf.
- Madeline Brozen, Silvia Gonzalez, and Tamika Butler, Measuring Equity in Public Transit Service LA Metro and the Post-Decree Era, (Pacific Southwest Region University Transportation Center, December 1, 2022).
- “Commute Mode Choice—Vital Signs—SF Bay Area,” Vital Signs, accessed November 16, 2024, https://vitalsigns.mtc.ca.gov/.
- “The Household Cost of Transportation: Is It Affordable?” Bureau of Transportation Statistics, accessed November 16, 2024, https://www.bts.gov/data-spotlight/household-cost-transportation-it-affordable.
- Nicole Foth, Kevin Manaugh, and Ahmed M. El-Geneidy, “Towards Equitable Transit: Examining Transit Accessibility and Social Need in Toronto, Canada, 1996–2006,” Journal of Transport Geography 29 (May 2013): 1–10, https://doi.org/10.1016/j.jtrangeo.2012.12.008.
- “Caltrans Transportation Equity Index (EQI) Story Map,” Caltrans Office of Equity, Sustainability, and Tribal Affairs, March 1, 2024, https://storymaps.arcgis.com/stories/026e5870d5e64c1ea1c5ff339edd5331.
- Phillip R. Carleton and J. David Porter, “A Comparative Analysis of the Challenges in Measuring Transit Equity: Definitions, Interpretations, and Limitations,” Journal of Transport Geography 72 (October 1, 2018): 64–75, https://doi.org/10.1016/j.jtrangeo.2018.08.012.
- Na Chen and Chih-Hao Wang, “Does Green Transportation Promote Accessibility for Equity in Medium-Size U.S. Cities?” Transportation Research Part D: Transport and Environment 84 (July 2020): 102365, https://doi.org/10.1016/j.trd.2020.102365.
- Chen and Wang, “Does Green Transportation Promote Accessibility for Equity.”
- Todd Alexander Litman, “Evaluating Transportation Equity,” October 9, 2024.
- Karner, Pereira, and Farber, “Advances and Pitfalls in Measuring Transportation Equity.”
- Carleton and Porter, “A Comparative Analysis of the Challenges in Measuring Transit Equity.”
- Chanwoon Park and Justin S. Chang, “Spatial Equity of Excess Commuting by Transit in Seoul,” Transportation Planning and Technology 43, no. 1 (January 2, 2020): 101–12, https://doi.org/10.1080/03081060.2020.1701760.
- Karner, Pereira, and Farber, “Advances and Pitfalls in Measuring Transportation Equity.”
- Carleton and Porter, “A Comparative Analysis of the Challenges in Measuring Transit Equity.”
- Wei (David) Fan and Yang Li, “Using General Transit Feed Specification (GTFS) Data as a Basis for Evaluating and Improving Public Transit Equity,” Department of Civil and Environmental Engineering, University of North Carolina at Charlotte, September 1, 2019, https://rosap.ntl.bts.gov/view/dot/61594.
- “Metropolitan Chicago Accessibility Explorer,” Urban Accessibility, accessed April 17, 2024, http://www.urbanaccessibility.com/.
- Kevin Ramsey and Alexander Bell, “EPA—Access to Jobs and Workers via Transit,” (US EPA’s Office of Sustainable Communities, 2014), https://www.epa.gov/sites/default/files/2014-03/documents/sld_trans45_ug_0.pdf.
- “Home—TransitCenter Equity Dashboard,” TransitCenter, accessed April 17, 2024, https://dashboard.transitcenter.org/.
- “Caltrans Transportation Equity Index (EQI) Version 1.0 Web Map,” Caltrans, accessed November 6, 2024, https://caltrans.maps.arcgis.com/apps/webappviewer/index.html?id=ab02f124b3f54007a59dadf2165d21fc.
- “Caltrans Transportation Equity Index (EQI) V.1 Documentation.”
- Aaron Golub and Karel Martens, “Using Principles of Justice to Assess the Modal Equity of Regional Transportation Plans,” Journal of Transport Geography 41 (December 2014): 10–20, https://doi.org/10.1016/j.jtrangeo.2014.07.014.
- Jeff Allen and Steven Farber, “Planning Transport for Social Inclusion: An Accessibility-Activity Participation Approach,” Transportation Research Part D: Transport and Environment 78 (January 2020): 102212, https://doi.org/10.1016/j.trd.2019.102212.
- “Caltrans Transportation Equity Index (EQI) V.1 Documentation.”
- “CalEnviroScreen 4.0,” n.d.
- Thomas J. Christian, “Trade-Offs between Commuting Time and Health-Related Activities,” Journal of Urban Health 89, no. 5 (October 2012): 746–57, https://doi.org/10.1007/s11524-012-9678-6.
- “What Is Vision Zero,” Vision Zero Network, accessed May 9, 2024, https://visionzeronetwork.org/about/what-is-vision-zero/.
- “What Is Vision Zero.”
- “Vision Zero Communities,” Vision Zero Network (blog), accessed November 4, 2024, https://visionzeronetwork.org/resources/vision-zero-communities/.
- “Equity—Social Equity Is at the Core of Vision Zero,” Vision Zero SF, January 24, 2015, https://www.visionzerosf.org/equity/.
- “Vision Zero High Injury Network: 2022,” City and County of San Francisco, accessed May 9, 2024, https://sfgov.maps.arcgis.com/apps/webappviewer/index.html?id=b2743a3fc0b14dd9814cf6668fc34773.
- “Equity—Social Equity Is at the Core of Vision Zero.”
- “2022 Vision Zero Network Update Methodology” (San Francisco Department of Public Health, Center for Data Science in collaboration with the San Francisco Municipal Transportation Agency, n.d.), https://www.visionzerosf.org/wp-content/uploads/2023/03/2022_Vision_Zero_Network_Update_Methodology.pdf.
- “Evaluating & Monitoring Our Progress,” Vision Zero SF, January 2, 2015, https://www.visionzerosf.org/vision-zero-in-action/evaluating-monitoring-our-progress/.
- Andy Clarke, “Edmonton Safe Mobility Strategy Heralds Vision Zero 2.0,” Toole Design, December 22, 2020, https://tooledesign.com/insights/2020/12/edmonton-safe-mobility-strategy-heralds-vision-zero-2-0/.
- “U.S. DOT Key Performance Indicators (KPIs) for Equity,” (11/22/23) https://www.transportation.gov/sites/dot.gov/files/2023-11/Cost%20Burden%20KPI%20Public%20Summary%20Review%2011.28.2023.pdf.
- Brozen, Gonzalez, and Butler, “Measuring Equity in Public Transit Service LA Metro.”
- “From the Back of the Bus to the End of the Line: The Discriminatory Funding of Public Transit in California,” American Bar Association, accessed February 29, 2024, https://www.americanbar.org/groups/crsj/publications/human_rights_magazine_home/human_rights_vol34_2007/summer2007/hr_summer07_marjon/.
- Sylvia Darensburg, “Darensburg v. Metropolitan Transportation Commission” (2009).
- Robert García and Thomas A. Rubin, “Crossroad Blues: The MTA Consent Decree and Just Transportation,” Running on Empty, n.d.
- “West Oakland Sustainable Transportation Equity Project (STEP),” City of Oakland, accessed December 21, 2024, https://www.oaklandca.gov/projects/wostep.
- “LCTI: South Los Angeles Universal Basic Mobility Pilot Program,” California Air Resources Board, accessed December 21, 2024, https://ww2.arb.ca.gov/lcti-south-los-angeles-universal-basic-mobility-pilot-program.

