


Editor's note (August 17, 2020): The author's have completed and published the full set of zoning maps and the accompanying Part 5 segregation report referred to at the end of this article
In mid-June, the New York Times published ten zoning maps of major American cities. These brilliantly rendered maps illustrate the degree to which single-family zoning dominates our urban areas, not just suburban communities. For example, the Times found that 70 percent of residential land in Minneapolis, 75 percent in Los Angeles, 81 percent in Seattle, and 94 percent in San Jose is zoned for single-family homes.
The problem here lies not with single family homes, but with single-family zoning. Single-family zoning effectively makes duplexes, fourplexes, and other, denser housing options, illegal in those zones. At a time of growing housing unaffordability and rising homelessness, excessive single-family zoning does not allow cities to provide enough housing for people, or the density needed to make shelter affordable and reduce sprawl, which exacerbates greenhouse gas emissions.
Because of this problem, in 2018 the city of Minneapolis decided to abolish single-family zoning, and allow buildings with upward of three dwelling units per plot in every neighborhood. The city also abolished parking minimums for all new construction and relaxed density restrictions near transit. The city’s goal is to make it easier for developers to build affordable housing.
The first state to adopt such legislation was Oregon, which recently passed a law prohibiting single-family zoning in cities of 10,000 or more people. Several bills in California have also been introduced in recent years that would similarly override restrictive local zoning. For example, SB 50 would override local zoning near transit and jobs-rich areas to permit duplexes and fourplexes. (Disclosure: we were part of research a team tasked with identifying the “jobs-rich” neighborhoods that would inform this and other legislation.)
For each of the 10 cities examined, the New York Times created a map that clearly indicated zoning restrictions for different parts of each city, including the percentage of the city land zoned for single-family homes. Applying the methodology of the New York Times, including the same data source (Urban Footprint), we are creating single-family zoning maps of municipalities in the Bay Area for our series on racial segregation in the San Francisco Bay Area. Mapping every municipality will take some time, so we are pleased to share with you today two maps of Oakland and Berkeley.
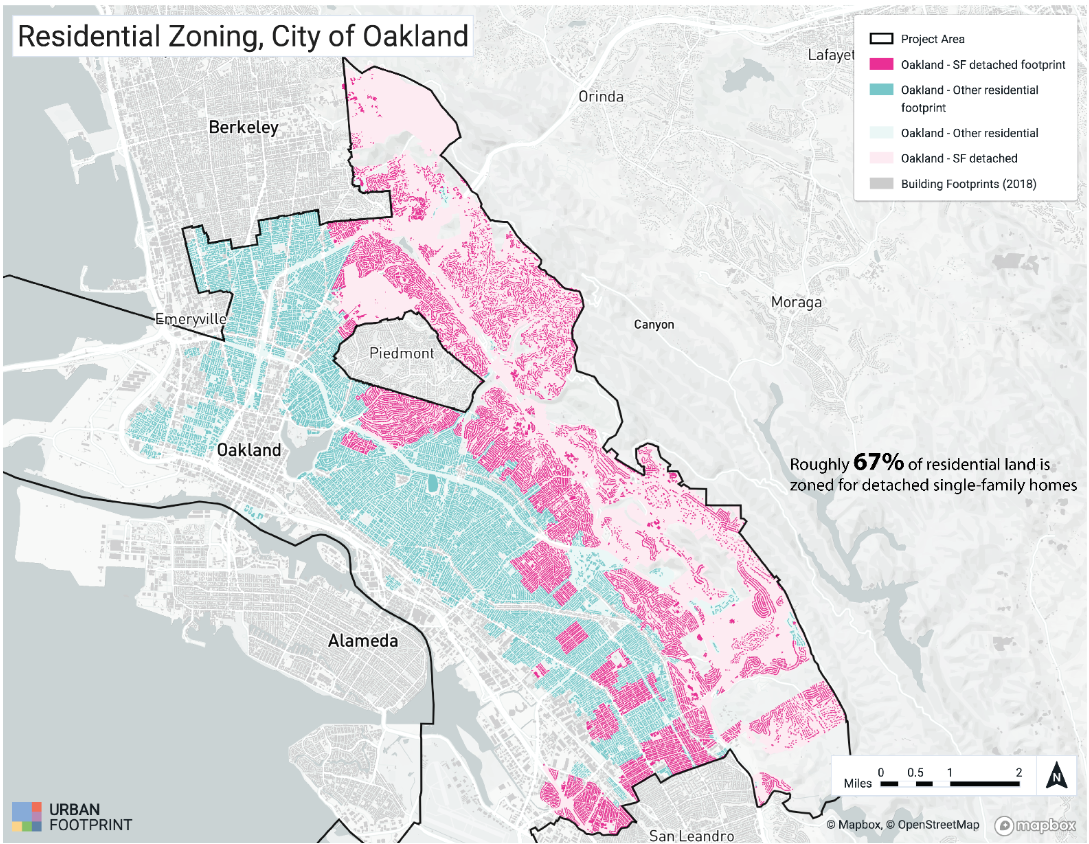
As the map of Oakland illustrates, 67 percent of all residential land is zoned for single-family homes, and prohibits denser housing options. And 27 percent of all land in Oakland is zoned strictly for single-family homes.
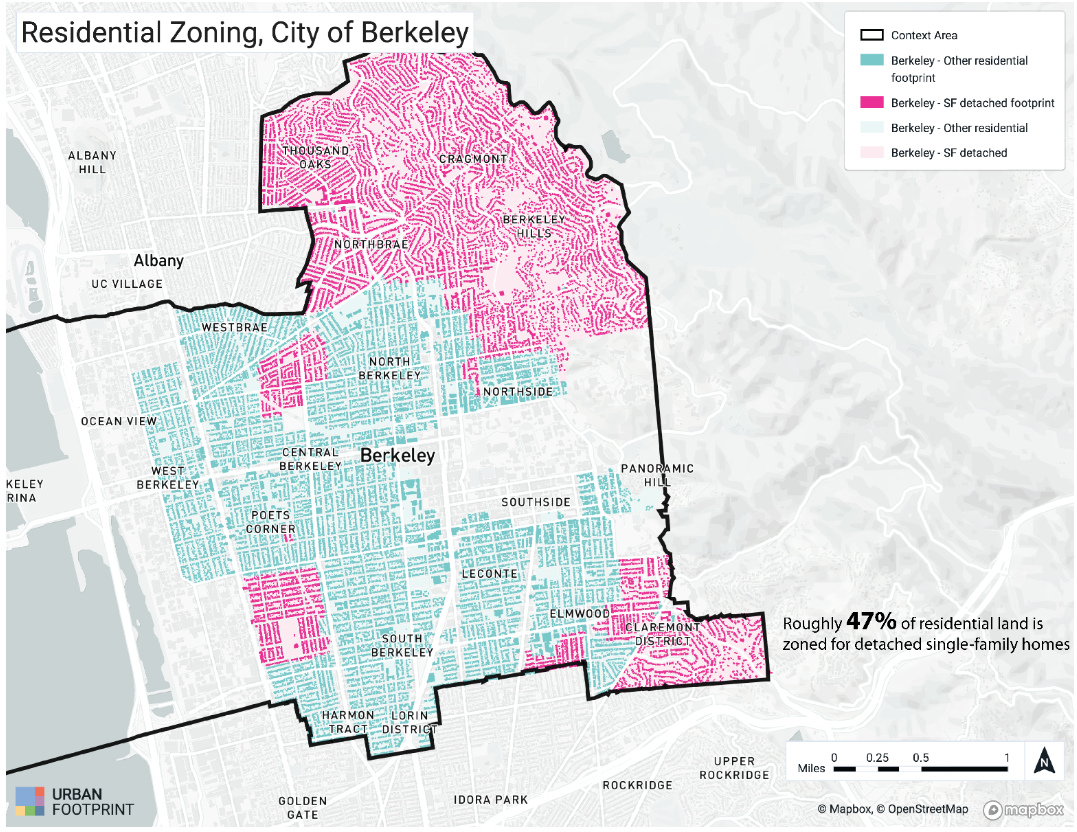
Berkeley, a smaller municipality northwest of Oakland, has 47 percent of all residential land zoned as single-family homes, which is 30 percent of all land in Berkeley. For cities of these size and centrality to the Bay Area economy, having even a third of all land restrictively zoned for single-family homes makes it much more difficult to produce the dense and affordable housing options many of these communities need.
As noted above, we are working to create maps for other Bay Area cities, which we will publish in the near future. But we will also be examining the relationships between restrictive zoning and racial residential segregation in Part 5 of our series on segregation, and we will be examining the effects of such zoning on demographic changes in the region in other related work.

