Social scientists have long known that the root cause of racial inequality – that is, the large disparities in life outcomes between racial groups – is primarily a byproduct of racial segregation, and racial residential segregation in particular. Prevailing wisdom suggests, however, that racial segregation has declined in the last several decades while economic segregation has grown substantially in that time.
Although true, this ignores the fact that racial segregation remains stubbornly high – it fell just modestly from an extremely high level between 1970 and 2010. To give you a sense of how segregated the nation is, more than half of either blacks or whites would have to move to a different neighborhood to create a “perfectly integrated” nation.
There are a number of excellent visualization of racial demographics that immediately illustrate this reality. One of my favorites is a dot map of every person in the United States created by a researcher at the University of Virginia, which Wired magazine called “the best map ever made of America’s Racial Segregation.” Another amazing interactive map illustrating racial demographics and racial diversity was created by the Washington Post this past summer.
Despite both being wonderful maps, they suffer from the same problem: they do not actually map segregation, but rather racial demography and racial distributions. Racial diversity and racial segregation are related concepts, but not the same thing. You can have a racially diverse community that is nonetheless very segregated. In fact, that is exactly the case in many Bay Area communities.
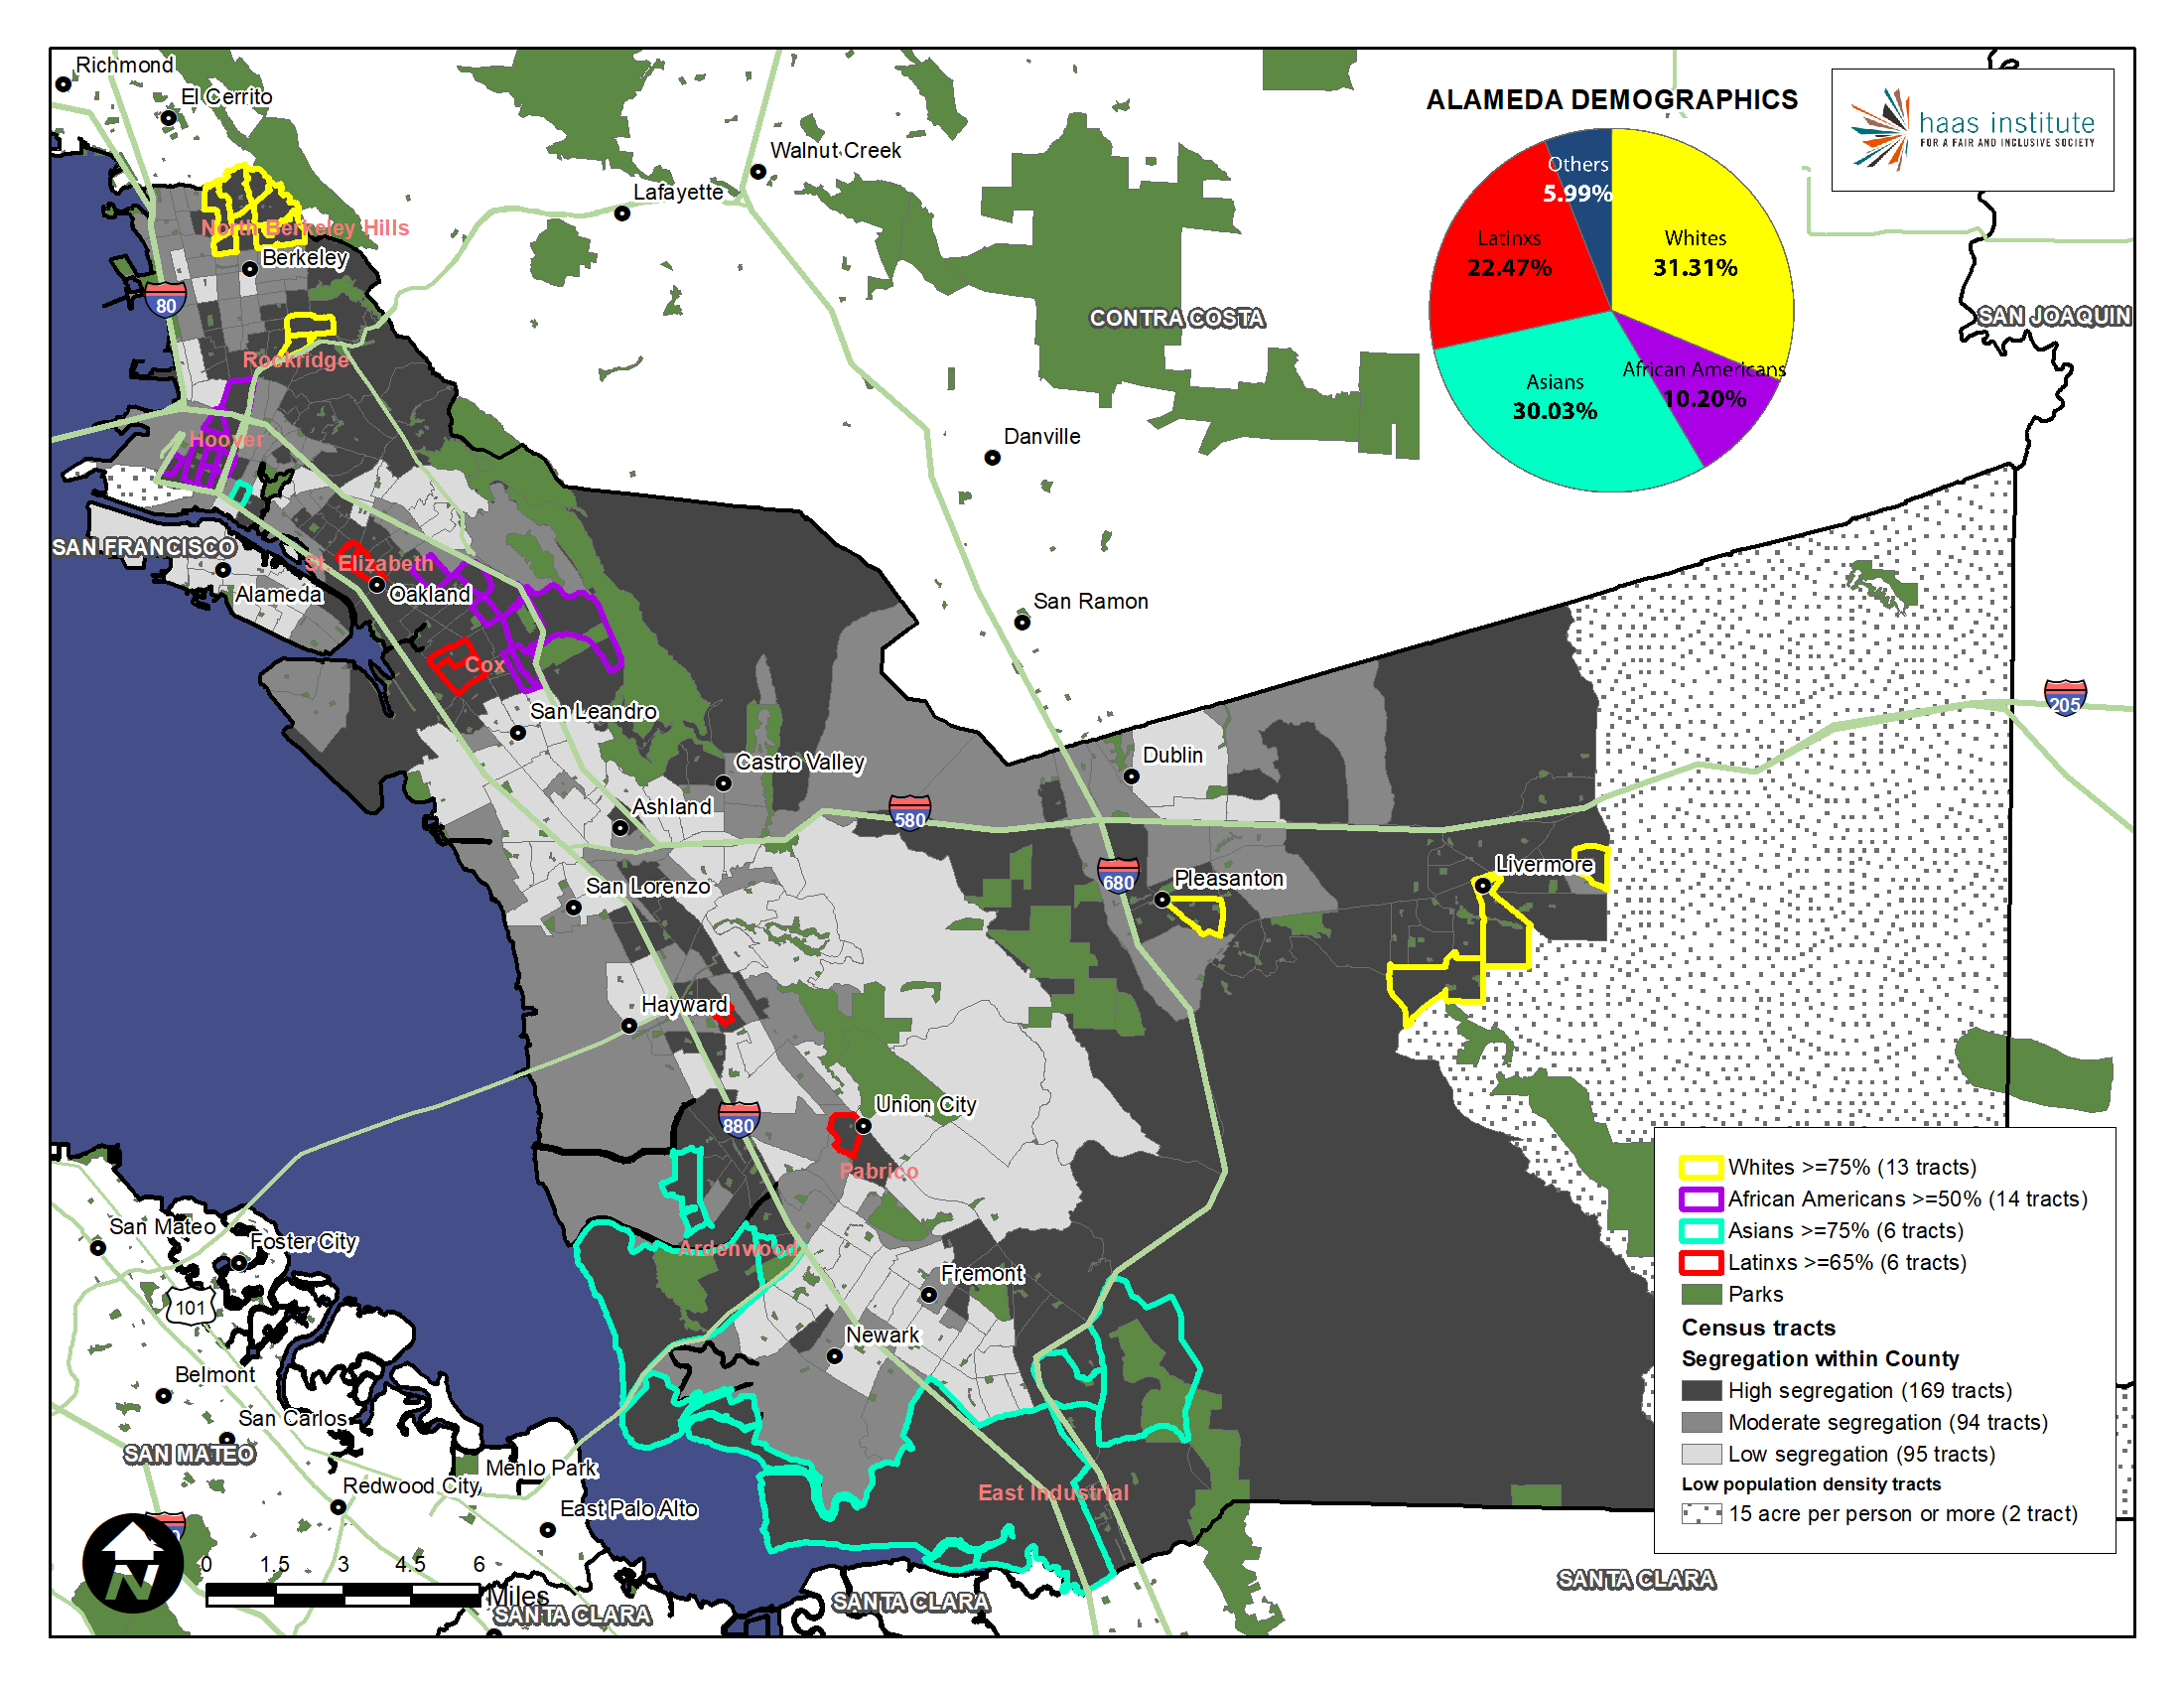
Oakland is one of the most diverse cities in the country, with a city population that is 27 percent white, 15 percent Asian, 28 percent Latino, 23 percent black and 5 percent Native American, Pacific Islander, and multiracial, but it contains some of the most segregated neighborhoods in the Bay Area. In fact, we found that eight of the 10 most segregated neighborhoods for African Americans in the entire Bay Area are in Oakland.
To illustrate the actual reality of segregation in the Bay Area, my colleagues at the Haas Institute and I developed a series of maps of the Bay Area that represent segregation itself, and not merely diversity, racial concentration and clustering, or mere demographics. We are proud to have launched those maps in a new web report this week.
The report has 12 maps: one regional map, nine county maps and two metropolitan statistical area (MSA) maps. Each map shows the level of segregation in each census tract within those geographies. And to illustrate the different kinds of segregation visible throughout the area, we also show how different racial groups are clustered by representing extreme racial concentrations in certain neighborhoods with a border color.
The Bay Area features two prevalent forms of segregation: inter-municipal and intra-municipal. Places that we think of as diverse, like Oakland, Berkeley, San Francisco, and San Jose are indeed diverse, but highly segregated into racially distinct neighborhoods. This is intra-municipal segregation.
But even more widespread is inter-municipal segregation. There are a number of highly segregated and exclusionary white communities in the Bay Area like Piedmont, Lafayette, Atherton, Menlo Park, and Walnut Creek. But these communities do not exist in isolation. They result in the segregation of Blacks, Latinos, and Asians into other cities, like Richmond and East Palo Alto.
The most important finding we observe is that the segregation of whites and the segregation of people of color are flip sides of the same coin–they are reciprocal arrangements, both within cities and between them. We can — and we must — do better if we are ever to achieve a racially just and equal society.
Editor's note: The ideas expressed in this blog post are not necessarily those of the Haas Institute or UC Berkeley, but belong to the author.

