
Mapping is a powerful methodology for critical analysis of why places are the way they are, developing a vision for transformation rooted in a connection to land and community governance of territory. For example, in Valle del Cauca, Colombia, in 1999, there was a devastating flood caused by deforestation. But it reflected deeper problems of an extractive economy, negligent government, and weakly organized people living at the margin of the river and along the steep mountainsides. In response, community leaders organized over various years to analyze and plan their economy, watershed, food systems, land use patterns, power, and governance systems. Mapping was the main methodology for developing and documenting community knowledge. They made maps of the past, the present, and their desired future. They made maps of the whole region, maps of each household’s land, and maps of neighborhoods.
What is Mapping?
Maps tell a political, social, and historical story about a place—where people and things happen—and show patterns that help us understand why they are happening in some places and not others. Most problems have a spatial dimension—they are concentrated in some areas—whether we are concerned with incarceration rates or evictions or polluted air or locations of safe neighborhood spaces. Maps can be more accessible than text or numbers because they are visual and are often perceived as credible (partly because of their history as tools of official government knowledge).
Movements for social transformation have created and used maps to facilitate popular education, participatory planning, future visioning, territorial governance, advocacy for policy change, and other ends. Versions of this have been called countermapping, radical cartography, participatory mapping, indigenous mapping, and other terms.
Types of Knowledge Mapping Generates
Maps are political and have been used throughout history in various contexts, including within European colonization of the global world. Maps take countless forms that reflect the priorities of the mapmakers and the intended map users. To plan and create your maps, these are the key elements:
Themes: What is your map about? What does it show? Maps always make some things visible and other things invisible. The themes you chose to make visible will tell a story about what’s important. Some maps show that something is missing, like a map of grocery stores that shows how some neighborhoods don’t have any. Some maps show rates, like the rate of public funds per student in different school districts.
Symbols and legend: The symbols you use are the language of your map, the way people will know what they are looking at. Making symbols that are easy to understand for the people who will be using the map is key to making it accessible. People have associations with certain colors and symbols—like red being a color for problems, and green being a color for resources—so the colors and symbols you choose may connect what you are mapping with those associations.
Scale: Scale refers to how zoomed in or zoomed out the map is compared to reality. Is it most important to show your map at the city, watershed, country, or globe level? This depends on what problem you are focused on and your analysis of why it is occurring.
Data source: The data for your map can come from people’s lived experiences, such as maps made by a group of people mapping the areas where they feel safe in their neighborhood. Data can come from public agencies, like a map of 911 emergency calls or locations of youth programs.
Time: Maps can be made of the past, present, or potential future. Multiple maps of different moments in time can show how something changed over time and help people analyze why the change occurred.
How Mapping Can Build Relationships and People Power
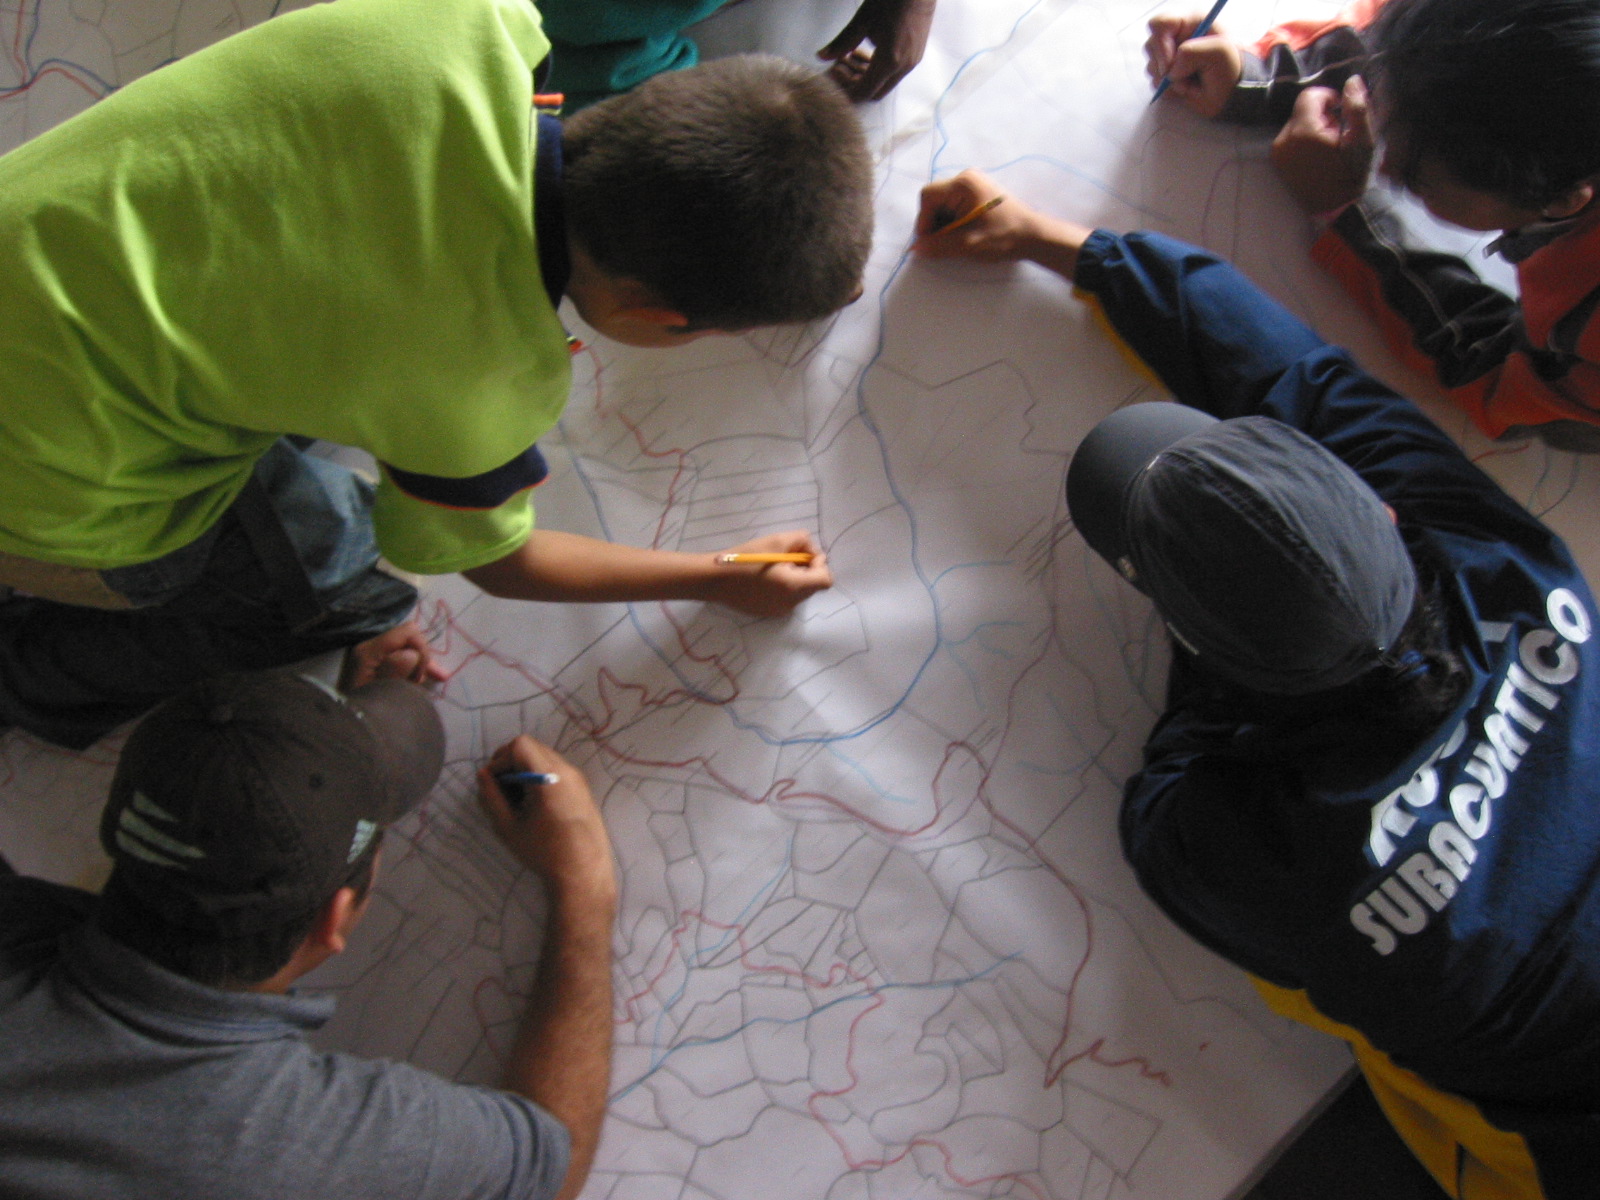
Making maps can be a participatory process that facilitates collective dialogue, sharing of experiences, and critical analysis among the participants. It develops a shared analysis of community assets and a shared vision for transformation when participants gather around a base map, such as a map of the streets and parks in your city, and mark on the map where there are resources the community could enhance. Participants can also connect personal lived experience to a collective experience and shared identity by making individual maps and then gathering as a group to compare and combine these maps, such as maps of the origin places where people’s family members migrated from.
Seeing yourself on a map can be another source of power. When maps are reclaimed by communities organizing for justice, they focus on the stories, dreams, and needs of community members. For example, a community mapping project in 1970s Detroit mapped where babies had been bitten by rats, a powerful testimony to a lived experience of substandard housing. Maps can also show the otherwise hidden actions of powerful people and institutions. For instance, the Evictor Book is a mapping project that shows data on landlords’ evictions of tenants.
A famous saying among cartographers is that maps always lie. The point is that every map has to omit or twist some parts of reality in order to squeeze the countless details and dimensions of reality into a two-dimensional piece of paper or computer screen. Which parts of reality are made invisible will reflect the values and priorities of the mapmakers.
Maps have been used countless times to invade, plunder, and harm people and places, from the colonial maps used to take possession of Indigenous peoples’ land, to the redlining maps used to exclude Black and other people of color from home loans. These maps devalue, stigmatize, and make invisible the experiences and dignity of everyday people, instead making visible the resources that those in power want to control. Critical map literacy is “vigilance to the inherently political nature of the mapping process, no matter who is involved or how the mapping will be ‘performed.’”49 Who made the maps and what are their interests? What is not shown in the maps? What story is being told and what are other stories that interpret the maps? These are questions for critical map literacy.
Time, Capacity and Resources, and Tools Needed
Maps can be made as simply as drawing by hand on top of a base map of streets or other features, or as elaborate as interactive, online maps that have datasets linked to them through a Geographic Information System (GIS). To decide which mapping technology to use, consider these questions:
- Who will be making the maps and what technical mapmaking capacity and time do they have?
- Who will be reading and using the maps and what qualities will the maps need to have to be most useful, credible, and accessible?
- What type of map will provide the analysis you need? Is there a need to layer different types of maps and look at the relationship between the layers?
Hand-drawn maps: With colored pencils and a base map printed on poster-size paper, a group can decide what themes they want to map, create a legend of their symbols, and draw onto the map the knowledge they want to represent.
Google Maps and Google Earth: These free tools allow you to create maps online, share them, and have other people add to them through the Internet. You can create map symbols that have pop-out boxes with text and links to more information. A few hours of learning from online videos is often enough training to begin using these tools.
QGIS: This free software can be used to make almost any type of map, incorporate large datasets, create maps with multiple layers and analyze the relationship between what’s on each layer, and more. Often a class or training course is needed to be able to gain the skills to use this software.
Other maps: There are countless types of maps to find or create. Historical maps show how a place was in the past. Land use maps show the different types of ways people are using land. Parcel maps show who owns what land. On and on.
Pitfalls, Challenges, and Myths
Narratives matter: A map can only say so much, so making sense of it will require a narrative that goes beyond what is visible on the map. For instance, a map of poverty rates and race can show how people of color are experiencing more severe poverty, but the question of why this is happening will require a broader analysis and narrative about the root causes. If you do not take time to craft your own narrative, the people who see the map can misinterpret it, such as people who look at the map of poverty and race and conclude that people of color should work harder.
Be careful what you make visible: Putting something on a map and sharing the map makes the location visible to whoever ends up with that map. This is often beneficial but sometimes can create vulnerability. For instance, a project mapping the sacred sites of an Indigenous community was careful to limit access to the data and maps so that people who might go to the sites without permission or the right intentions would not be able to use the maps.
Weaving in Cultural Strategy
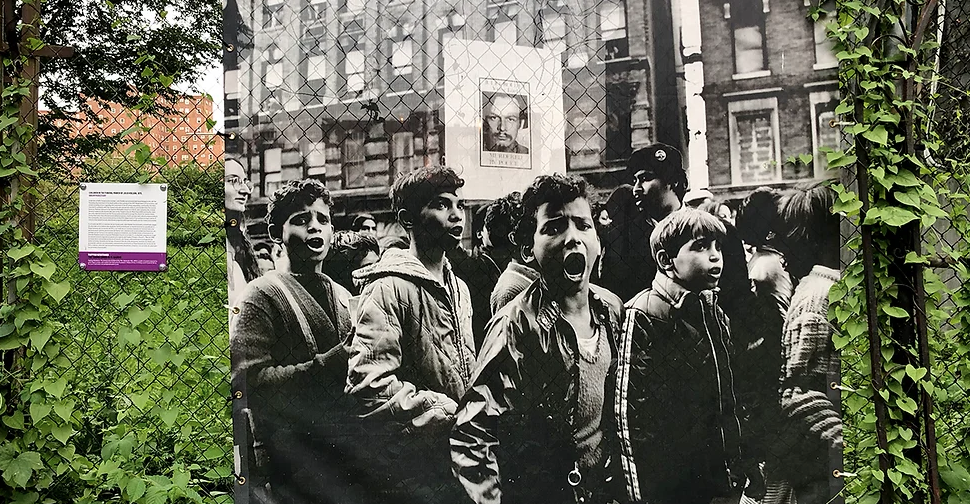
Artists have used mapping to shift how people view and relate to place by bringing maps “off the page,” focusing on maps as storytelling tools, or mapping everything from relationships to dreams to concepts. Fifty years after the Young Lords in East Harlem, the artist Miguel Luciano collaborated with Young Lords’ photographer Hiram Maristany to map out key places in the Young Lords’ history by mounting mural-size reprints of his original photos as counternarratives in the rapidly changing neighborhood. The housing group City Life/Vida Urbana activated redlining maps by using a baseball line chalker to map the racist insurance policy lines throughout Boston on the sidewalk. This public mapping action served as a political education and organizing tool, expanding the reach of their work. In one community process that brought together groups with interracial tension, each member of the group narrated and drew their own map in front of the group, sharing their life history in the neighborhood, revealing shared relationships and assets and building common trust. The Prison Industrial Complex (PIC) map created by the artist Ashley Hunt has been used as a popular education tool by Critical Resistance and others to map out the many relationships, sectors, and beneficiaries of the PIC to give a more rigorous understanding of the role of incarceration.
Related Resources
- 49Jay T. Johnson, Renee Pualani Louis, and Albertus Hadi Pramono, “Facing the Future: Encouraging Critical Cartographic Literacies in Indigenous Communities,” ACME: An International Journal for Critical Geographies 4, no. 1 (2015): 80–98, https://acme-journal.org/index.php/acme/article/view/729.

