Extra Interest Expenses
THE EXTRA INTEREST COST estimated is based on the interest rate spread across rating categories.
Estimating rating spreads can be challenging because bond yields are affected by numerous factors other than ratings. Examples of these other factors include trade time and size, issuer state, and maturity date.
Because the municipal bond market is very illiquid—most bonds do not trade on any given day—it is necessary to either compare bond trades that occur hours or days apart, or rely on estimated pricing to determine yield spreads. Further, prices of individual trades may be distorted by the relative market power and sophistication of transaction participants. For example, an individual buying $10,000 of a given issue may receive a lower yield than an institution buying $1,000,000 of the same issue at the same time.
Municipal bond interest is taxed differently across states. For example, California has a maximum personal income tax rate of 13.3 percent and exempts California municipal bond interest income from state income taxation. By contrast, Texas and Florida have no income tax, removing some of the benefit to owning municipal bonds. A top bracket taxpayer in those two states receives substantially less after-tax income from municipal bond interest than her counterpart in California. Investors in those states may be expected to demand greater yields to offset this tax impact.
Finally, longer term bonds usually have higher yields than shorter term bonds. Thus comparing the yield of a bond rated AAA maturing in 2025 to a bond rated AA maturing in 2020 can be misleading. The term effect may well overwhelm the rating effect.
Market data services such as Bloomberg and Municipal Market Data offset this last effect by constructing rating-specific yield curves, showing rates at different tenors (i.e., length of time to maturity). The points on the yield curve represent average yields of bonds with the same rating and same tenor. It should be noted that tenor is typically stated in a round number of years which means that the 5-year point on the yield curve may include bonds with as little as 4.5 years to maturity or as many as 5.5 years.
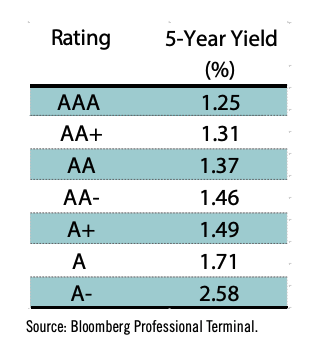
As of March 31, 2015, Bloomberg reported the following index yields for five year bonds at various ratings:
By subtracting the AAA yield from the others, I can estimate the risk premium (or spread) associated with lower ratings.
These spreads vary across tenors, and, in some cases, AA+ and AA bonds actually have lower yields than their AAA counterparts.15 It is reasonable to assume that these anomalies are the result of some of the effects described above. The five-year spreads appear to be more consistent than those for other tenors.
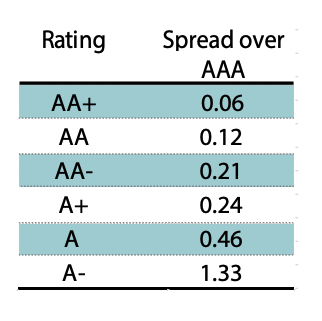
As ratings decline from AAA to A+ yields increase by an average of 6bp per notch. There are steeper yield increases once ratings fall below A+. For the purposes of this analysis, I will make the conservative assumption that each rating notch is associated with a 6bp change in interest expense.
Further, let’s assume that municipal bond ratings are two notches too conservative relative to other asset classes. (Later in the study I present an alternative rating methodology that can produce a generalized two-step improvement while still assigning at-risk cities speculative grade ratings.) For example, a municipal bond rated A- should really be rated A+ and one rated AA- should be upgraded to AA+. Such an adjustment cannot be made to municipal bonds carrying the highest AAA rating, and it is only possible for AA+ bonds to receive a one notch upgrade.
All this means that the interest penalty on bonds rated AA and lower is estimated to be 12bp: the ratings on these bonds could be increased by two notches at an interest cost savings of 6bp per notch. No interest savings are available for AAA bonds, which already have the highest rating and lowest funding cost. Since AA+ bonds can only be raised by one notch, the interest rate penalty on these bonds is estimated to be 6bp.
Now that I have the penalty rate, I need to determine the base against which to apply this rate. The appropriate base is some fraction of the overall amount of municipal bonds outstanding. For each dollar of affected municipal bonds outstanding and rated AA or below, borrowers are paying 0.12 cents in extra interest.
According to Federal Reserve estimates, the overall size of the US municipal bond market was $3.65 trillion at the end of 2014.16 Of this total, $2.91 trillion was issued by state and local governments, $0.52 trillion was classified as industrial revenue bonds and $0.22 trillion were issued by not-for-profit organizations including universities and hospitals.
Not all municipal bonds are rated, and estimates of the number of all rated bonds are difficult to find. Further, the breakdown of the rated universe by rating grade is also not readily available.
One way to roughly estimate the total number of rated bonds is to examine rating history files that each rating agency is required to file under SEC rules. These files are published in a format known as eXtensible Business Reporting Language (XBRL). There is one file for each rated issuer. S&P’s filings contain the size of each bond issue that it rated, thereby allowing users to roughly calculate the size of each rating cohort. Table 3 shows these sizes along with the estimated interest rate penalties associated with each rating. A relatively small volume of bonds rated below BB- are excluded; these are likely to be severely distressed or defaulted assets less prone to trade—based upon their ratings.
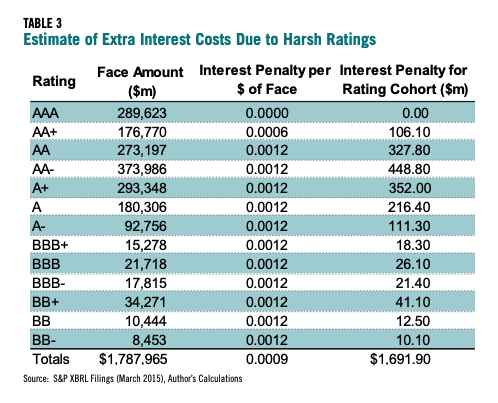
The total penalty is estimated at nearly $1.7 billion. It is worth emphasizing, however, that the rated amounts listed here are quite rough and should be refined in future work. These estimates are somewhat inflated because they reflect initial issue sizes and thus do not reflect any principal repayments. On the other hand, the estimates only include S&P data. Moody’s and Fitch rate a large number of bonds not covered by S&P. To the extent that the values above do not include bonds rated exclusively by Moody’s and Fitch, they understate the actual totals.
- 15One possible issue is that Bloomberg’s AAA yield curve is contributed by a third party, Municipal Market Analytics, whereas the other curves are calculated by Bloomberg staff. Another source, FMS Bonds, show much larger spreads between AAA, AA and A rated municipal bonds (http://www.fmsbonds.com/Market_Yields/index.asp).
- 16Federal Reserve (March 12, 2015). Z1 Release. http://www.federalreserve.gov/releases/z1/current/z1.pdf

