By Charlie Eaton
This paper argues that private colleges with substantial endowment wealth have increasingly become ivory tower tax havens. The author, Charlie Eaton, explains that these colleges have been supported by three large federal tax expenditures. The three tax expenditures involve tax deductible donations to endowments, untaxed endowment investment returns, and a complex new financial strategy known as indirect tax arbitrage in which private colleges use tax exempt municipal bond borrowing in place of endowment assets for capital projects.
Eaton estimates that the three tax expenditures supporting endowments totaled an average of $20 billion per year as of 2012. This improves on previous estimates by including the $6 billion cost of indirect tax arbitrage.
Eaton also uses new college-level data going back to 1976 to show that the federally subsidized growth of endowments contributed to new organizational inequalities in U.S. undergraduate enrolling institutions. For example, private institutions in the 99th percentile for endowment wealth per student increased their annual spending per student from endowments by 751% from $9,724 in 1977 to $92,736 in 2012. At the same time, these wealthiest schools have kept flat the overall number of undergraduates and the share of undergraduates from low-income households.
“With private endowments doing so well, one has to ask if federal tax subsidies might be better used elsewhere,” said Eaton. “For example, we could nearly double the $28 billion in federal funding for Pell Grants by redirecting the $20 billion in federal tax expenditures on endowments.
Click on the image to download the file or click here.
Abstract
Popular anxiety about economic inequality has been compounded by the lavish consumption of the super-rich. In the domain of higher education, there are parallel signs of growing popular resentment towards perceived excesses at the wealthiest private colleges. Consistent with these public perceptions, I argue that private colleges with substantial endowment wealth have increasingly become ivory tower tax havens. I use new college-level data going back to 1976 to show that endowment growth at these colleges has been supported by a three-part federal tax expenditure that I estimate as averaging $19.6 billion per year in 2012. The growth of benefiting endowments contributed to new organizational inequalities in US undergraduate enrolling institutions. For example, private institutions in the 99th percentile for endowment wealth per student increased their annual spending per student from endowments by 751 percent, from $9,724 in 1977 to $92,736 in 2012. At the same time, these wealthiest schools have kept flat the overall number of undergraduates and the share of undergraduates from low-income households. I use the findings to update theories of how the US state supports US higher education in ways that amplify inequality for the new era of finance. This illuminates a new dimension by which the interlocked hands of the state and financialization work together to widen socio-economic divides.
Introduction
SOCIAL SCIENTISTS HAVE only begun to make sense of how inequality and the rising fortunes of the super-rich may have contributed to the social and political tumult of the twenty-first century (Gitlin 2012; Hacker and Pierson 2016; Hocschild 2016; Skocpol and Williamson 2013). An important piece of the puzzle is that anxiety about stagnant wages has been compounded by the lavish consumption of the super rich. The conspicuous spending of the wealthy raises the bar for maintaining social status and “keeping up with the Joneses” at the same time that household budgets are strained (Fligstein, Hastings, and Goldstein 2015; Frank 2013). Under these pressures, more than 7 in 10 voters in the 2016 presidential election agreed that “the American economy is rigged to advantage the rich and powerful” and that the US needs a “strong leader who can take the country back from the rich and powerful” (Kahn 2016). In the domain of higher education, there are parallel signs of growing popular resentment towards perceived excesses at the wealthiest private colleges. Both Democratic and Republican lawmakers, not to mention author Malcolm Gladwell, have promoted legislation to tax the endowments of wealthy colleges for overly favoring the well-off (Faler 2015; Fleisher 2015; Gladwell 2015; Lorin 2016).
Consistent with these public perceptions, I argue that private colleges with substantial endowment wealth have increasingly become ivory tower tax havens. This metaphor encapsulates how exponential endowment growth at these colleges has been supported by large tax expenditures that disproportionately benefit a small elite. I build on recent scholarship regarding how the state has long supported and structured US higher education (Loss 2011; Mettler 2005; Stevens and Gebre-Medhin 2016). And I posit that exponential endowment growth benefited from the interlocked hands of state support and financialization. (Krippner 2011; Quinn 2012; Tomaskovic-Devey and Lin 2011).
Financialization refers to the increasing concentration of wealth and power among investors and financial managers, a phenomenon that has grown through the escalating use of financial markets and new financial strategies and technologies to manage the economy (Davis 2009; Epstein 2005; van der Zwan 2014). When imported to higher education in the 1970s, new strategies for investment asset growth enabled increased endowment investment returns. The rapid growth of endowment assets was also later fueled by increased donations to endowments as financialization contributed to the increasing wealth of the super-rich as potential donors (Tomaskovic-Devey and Lin 2011). As with other expansions of financial markets and financial management strategies, the new endowment investment strategies depended on state policies (Krippner 2011; Quinn 2008, 2012). Namely, endowments have been supported by a triple tax break: 1) a tax deduction for donors to the endowment, 2) a tax exemption for investment income from the endowment, and 3) a tax exemption for interest on municipal bonds used in place of capital expenditures from endowments—a strategy known as indirect tax arbitrage. By existing tax expenditure estimates and a new estimate based on average annual endowment investment returns, I calculate that the triple tax break currently involves a federal tax expenditure of $19.6 billion per year—just $8.6 billion less than the current annual expenditure for the federal Pell Grant financial aid program.
Using new annual college-level data for more than 800 four-year colleges going back as far as 1977, I also show that large new inequalities have indeed emerged between the wealthiest private schools and the rest of America’s higher education institutions. Rapid increases in endowment wealth are at the center of these new inequalities.
Throughout the decades since 1977, but especially since the mid 1990s, endowments provided fast-increasing surpluses to increase annual per student spending on operations and wealthy colleges and universities. For US undergraduate enrolling institutions in the 99th percentile for endowment wealth per student, annual spending per student from endowments increased by 751 percent from $9,724 in 1977 to $92,736 in 2012. In the 95th to 99th percentiles, spending per student grew by 297 percent from $8,275 in 1977 to $32,868 in 2012. Public universities and less wealthy private schools saw no comparable increase in resources from endowments or other areas of support (Bound and Turner 2007; Eaton, Brady, and Stiles 2016; Quinterno 2012; Weerts, Sanfordeah, and Reinert 2012).
I also find that the growth of endowments has overwhelmingly supported colleges that remain islands of privilege, as distant as ever from lower class Americans. These findings offer a longitudinal picture that fits with recent research showing that 38 of the most elite schools in the US enroll more students from the top 1 percent of the income spectrum than from the bottom 60 percent combined (Chetty et al. 2017). The wealthiest five percent of schools have kept the overall number of undergraduates flat for the last 40 years. The share of these undergraduates from low-income households has also been flat at the wealthiest private research universities since data became available in 2000. Though there was some increase in low-income enrollment shares at wealthy liberal arts colleges during the Great Recession. At the same time, the wealthiest five percent of schools have used endowment surpluses to more than double instructional spending per student since 1987. The findings suggest that new scholarship on the role of the state in US higher education should incorporate old insights that colleges and universities often serve to reproduce inequalities in social status (Bourdieu and Passeron 1990; Collins 1979; Karabel 2005; Sewell and Hauser 1976; Stevens 2009). Even amid increasing endowment wealth, elite colleges still appear to follow the incentive to keep undergraduate enrollments flat from college ranking formulas that reward schools for admitting fewer applicants (Espeland and Stevens 1998).
Within the theoretical frameworks of financialization and educational reproduction of elites, I will next offer an historical account of the adoption of new investment logics and the re-purposing of longstanding tax benefits. In doing so, I explain the estimated $19.6 billion dollar annual tax expenditure from tax break related to endowments. I then detail the new data and measures assembled to see if endowment growth, tax avoidance, and endowment uses actually track this historical account. Afterwards, I review how the data supports the argument in three separate sections on: 1) the growth of endowment wealth, 2) tax supports for using debt and donations to grow endowments, and 3) the ivory tower tax haven as an island of privilege in undergraduate education and instructional spending. I conclude by discussing how some wealthy colleges have begun to address resentment over endowment wealth. Responses include using endowment surpluses for broader postsecondary education goals.
New Financial Logics and Repurposed Tax Policies in a Financialized Economy
New endowment logic of asset growth
Prior to the early 1970s, university endowments and the legal framework of their tax exempt status were not intended to achieve substantial asset growth over time. Rather, the prevailing theory was that endowments were maintained to protect intergenerational equity by providing resources for comparable levels of effort towards the university’s mission from one generation to the next (Tobin 1974:427). Tracking financialization and the adoption of new financial logics throughout the US economy, endowment managers adopted a new strategy of diversified investments in equities (Davis 2009; Epstein 2005; Fligstein 1993; van der Zwan 2014). The strategy originally aimed to increase endowment asset growth beyond inflation and depreciation. The strategy actually provided far greater endowment return rates to the point that growing endowment assets could support increased spending on university activities over time. This success would provide incentives for other endowment growth strategies such as fundraising for the endowment and indirect tax arbitrage.
In 1969, the Ford Foundation laid the groundwork for the new endowment investment strategy by commissioning a report to address the problem of widespread depreciation of real endowment asset values in the 1950s and 1960s (Cary and Bright 1974). Entitled “Endowment Funds: The Law and the Lore,” the report transformed endowment management, arguing that endowments should pursue a capital growth strategy. The strategy particularly relied on diversifying their investments to include more stocks and bonds and by reinvesting capital gains to further grow the endowment.
The strategy of indirect tax arbitrage
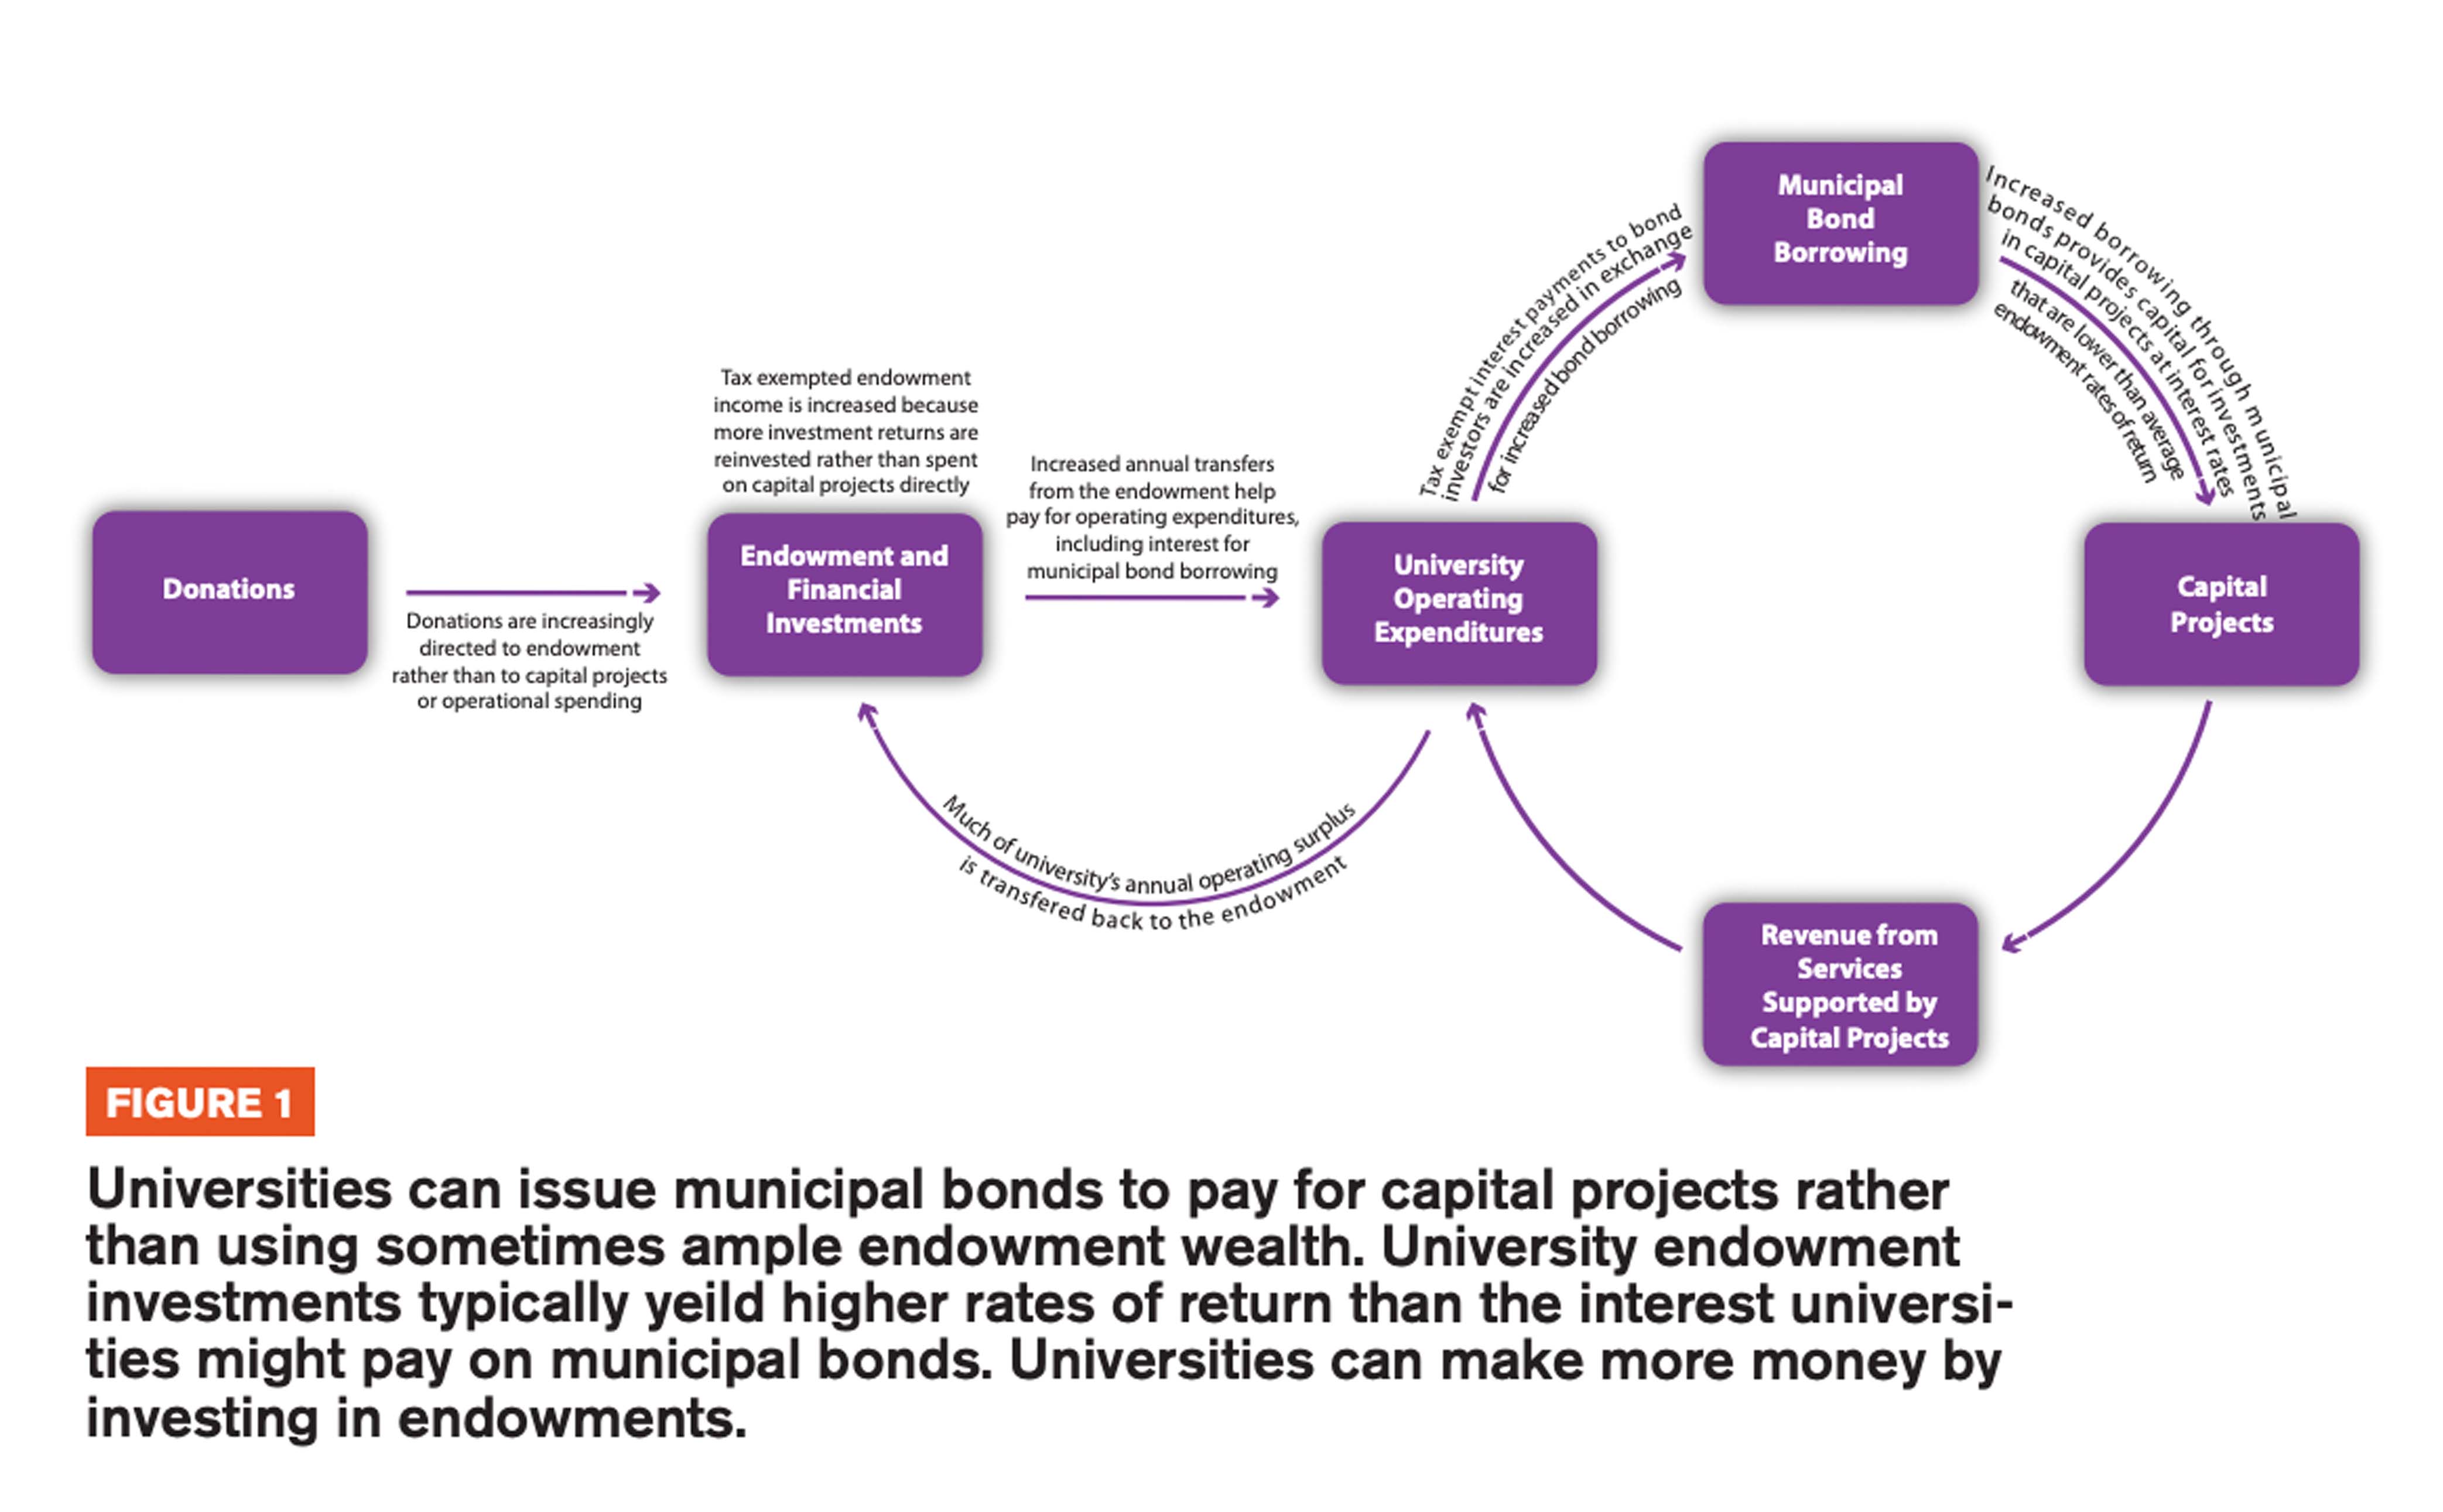
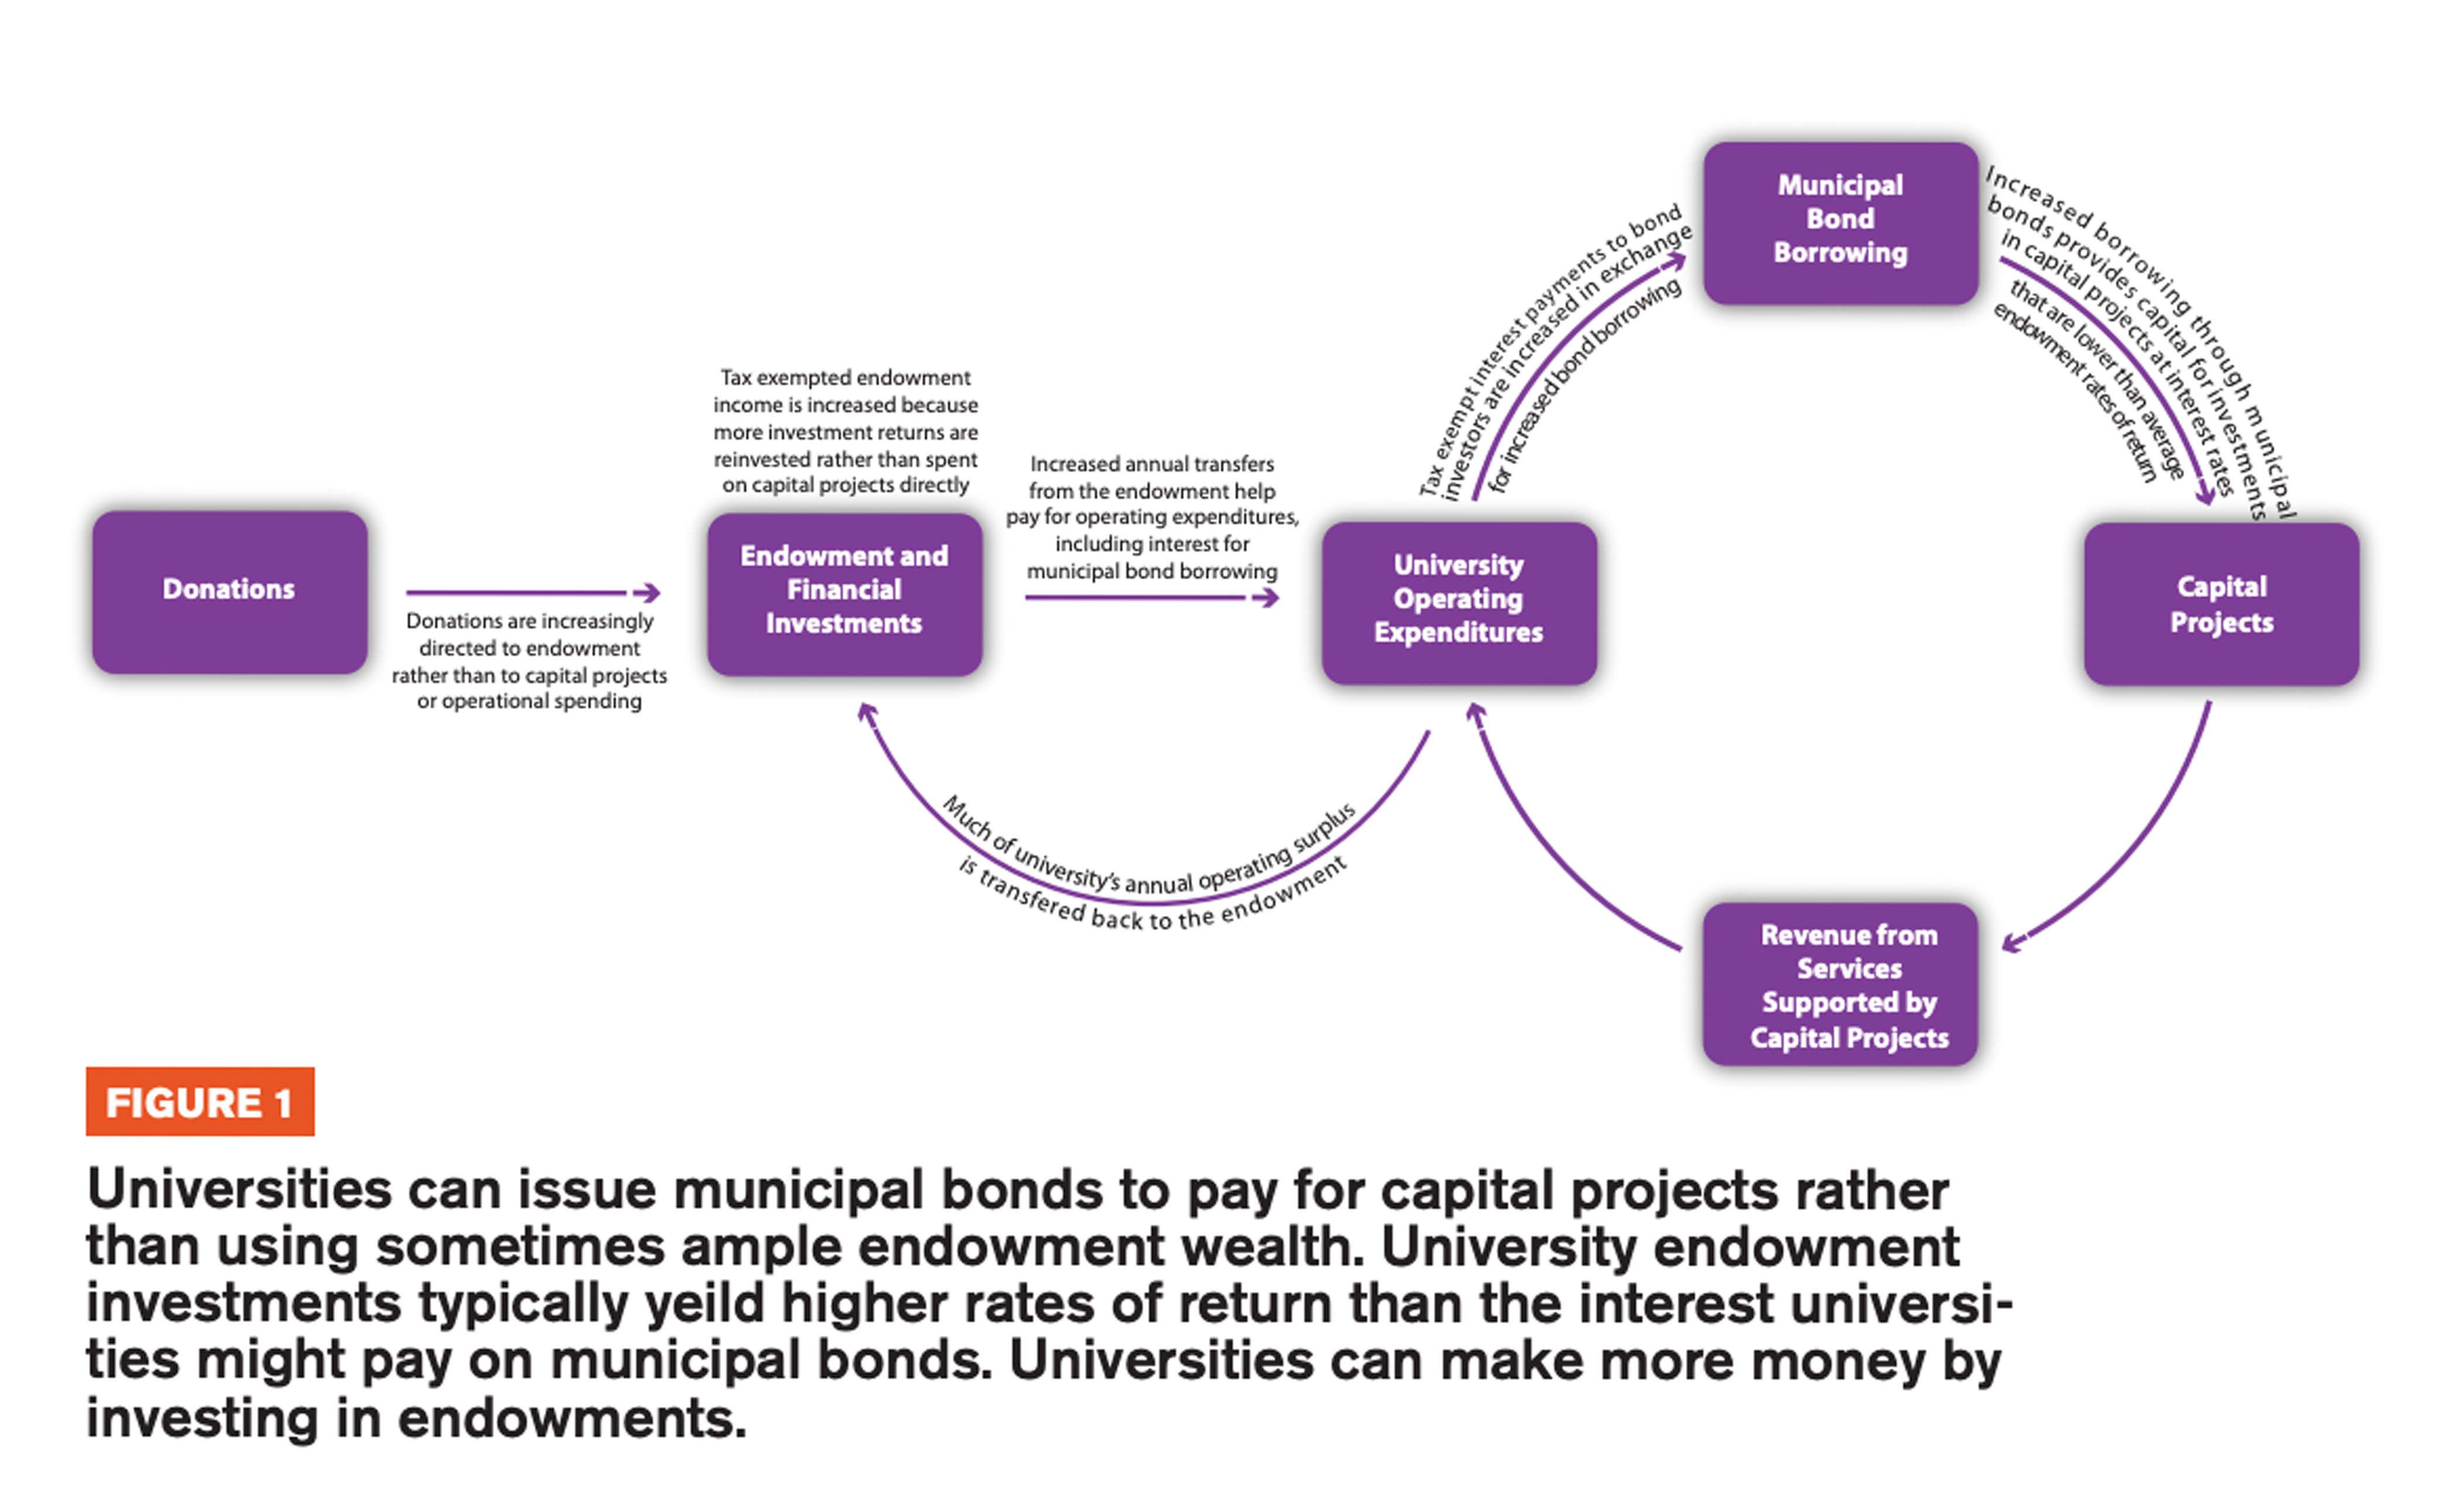
Diversification into higher yield and higher risk investments is not the only asset growth strategy that wealthy universities have pursued. Universities can also boost endowment growth by directing donations to the endowment rather than operational spending or non-financial capital investments. Universities can then engage in indirect tax arbitrage by borrowing through tax-exempt municipal bonds to pay for capital projects instead of using ample endowment wealth (Congressional Budget Office 2010). This process is illustrated in Figure 1. Universities choose to undertake such borrowing with municipal bonds and notes because the interest rate for municipal bond borrowing tends to be lower than average annual rates of return on endowment assets. As a result, the university can make more money by investing endowment wealth than the university can save by spending endowment wealth in place of borrowing. Direct tax arbitrage, borrowing using municipal bonds to directly fund university investments, is prohibited by federal tax law because it would allow private investors to earn untaxed income on interest from lending through municipal bonds to finance an unlimited amount of university financial investments.
break by engaging in indirect tax arbitrage. First, donors receive a tax deduction for giving to the endowment. Second, investment returns for the endowment are tax exempted as non-profit income. Finally, interest income for investors is exempted for municipal bonds used by private schools in place of capital expenditures from their endowments. As noted earlier, the employment of this latter tax break is referred to by policy makers as indirect tax arbitrage because it indirectly uses tax exempt municipal bond borrowing to support endowment investment (Congressional Budget Office 2010). The triple tax break should then become more lucrative for endowments and more costly for government if colleges shift to asset growth investment strategies and indirect tax arbitrage.
Repurposed tax policies in endowment growth
State support for endowment growth has occurred primarily through failure to update policies that have been used in ways that were not originally attended—and at much greater cost. In the wake of the “Law and the Lore” endowment report, 47 states and the District of Columbia did make policy changes to clarify and codify their non-profit laws to allow for universities to pursue the endowment capital growth strategies recommended by the Ford report (Conti-Brown 2011:718). Tax exemptions for municipal bond borrowing and endowment investment returns, however, are primarily legacies of earlier policy frameworks that did not anticipate recent endowment strategies and growth. Failure to update such policies in the wake of unintended consequences is known as policy drift to scholars of social policy (Hacker 2004, 2005).
Indirect tax arbitrage was not a common practice when municipal bond borrowing was extended to support private universities. Prior to the mid1970s, most universities still adhered to the intergenerational equity theory of preserving, rather than growing endowment assets. In addition, private universities used Department of Education bond borrowing under the 1962 Higher Education Facilities Act. As the Department of Education bond program wound down, states set up financial authorities in the late 1960s and early 1970s to borrow money through municipal bonds on behalf of private, nonprofit universities. Private universities incur all of the liability and the costs under this municipal bond borrowing arrangement. Municipal bond borrowing, however, comes at a public cost because income earned from interest on municipal bonds was left tax exempt under the establishment of federal income taxes because of doubts about the constitutionality of taxing such income (Johnson 2007:1260). It has since been determined that there is no constitutional problem with taxing income from interest on municipal bonds (Joint Committee on Taxation 2008:16). The tax exemption, however, has been left unchanged, in part because it is thought that investors tend to lend money at lower interest rates through municipal bonds than through taxable bonds. The logic is that investors accept these lower interest rates as they can keep all of the income earned from interest paid on municipal bonds and pay no state or federal taxes on the income (Congressional Budget Office 2010:2).
The tax exemption for income on interest from municipal bonds, however, primarily benefits wealthy private and corporate investors. This is mainly because all investment income is already tax-exempt for pension funds and other non-profit investment funds. As such, pension and non-profit investment funds tend to invest their assets in other investment assets that pay higher rates of return. We thus have the irony that university endowments never invest in municipal bonds.
The combined cost of tax expenditures in support of endowments
The importance of state support for endowments is illustrated by the combined tax expenditure in support of endowments through the triple tax break for higher education municipal bonds, for donations to endowments, and for endowment investment returns. Table 1 outlines an estimate for a combined annual tax expenditure of $19.6 billion in 2012. This estimate aligns with a recent report on proposed taxes for endowments (Klor de Alva and Schneider 2015). First, a 2010 report by the US Congress Joint Committee on Taxation (JCT) estimated that the total federal tax expenditure for higher education municipal bond debt was $5.5 billion for that year alone (Congressional Budget Office 2010:2). The JCT estimated separately that 28 percent of the tax expenditure for indirect tax arbitrage went to tax exemption of income for corporate investors while 72 percent of the tax expenditure went to tax exempted in come for individual investors (Joint Committee on Taxation 2008:53).
The tax expenditure on higher education municipal bond debt comes on top of the tax deduction for donations to the endowment and tax exemptions for endowment returns. The intersection of financialization and state tax policy should here also contribute to increasing endowment wealth at increased public cost. This is because financialization has contributed to an increasing share of income and wealth going to the very rich (Tomaskovic-Devey and Lin 2011). This in turn should provide the wealthy with greater resources for potential donations to the endowments of elite colleges. The JCT estimated a federal tax expenditure of $4.6 billion from tax deductions for donations to universities in 2010. If a university increasingly directs donations to its endowment, this tax expenditure will increasingly go towards boosting endowment growth. The estimate in Table 1 assumes that 25 percent of higher education donations go to endowments. This may be conservative. For example, 50 percent of donations have consistently gone to the endowment at Stanford University since 1998.
Finally, because of the exemption for non-profits from the 35 percent federal capital gains income tax, endowment investment returns come at the cost of another $12.9 billion tax expenditure.
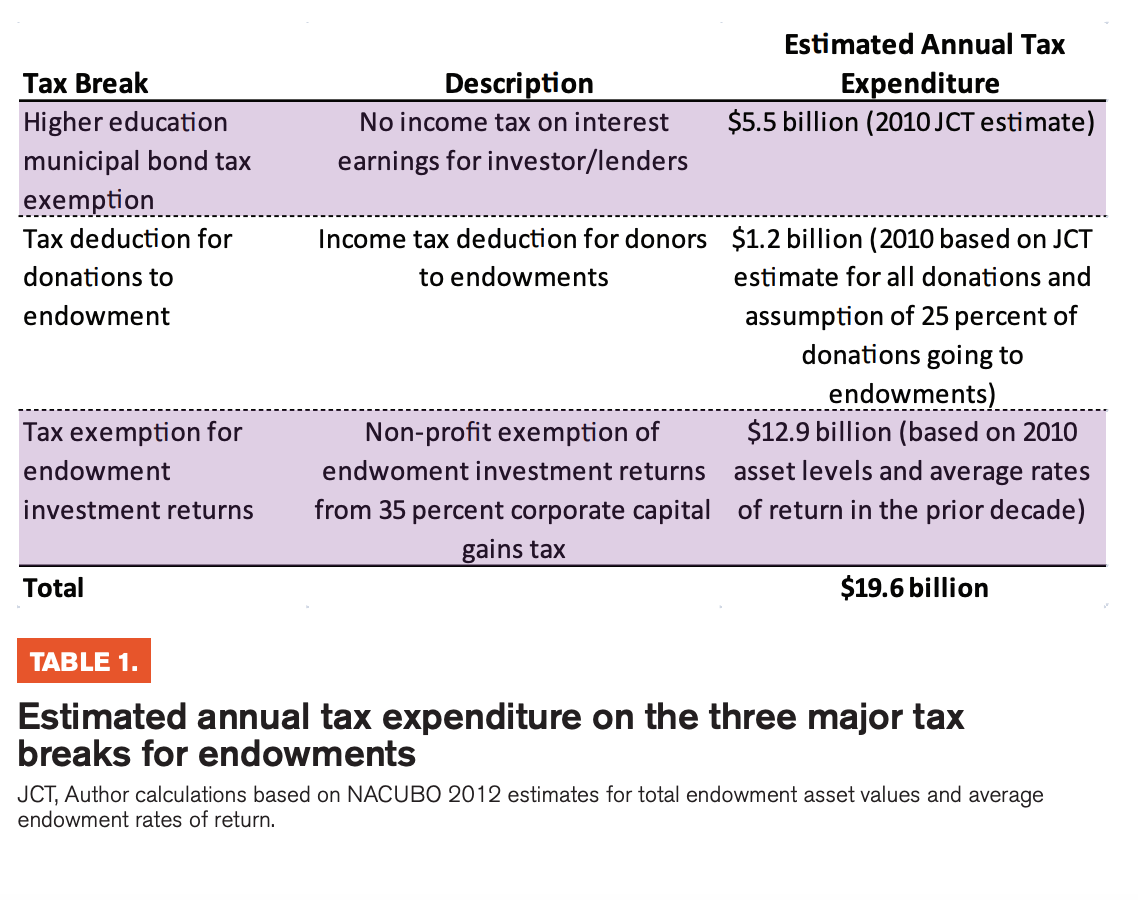
This is based on current average annual endowment investment returns of $36.9 billion a year (National Association of College and University Business Officers 2013). The $12.9 billion tax expenditure for the exemption of endowment investment returns brings total tax expenditure for endowments by the federal government alone amounts to $19.6 billion annually. This does not account for parallel tax expenditures by state and local governments.
The total tax expenditure is for all endowments, not just wealthy endowments. There are signs, however, that these tax benefits go disproportionately to wealthy endowments and investors. We shall soon examine how endowment assets are concentrated at a small number of wealthy institutions. These wealthiest endowments have also been found to attain annual rates of 10 percent since 1990 while average rates of return for poor endowments have averaged just 5 percent (Piketty 2014:448). At the same time, almost 75 percent of tax-exempt bond debt was held by the wealthiest 4 percent of a representative sample of 931 schools examined by the CBO for the Joint Tax Committee. The wealthiest 4 percent of schools in the JCT also all had investment assets valued far in excess of the equivalent of a reserve for a year’s worth of spending. Economists meanwhile argue that the social benefits of the tax exemption are limited because wealthy investors do not actually lend to municipal bond borrowers at significantly lower rates. If private investors in the 35 percent tax bracket passed on all of their savings from the income tax exemption by offering lower interest rates to municipal bond borrowers, the interest rate offered would be 35 percent lower. In fact, interest rates tend to be on average just 2 to 8 percent lower than a borrower could pay in interest on taxable debt (Johnson 2007:1260).
The wealthy beneficiaries of the ivory tower tax haven
There is a long literature on how elite universities tend to serve and reproduce a small elite (Bourdieu and Passeron 1990; Collins 1979; Karabel 2005; Sewell and Hauser 1976; Stevens 2009). Elite colleges tend to maintain their elite status by keeping enrollments down. Managers and university ranking schemes give significant weight to admissions selectivity along with high spending on faculty (Espeland and Stevens 1998; Sauder 2007).
Recent research has shown that 38 of the most elite schools in the US enroll more students from the top 1 percent of the income spectrum than from the bottom 60 percent combined (Chetty et al. 2017). We need more scholarship that tracks how this enrollment disparity has evolved over time. We also need a closer examination of the relationship between this exclusivity and the financial wealth of colleges.
If students at wealthy universities themselves tend to come from wealthy backgrounds (Karabel 2005; Stevens 2009), we can now reimagine wealthy universities as a sort of tax haven. The children of wealthy donors would be more likely than low-income students to directly benefit from tax exempt donations to endowments by attending the college upon which the donation is bestowed. The donors can thereby reduce their tax liability for the education of others by contributing financially to the education of their own. If that wealthy donor so chose, she could even park her wealth in municipal bonds for the very same university in exchange for tax-free interest income. And through indirect tax arbitrage, the university could then preserve its in endowment assets for even more lucrative investments. New data is needed to determine the extent to which endowment growth has particularly gone to benefiting a small number of students to wealthy backgrounds or a broader array of social groups. I constructed a new database for this purpose.
Data and Measures
FOR THE STUDY, I combine college-level longitudinal data on endowments, spending, and enrollments from two sources. I use only data on colleges that enroll undergraduates given my interest in perceived excesses in elite undergraduate education. First, I draw data on endowment assets and spending from the National Association of College and University Business Officers (NACUBO) endowment survey from 1977, 1986, and all years from 1990 to 2012. I used OCR and manual data entry to construct the first machine readable database of this data for years prior to 2003. I then merged the NACUBO database with enrollment and financial data from the Integrated Postsecondary Education Data System (IPEDS) for all years. This provides endowment and enrollment data for 800 plus schools for most years. Endowment asset data from NACUBO is only available for 144 institutions in 1977 and 260 institutions in 1986. Among the wealthiest 5 percent of institutions, however, endowment data is available for all but three institutions for all years. This allows for examination of trends among the wealthiest institutions without any sample bias.
Endowment spending per student
Just as national wealth is measured in gross domestic product per capita, I use endowment resources per student to define endowment wealth as relative to the number of persons relying on the endowment. To make endowment resources per student less abstract, I use annual per-student spending on university operations from the endowment as the measure of endowment resources. To calculate endowment spending, I used reported spending rates for endowments in the NACUBO Endowment Survey from 2003 to 2012. For years prior to 2003, I use the average spending rate for the given institution from 2003 to 2007 as an indicator of normal spending rates prior to the 2008 financial crisis. For institutions that did not report spending rates, I used the average public or non-profit spending rate for endowments depending on the institution’s type of control. Such spending rates are consistently between 4 and 6 percent across all endowments with lower average spending rates for public and poorer endowments. Spending rates are reported for all institutions in the top 5 percent of private schools. So the use of average endowment spending rates for poorer institutions that did not report spending rates may lead to a slight overestimate of spending from the endowment.
The Growth of Endowment Wealth
THE GROWTH OF endowment wealth per student at wealthy schools took off in the mid 1990s. We will see that endowment assets grew at wealthy schools prior to the 1990s, but no faster than enrollment. This suggests that the new endowment investment strategy of asset growth succeeded in overcoming depreciation and inflation pressures. Exponential increases in endowments, however, did not occur until the shareholder value fueled stock market growth since the 1990s.
Endowment wealth per student
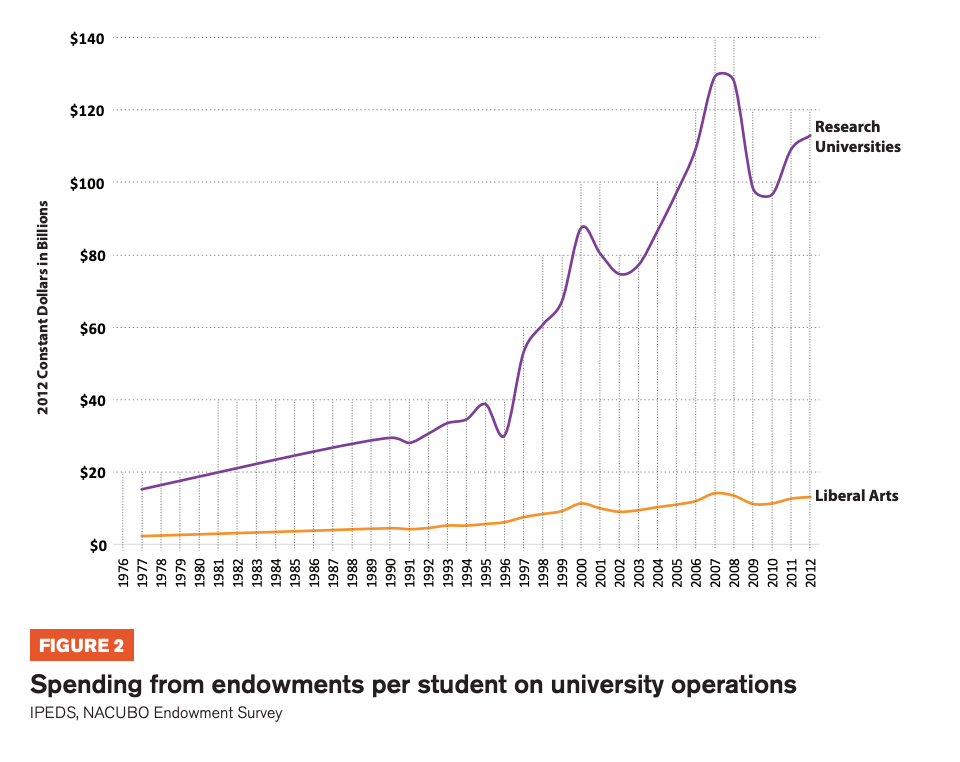
We can see large and growing disparities in the rise of endowment wealth at the richest schools by breaking down endowment spending per full time equivalent (FTE) student into percentiles for public and private institutions that enrolled undergraduates. FTE students estimates here include graduate and professional students whose education may also be supported by endowment wealth. Figure 1 shows annual endowment spending per FTE student for selected percentiles of private undergraduate enrolling schools. This reveals that for US undergraduate enrolling institutions in the 99th percentile for endowment wealth per student, annual spending per student from endowments rose gradually increased by 751 percent from $9,724 in 1977 to $92,736 in 2012. In the 95th to 99th percentiles, spending per student grew by 297 percent from $8,275 in 1977 to $32,868 in 2012. By contrast, even in the 80 to 85th percentiles, per student endowment spending rose from just $2,622 in 1977 to just $7,579 in 2012.
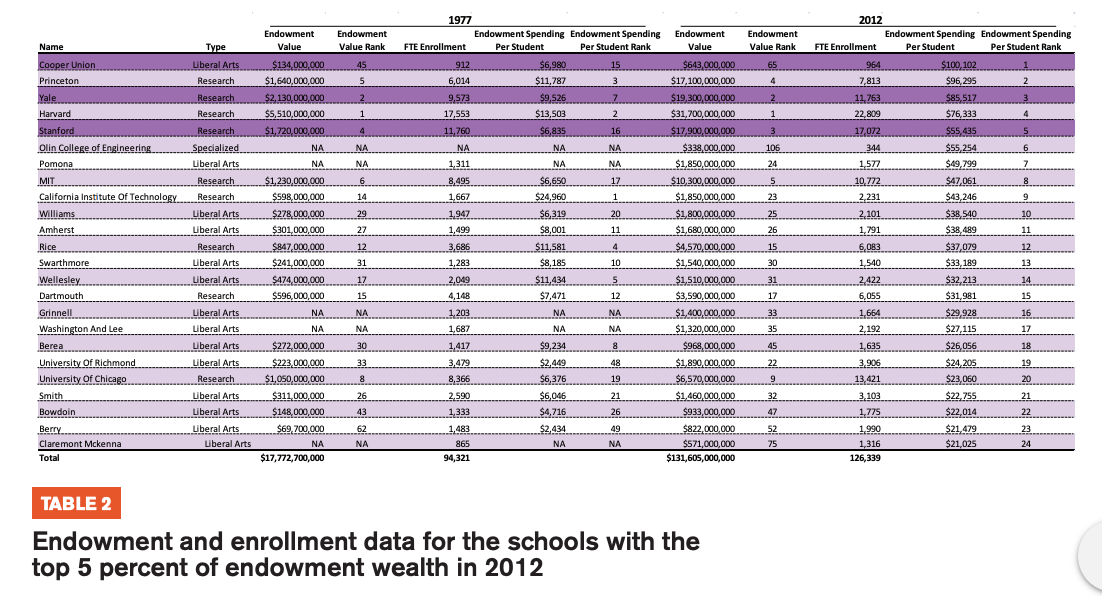
Table 2 shows endowment and enrollment data by school for the 24 schools in the top 5 percent for endowment wealth in 2012. For comparison, the table also shows the schools’ endowment and enrollment data for 1977. The schools include a familiar list of 9 prestigious research universities and 14 selective liberal arts colleges along with the Olin College of Engineering that was founded in 1997. Of 2012’s 24 top schools for endowment wealth, 19 also reported data for 1977. Of those 19, all but four were already among the top 24 schools for endowment wealth in 1977. Across the 19 institutions with data in 1977, endowment spending per student increased by 494 percent between 1977 and 2012.
If we exclude Cooper Union as an outlier because it has used its endowment to pay extraordinary debt service costs since 2009, we see that Ivy League research universities and Stanford occupy the top four slots. At the very top, Princeton increased endowment spending per student by 717 percent from $11,787 to $96,295 even though it has no law school, business school, or medical school—graduation education programs which can carry higher costs per student. Pomona had the highest endowment spending per student for a liberal arts college in 2012 at $49,799, but reported no data in the 1977 endowment survey. Just behind Pomona among liberal arts colleges, Williams increased its endowment spending per student by 510 percent from $6,319 to $38,540. At the bottom of the top 5 percent for private endowment spending, Claremont McKenna spent just $21,025 per FTE student. Most of the increase in endowment spending per student in the top 5 percent occurred through the growth of endowment assets that support such spending. Meanwhile, Table 1 shows that FTE enrollment including graduate and professional student enrollment increased just 25 percent from 1977 to 2012 across the 24 schools in the 2012 top 5 percent.
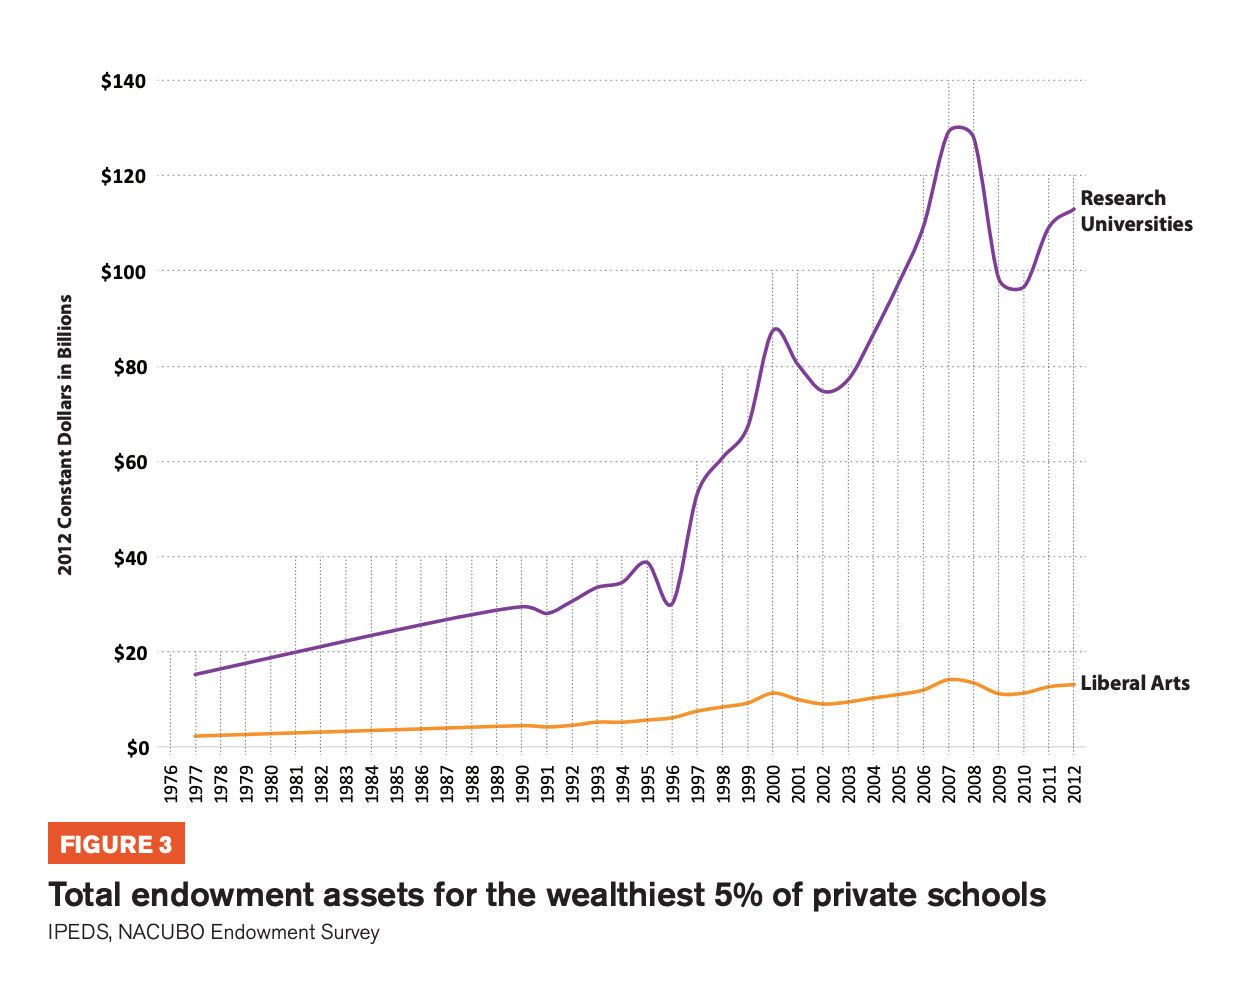
We can see the rapid overall growth in endowment wealth more easily in Figure 3, which breaks out total endowment assets for the 2012 top 5 percent of schools over time by research universities and liberal arts colleges. The five schools that reported no endowment data in 1977 are excluded so that total endowment asset increases do not simply reflect the increase in schools reporting endowment data. Combined, the 2012 top 5 percent schools that had $17.8 or 53 percent of the total $33.1 billion in endowment assets reported in 1977. But among the schools that also reported endowment data in 1977, the 2012 top 5 percent schools would have $126.2 or 62 percent of the reported endowment assets in 2012. In other words, endowment wealth became even more concentrated between 1976 and 2012.
Figure 3 also reveals endowment assets grew throughout the period since 1977 as the new investment strategy of asset growth was purported to be implemented. But endowment asset growth significantly accelerates after 1996. We see an 8 percent average annual increase in total endowment assets for liberal arts colleges in the top 5 percent during the 19 years between 1977 to 1996. These schools saw endowment assets increase from $2.5 billion in 1977 to $6.3 billion in 1996. Research universities in the top 5 percent also saw average annual asset growth of 5 percent during this period with an overall increase from $13.6 billion in 1977 to $30.2 billion in 1996. Endowment asset growth then dramatically accelerated, particularly for the research universities, in the following decade from 1996 to 2007. Liberal arts colleges endowment assets increased 12 percent on average annually from $6.3 billion in 1996 to $14.3 billion in 2007. Research university endowment assets increased 30 percent on average annually from $30.2 billion to $129.1 billion.
State Supported Uses of Debt and Donations for Endowment Growth
THE ACCELERATION OF endowment asset growth in the top 5 percent after 1996 suggests that schools began to use additional strategies beyond the new investment techniques of the 1970s. The average annual investment rate of return for wealthy endowments was 10 percent since 1990. Spending from wealthy endowments on operations was about 5 percent, leaving just 4 to 5 percent of average endowment investment returns for asset growth. Yet wealthy liberal arts endowment asset values grew 12 percent on average annually after 1996. Wealthy research university endowments grew 30 percent on average annually. Wealthy endowments could only achieve this additional asset growth by increasing the allocation of donations or other transfers to their endowments. Increased donations likely benefited the increasing fortunes of the rich in the broader economy from financialization and other political shifts (Hacker and Pierson 2011; Piketty 2014; Tomaskovic-Devey and Lin 2011). With support from the state through tax subsidies, however, increased bond borrowing and indirect tax arbitrage could have also enabled these growing allocations to the endowments through the use of debt in place of donations for capital projects.
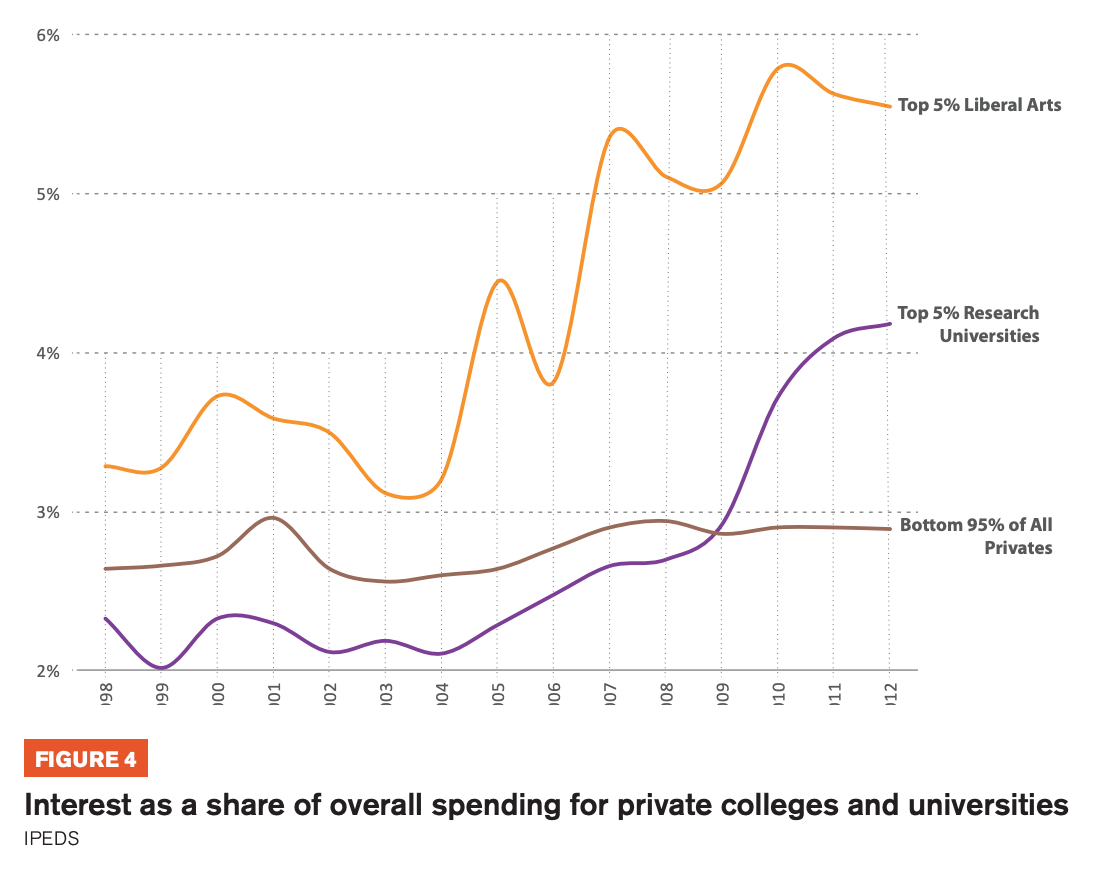
I find that wealthy colleges indeed increased their use of institutional debt after 1996, consistent with an increased use of indirect tax arbitrage and allocation of donations to endowments rather than capital projects. Unfortunately, data on total outstanding debt or new debt origination is not available for private postsecondary schools prior to 2010. Figure 4, however, shows increased spending on interest by colleges and universities as a share of their total annual expenditures from 1996 to 2012, the only years for which data is available. Liberal colleges in the top 5 percent for endowment wealth nearly doubled the share of their annual budgets going to interest from just over 3 percent to just under 6 percent. Research universities in the top 5 percent similarly doubled interest as a share of their total spending from just over 2 percent to just over 4 percent. In comparison, interest as a share of total spending was flat at just under 3 percent for the bottom 95 percent of colleges for endowment wealth.
Islands of Privilege in Undergraduate Enrollments and Instructional Spending
THIS REPORT FINDS that undergraduate education has remained an island of privilege at schools with wealthy endowments despite their increase in resources from the endowment. Schools in the top 5 percent have maintained the same low levels of total undergraduate enrollment since 1990. Wealthy liberal arts colleges did increase low income enrollments as a share of all undergrads since 2009 in the aftermath of the Great Recession. Wealthy research universities, however, maintained the same low level of low-income enrollment. Simultaneously, wealthy liberal arts colleges and research universities used their growing endowment wealth to double instructional spending per student from 1987 to 2012. These trends reinforce the argument that the $19.6 billion estimated annual federal tax expenditure on endowments primarily supports the reproduction of existing inequalities by wealthy private colleges (Bourdieu and Passeron 1990; Collins 1979; Karabel 2005; Sewell and Hauser 1976; Stevens 2009).
Undergraduate enrollments We can best see that undergraduate enrollment has remained flat amid growing endowment wealth by examining annual degree award data since 1976. This is because degree award data is more consistent in IPEDS and undergraduate enrollment counts across the full time period. Figure 5 shows that total bachelor degree awards increased from 8,816 to 10,496 between 1976 and 1988 at the wealthiest research universities. Bachelor degree awards at wealthy liberal arts colleges similarly increased from 4,942 to 5,631 during this period. Bachelor degree awards have since remained flat. The wealthiest research universities awarded only 10,481 bachelor degrees in 2012. Wealthy liberal arts colleges awarded only 6,223 bachelor degrees that year. In contrast, bachelor degree awards more than doubled from 203,343 in 1976 to 428,208 in 2012 at public research university systems with campuses that are members of the elite Association of American Universities.
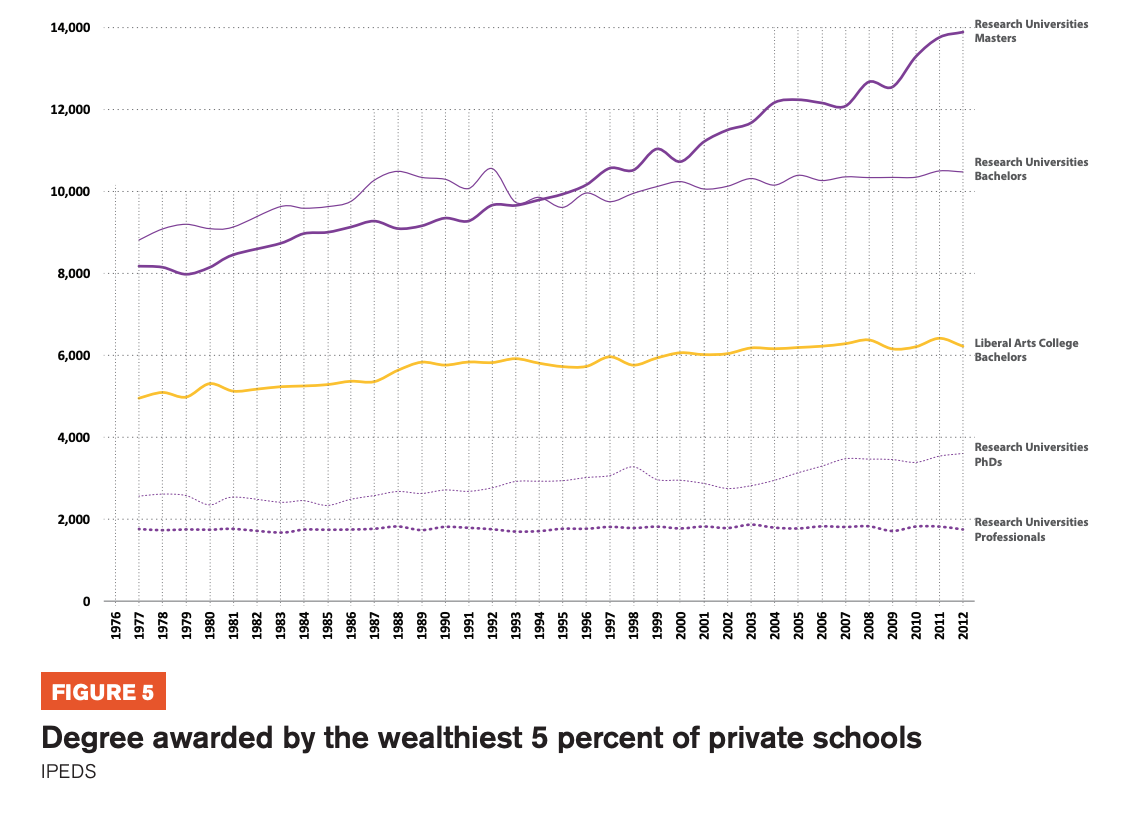
Absent public ownership or policy pressures, flat undergraduate enrollment makes sense because low admission rates to undergraduate programs tend to improve schools’ position in college and university rankings (Espeland and Sauder 2007; Espeland and Stevens 1998). This may explain why wealthy private universities continuously increased masters degree awards from 1976 to 2012. Admission rates to masters programs do not figure as prominently in rankings.
Low income undergraduate enrollment
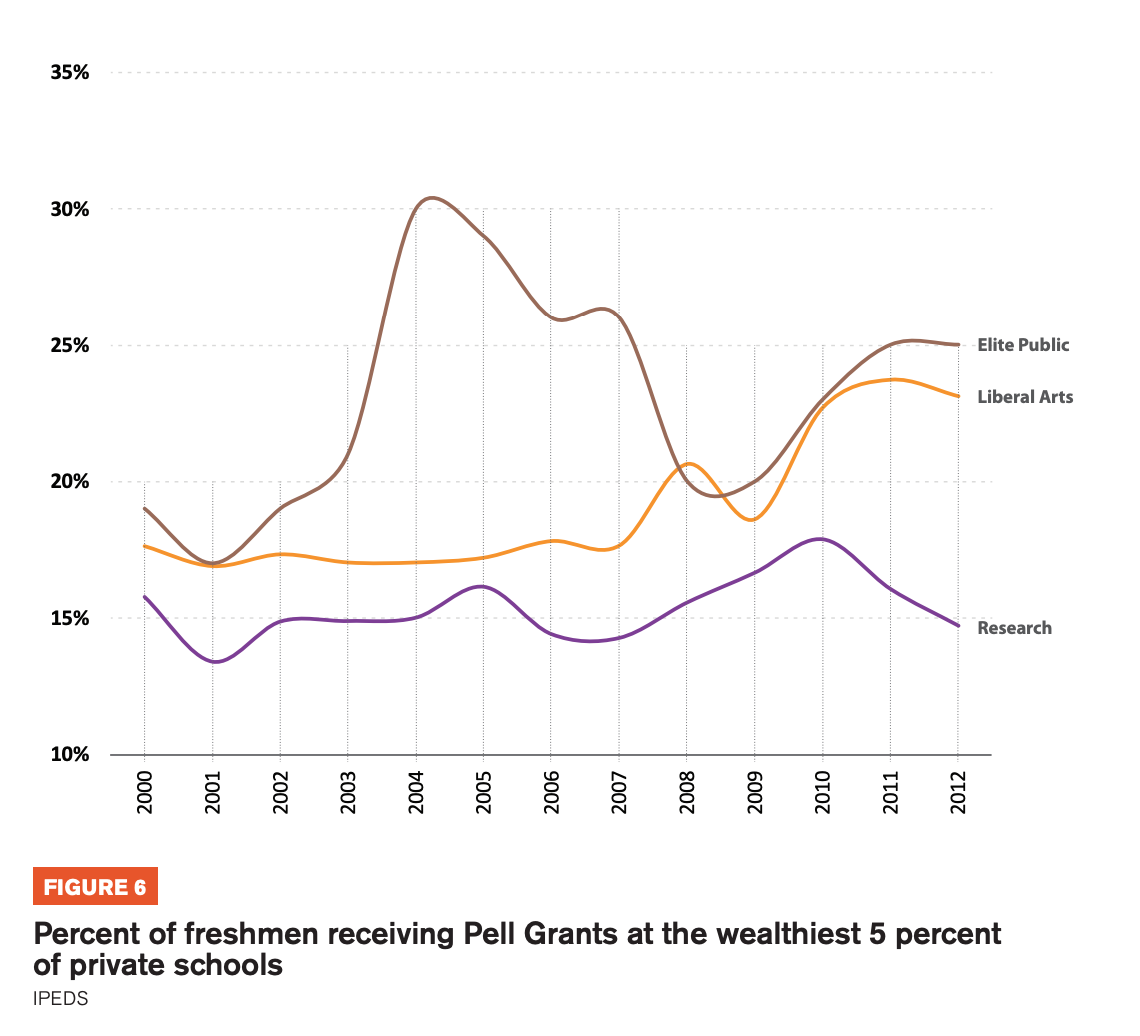
Wealthy liberal arts colleges began to increase low income enrollment in 2006 for the first time in the years for which data is available. Increased endowment wealth could have been useful for these efforts because low-income students often require reduced tuition along with room and board subsidies. The increased low-income enrollment at wealthy liberal arts colleges is reflected in Figure 6 which charts the share of full time freshmen who received Pell Grants—a federal financial aid grant that is the most consistent indicator available for low-income status prior to 2010. The increase n the share of freshmen receiving Pell Grants from 17 percent in 2006 to 23 percent in 2012 is no doubt partly a consequence of declining household income from the Great Recession. Still, the increase in Pell Grant recipients put wealthy liberal arts colleges almost on par for the first time with the elite public schools that are members of the American Association of Universities. In contrast, the share of freshmen receiving Pell Grants at wealthy private universities was just 15 percent in 2012, down from 16 percent in 2000.
A doubling of instructional spending per student
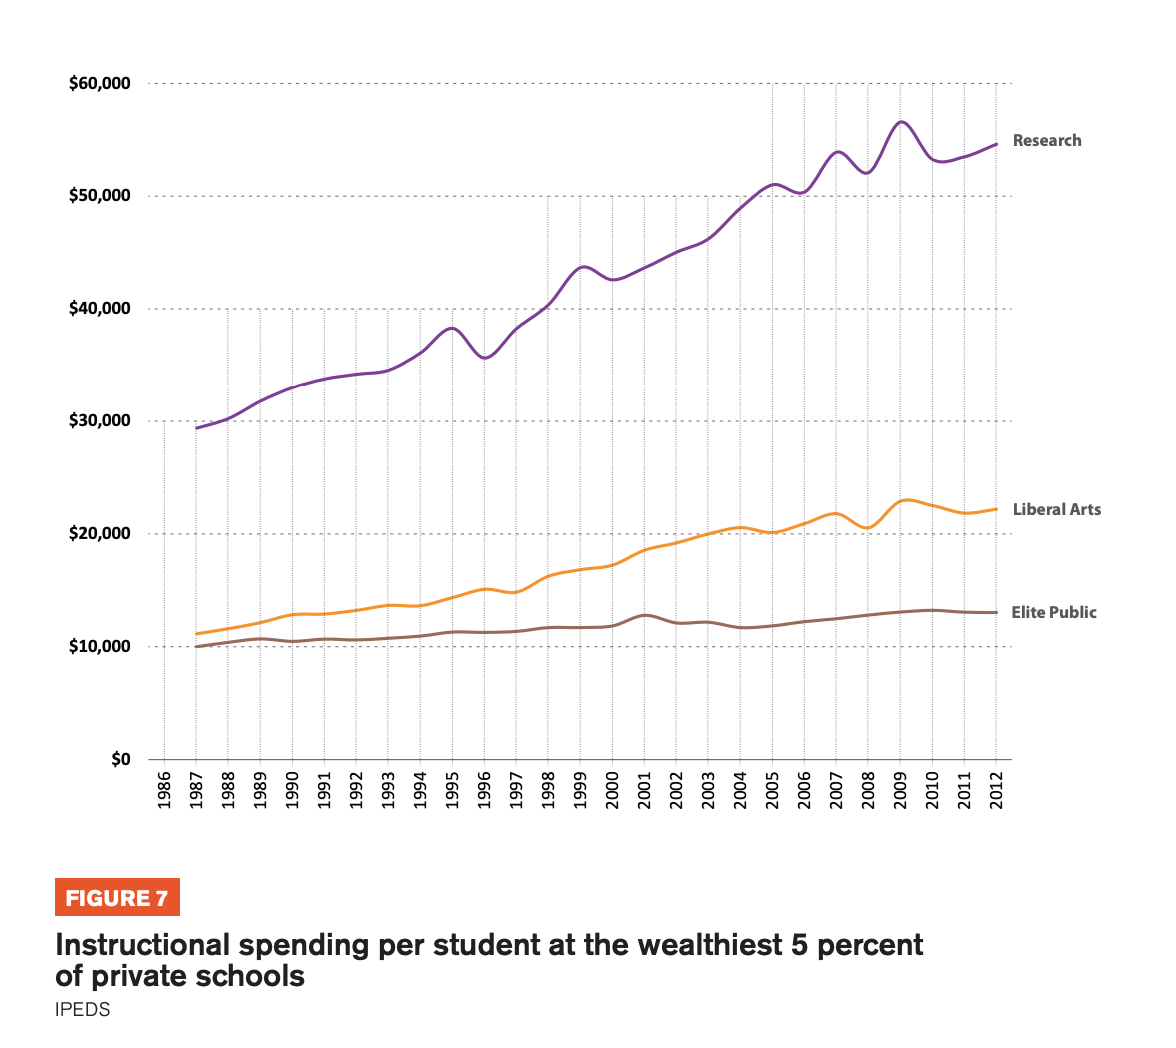
Spending on instruction per student appears to be the primary beneficiary of increased endowment wealth. This has given wealthy private colleges instructional spending levels far higher than at public and less wealthy schools, and helped to boost wealthy schools in college rankings (Espeland and Sauder 2007). Figure 7 shows that spending on instruction per student nearly doubled at wealthy research universities and more than doubled at wealthy liberal arts colleges from 1986 to 2012. Instructional spending per student in IPEDS includes funding for faculty time and overhead that may be devoted to research but is not covered by research grants. The relative increase of graduate student enrollment could also contribute to overall instructional cost increases per student at research universities because of the greater cost of graduate education compared to undergraduate instruction. But the doubling of spending on instruction per student at wealthy liberal arts colleges from $11,062 in 1987 to $22,165 in 2012 suggests that rising endowment surpluses indeed contributed to rising spending per student. In contrast, instructional spending per student increased just 31 percent from $9,982 in 1987 to $13,050 in 2012 at public research university systems with campuses that are members of the elite Association of American Universities.
Other revenue sources for increased spending?
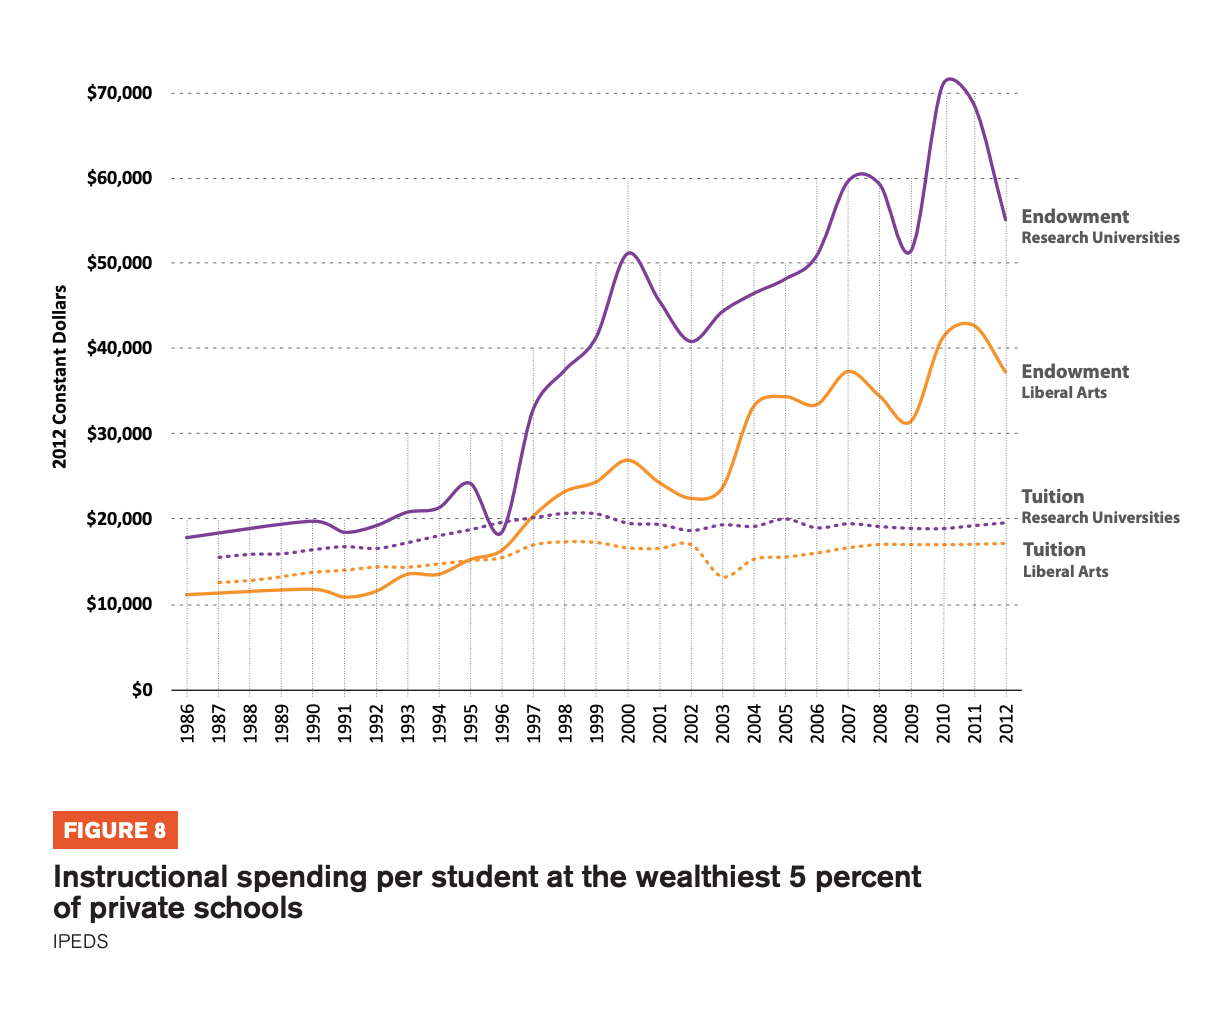
There were no comparable increases in revenue from sources other than endowments at wealthy universities that could have been used to double instruction spending per student. At research universities, research grant funding must go to research. Figure 8 shows that net tuition revenue per student increased somewhat from 1987 to 1998 but has since remained flat. This reflects the increasing use of tuition revenue from wealthy students to offer tuition discounts and financial aid for room and board to low income students. The net-tuition revenue measure in IPEDS reports tuition revenue after this reallocation. The result is that tuition revenue per FTE student increased by 33 percent from $15,459 in 1987 to $20,591 in 1998 at wealthy research universities. Net tuition revenue then actually declined slightly at wealthy research universities to $19,497 in 2012. Tuition revenue per student similarly increased by 38 percent from $12,568 in 1987 to $17,337 in 1998 at wealthy liberal arts colleges. Net tuition revenue then also declined slightly for wealthy liberal arts colleges to $17,151 in 2012. In comparison, spending per student from endowments increased at wealthy research universities by 209 percent from $17,848 in 1986 to $55,112 in 2012. Spending per student from endowments increased at wealthy liberal arts colleges by 234 percent from $11,151 in 1986 to $37,224.
Conclusion
THE WEALTHIEST PRIVATE undergraduate institutions benefited from major growth in endowment resources in the nearly four decades since 1977, even as state funding per student declined for public universities. Endowment spending per student increased by 751 percent from $9,724 in 1977 to $92,736 in 2012 in the 99th percentile for private endowment wealth per student. In the 95th to 99th percentiles, spending per student grew by 297 percent from $8,275 in 1977 to $32,868 in 2012. This growing wealth extended to 14 liberal arts colleges, 9 research universities, and one specialty institution in the top 5 percent for endowment wealth per student.
The increasing endowment wealth at the top occurred as financialization provided new asset growth investment strategies for colleges and universities. But the state also played a key role by providing a triple tax break for the endowment growth. Wealthy colleges and universities enlisted this state support to a greater extent by repurposing old tax benefits in new ways and at a greater scale. In particular, university financial managers engaged in new strategies of indirect tax arbitrage and the allocation of more donations to the endowment. I estimate that the total tax federal expenditure was $19.6 billion in 2012 for the exemption of endowment investment returns, income tax deductions for donations to endowments, and municipal bond borrowing in place of funding capital expenditures from either donations to the endowment. This is consistent with other studies that have examined only one of the three exemptions (Congressional Budget Office 2010; Joint Committee on Taxation 2008; Klor de Alva and Schneider 2015).
I propose new linkages of important theories of financialization, inequality in social policy, and educational stratification by conceptualizing the wealthy undergraduate institutions that receive these benefits as ivory tower tax havens. I break new ground in showing how financialization has intensified the extent to which state resources are directed in support of colleges and universities that disproportionately benefit more advantaged social groups. Institutionalist scholars of social policy have extensively shown that US social spending is unusually skewed toward upper income Americans when it relies on indirect tax benefits and private benefits like employer-sponsored health insurance or pensions (Hacker 2002; Weir, Orloff, and Skocpol 1988). Theories of educational stratification have also long emphasized that elite educational institutions tend to reproduce inequalities in social status and economic wealth (Bourdieu and Passeron 1990; Karabel 2005). In our current era of inequality, however, financialization provides new channels by which the increased profits of corporations, the financial sector, investors, and financial professionals can flow to our private institutions of elite education.
Two problems arise from the increasingly disproportionate allocation of resources to the wealthiest undergraduate institutions. First, some of those resources are badly needed at public and poorer non-profit schools that are challenged by stagnant or declining revenue and increasing public demands for postsecondary education. In the wake of deindustrialization, automation, and growth of technology industries, postsecondary education is more than ever a key path to economic security and social status (Goldin and Katz 2009; Hout 2012; Piketty 2014). High school graduates and adults who seek re-skilling or career changes often struggle to find adequate enrollment offerings at public institutions or affordable programs at private ones (Quinterno 2012; Scott and Kirst 2017; Stevens and Kirst 2015).
Second, the surpluses of wealthy private endowments are bound to generate social resentment among the less advantaged. Most Americans can only imagine what it would be like to attend an Ivy League school based on the memes and narratives that travel through social media and popular culture. Provocateurs of both left and right are thus poised to foment resentment at the federal tax expenditures in support of the wealthiest endowments. Republicans in the US Congress have held hearings on proposals to tax endowments at the urging of free market think tanks (Faler 2015). So have Democratic Connecticut state legislators (Lorin 2016). Others protest the large cut that hedge funds and internal endowment managers take from university endowment returns (Tannenbaum et al. 2016).
Wealthy colleges and universities appear to have taken note and responded in two key ways. First, Harvard, MIT, and Stanford have begun to experiment with mass online programs at low or no cost for those outside of their exclusive undergraduate cohorts (Stevens and Gebre-Medhin 2016; Stevens and Kirst 2015). Second, I showed earlier that some liberal arts colleges have begun to increase enrollments of lower-income students (Hannon 2016). It remains to be seen if other wealthy schools will follow suit and to what extent they will dip into their endowments to do so. And it is unclear if these initiatives can actually narrow the gap between an elite schools’ undergraduates and America at large. But the initiatives signal a recognition of the problem.
Policy shifts may be necessary for wealthy universities to change in ways that truly alleviate rather than inflame growing tensions over inequality. Pressures to prioritize prestige from alumni, faculty, and the rankings system make it risky for individual institutions to blaze new paths. The rankings dilemma illustrates the collective action problem. If one college chooses to enroll more students or spend more on programs for students outside of traditional degree programs, its rankings could fall. If all comparably ranked colleges initiate these changes together, the changes per se should not affect the rankings.
Further research is thus warranted regarding the prospects for policy change. This aligns with new programs of research on the relationship between American state building and US higher education (Loss 2011; Mettler 2005, 2014; Stevens and Gebre-Medhin 2016). I hope to have underscored here the need for this research program to consider how financialization has changed the terrain of both American universities and American political economy.
References
