


Challenges
Still, 14.3 percent (17.5 million) of US households were food insecure in 2013, and people of color and households with children headed by a single parent are disproportionately affected by food insecurity.11 SNAP faces several administrative, political, and policy challenges. While the following is by no means an exhaustive list, these challenges must be addressed in order to fulfill SNAP’s goals of income support and improving the welfare and nutrition of low-income populations.
1. Participation is Incomplete
Even though SNAP take-up rates are at an all-time high, participation varies widely across demographic groups and regions. The percent of eligible individuals who receive SNAP in the US is 83 percent, while in California it is only 57 percent, making it one of the lowest participating states in the country.12 People who are elderly, eligible non-citizens, or those who are working are the least likely to participate in SNAP.13
Reasons for non-participation include misinformation about eligibility and benefits, poor customer service, lengthy and time-intensive application processes, administrative churning, and stigma.14
2. Nutrition Remains Inadequate
Studies have shown that SNAP and non-SNAP participants equally value and are knowledgeable about nutrition, yet SNAP participants tend to eat less fruits and vegetables and are more likely to be obese than non-SNAP participants.15 This is found to be true starting at ages zero to five, and is especially true for young girls.16 However, it is unclear if poor nutrition among SNAP recipients reflects SNAP or reflects poverty and its influences. In the face of higher prices for nutritious foods, SNAP participants must allocate a higher share of both their income and time budgets to meeting their nutritional needs.17
Furthermore, while studies have shown that low diet quality persists for lower-income populations over time, the same can be said for the United States overall.18 In fact, Americans’ diet quality has been persistently low over time, with only a slight increase for those earning more than $75,000.19 This suggests that diet is difficult to change even under the best conditions.
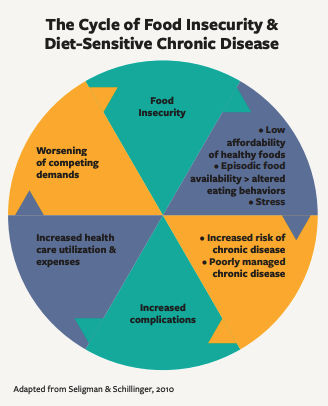
3. Coping Mechanisms Lead to Adverse Health Effects
Even though SNAP has been shown to reduce food insecurity, many SNAP recipients face regular periods of scarcity. With an average monthly benefit of $257 per household, SNAP participants are able to spend more on food at the point they receive benefits, but often run out of benefits by the end of the month.20 Food budgets are also further stretched as households struggle to pay for housing, education costs, transportation, and health services. The psychological and behavioral effects of poverty and fluctuations in food insecurity can lead to coping strategies such as hoarding, fasting, and bingeing, all of which can be severely harmful to health.21
4. Political Opposition to SNAP is Increasing
As SNAP participation rates have risen, political hostility towards the program has grown. The 2014 Farm Bill authorized $8.6 billion in cuts to SNAP over the next ten years. Furthermore, several states have reinstated a threemonth SNAP time limit for unemployed childless adults, while others have proposed reinstating drug felon bans, further restricting eligible food purchases, and requiring photos on benefit cards. Despite very low error rates, concerns over waste and fraud continue to threaten SNAP and its ability to support low-income populations.
- 11Coleman-Jensen, A., Gregory, C., and Singh, A. (2014). Household Food Security in the United States in 2013, ERR-173, U.S. Department of Agriculture, Economic Research Service.
- 12Cunnyngham, K. E. (2015). Reaching Those in Need: State Supplemental Nutrition Assistance Program Participation Rates in 2012. Alexandria, VA: U.S. Department of Agriculture, Food and Nutrition Service.
- 13 Eslami, E. (2014). Trends in Supplemental Nutrition Assistance Program Participation Rates: Fiscal Year 2010 to Fiscal Year 2012. Food and Nutrition Service, U.S. Department of Agriculture. Retrieved from http://www.fns.usda.gov/sites/default/files/ops/Trends2010-2012-Summary…
- 14U.S. Department of Agriculture, Food and Nutrition Service, Office of Research and Analysis. (2012). Building a Healthy America: A Profile of the Supplemental Nutrition Assistance Program. Alexandria, VA: U.S. Department of Agriculture, Food and Nutrition Service. 16.
- 15Mancino, L. and Guthrie, J. (2014). USDA Economic Research Service-SNAP Households Must Balance Multiple Priorities To Achieve a Healthful Diet. Retrieved from http://www.ers.usda.gov/amber-waves/2014-november/snap-households-must-…
- 16Condon, E., et al. (2015). Diet Quality of Americans by SNAP Participation Status: Data from the National Health and Nutrition Examination Survey, 2007-2010. Food and Nutrition Service, U.S. Department of Agriculture. Retrieved from http://www.fns.usda.gov/sites/default/files/ops/NHANES-SNAP07-10.pdf.
- 17See Mancino, L. and Guthrie, J. (2014). USDA Economic Research Service-SNAP Households Must Balance Multiple Priorities To Achieve a Healthful Diet, Retrieved from http://www.ers.usda.gov/amber-waves/2014-november/snap-households-must-…
- 18 Condon, E., et al. (2015). Diet Quality of Americans by SNAP Participation Status: Data from the National Health and Nutrition Examination Survey, 2007-2010. Food and Nutrition Service, U.S. Department of Agriculture. Retrieved from http://www.fns.usda.gov/sites/default/files/ops/NHANES-SNAP07-10.pdf.
- 19Wang, D. D., et al. (2014). Trends in Dietary Quality Among Adults in the United States, 1999 through 2010, JAMA Internal Medicine 174(10):1587-1595.
- 20Seligman, H. K., et al. Exhaustion of Food Budgets at Month’s End and Hospital Admissions for Hypoglycemia. Health Affairs 33.1 (2014): 116-123 and J. Shapiro (2005) “Is There a Daily Discount Rate? Evidence from the Food Stamp Nutrition Cycle” Journal of Public Economics.
- 21Wilde, P. E. and Ranney, C.K. (2000), The Monthly Food Stamp Cycle: Shopping Frequency and Food Intake Decisions in an Endogenous Switching Regression Framework, American Journal of Agricultural Economics 82.1 (2000): 200-213 and Seligman, H. K., et al. Food Insecurity is Associated with Diabetes Mellitus: Results from the National Health Examination and Nutrition Examination Survey (NHANES) 1999–2002 Journal of General Internal Medicine 22.7 (2007): 1018- 1023.

