


Empirical Findings
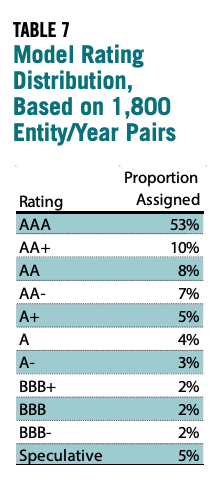
THIS RATING METHODOLOGY was applied to data for 300 cities and counties in California, Michigan, and Pennsylvania for the years 2007–2012. Most model inputs were obtained from Comprehensive Annual Financial Reports and Basic Financial Statements produced by these local governments. Unemployment data were obtained from the Bureau of Labor Statistics.54 Property value data were obtained from Zillow Research.55 Data for the 1,800 observations—300 municipalities over six years—were entered into the rating model outlined above. The model produced the rating distribution shown in Table 7.
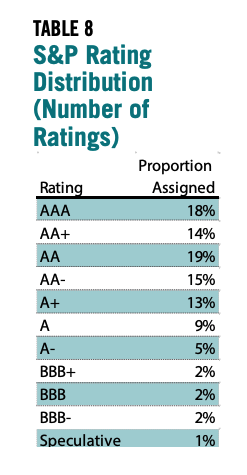
This compares to a recent S&P municipal rating distribution extracted from the agency’s XBRL filings shown in Table 8. Proportions refer to the number of ratings rather than the total par rated, and thus do not necessarily correspond to the rated par shown earlier in the interest cost calculation.The ratings distribution produced by the model is heavily skewed toward AAA, while the actual S&P rating distribution is more even. The top three categories in the S&P distribution cumulatively account for 51 percent of the ratings while the single highest category accounts for roughly the same proportion of the model distribution. The two distributions would be much more closely aligned if S&P ratings were uniformly shifted up by two notches—motivating the two notch assumption made earlier during the extra interest cost calculation.
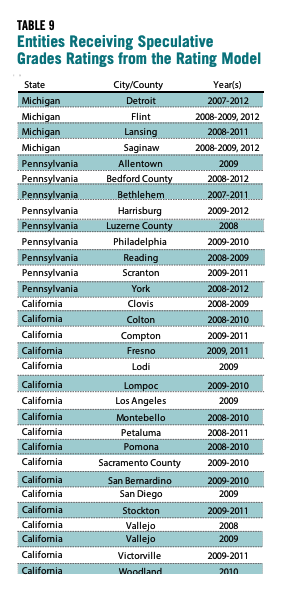
The model-generated speculative grade ratings (below BBB-) for several cities during one or more of the years in the analysis period. Table 9 provides a list of entity/year combinations in which a speculative grade rating was computed by the model: cities in the sample that defaulted since 2007 are Vallejo, San Bernardino, Stockton, Harrisburg, Scranton, and Detroit. All six appear on the speculative grade list. The model thus appears to effectively segregate defaulting municipalities from most of those that perform.
Detroit is rated below investment grade in all six of the years for which modeled ratings were calculated, suggesting that an index of accounting and economic values can provide substantial advance warning of a major default or bankruptcy—effectively performing the function now assigned to ratings analysts, but at lower cost.
I also considered one defaulting entity in another state: Jefferson County, Alabama. In this case, the model’s implementation encounters a complexity. The county declared bankruptcy in 2011, but was experiencing financial distress years earlier due to problems with its sewer system and the costs of its interest rate swaps.
The scoring system gives Jefferson County an A- rating in 2007 and a BBB rating in 2008. Its model-implied ratings then rise to A in 2009 and AAA in 2010. This counterintuitive result is largely explained by the Long Term Obligations / Total Revenue ratio which falls from 815 percent in 2008 to 15 percent in 2009 and 6 percent in 2010. As a result, the county received 0 points from this ratio in 2008, but 30 points each year thereafter.
The movement in this ratio was the result of a decision on the part of the County’s auditor to reclassify its bonded indebtedness as current liabilities. As stated in Jefferson County’s 2009 audited financial statements56 :
… the Commission has received Notices and Events of Default from the Trustee and certain banks for certain debt obligations and has been unable to meet its accelerated debt service obligations as they become due. While the terms of the outstanding warrants payable may ultimately be restructured with the creditors, under the current Events of Default and potential cross-defaults, the Trustees may declare the warrants due and payable on demand. Therefore, the outstanding warrants payable and related accounts have been classified as current liabilities in the accompanying financial statements. These conditions raise substantial doubt about the Commission’s ability to continue as a going concern without the restructuring of debt or other significant reorganization activities. (p. 5)
This suggests that, in implementing the model, it is necessary to review notes and auditor opinions when accounting values show large changes from year to year. In certain cases, model inputs may need to be adjusted to take into account considerations stated in these sections. In Jefferson County’s case, most of the entity’s current liabilities would have to be added back to long term obligations to effectively parameterize the model.
In addition, a model-based approach could include a scan for “going concern” language in each municipality’s audit and automatically assign non-investment grade ratings in such cases. Although government financial auditors do not consistently use “going concern” language for severely distressed municipalities, the Government Accounting Standards Board is considering the possibility of promulgating a standard in this area57 .
- 54http://download.bls.gov/pub/time.series/la/.
- 55http://www.zillow.com/research/data/.
- 56Jefferson County Commission Audited Financial Statements, September 30, 2009. http://jeffconline.jccal.org/Sites/Jefferson_County/AppData/DocLib/Main…. The quote mentions “warrants” which are bond-like instruments often issued in southern states.
- 57Government Accounting Standards Board (April 24, 2015). GASB adds pre-agenda research on going concern, debt; removes project on financial projections. http://www.gasb.org/cs/ContentServer?c=GASBContent_C&pagename=GASB%2FGA….

