Key Findings
- We find that 95.80 percent of total residential land area in California is zoned as single-family-only, and 30 percent of all land (including commercial and park space) area is zoned single-family-only, severely constraining the spatial possibilities for denser and more affordable housing.
- When unincorporated regions (which include vast swathes of sparsely populated land) are removed from the calculation, we find that 82 percent of total residential land area in the state is reserved for single-family housing.
- Single-family-only zoning averages 77.82 percent of residential land across 519 municipal and county jurisdictions, with a median of 83.93 percent.
- A total of 91 (51 incorporated and 40 unincorporated) jurisdictions in California have reserved 95 percent or more of their residential areas for single-family only housing units, effectively barring multi-family housing throughout those jurisdictions.
- The racial impacts are exclusionary: Jurisdictions with more restrictive zoning have fewer non-white residents. Although California is only 35 percent white, cities above 96 percent single-family-only zoning are nearly 55 percent white.
Introduction1
This report is the final and culminating report of a six year investigation into the extent, correlates, and putative effects of single-family-only residential zoning in California. This research project emerged out of a separate, multi-year examination of the nature and dynamics of racial residential segregation in the San Francisco Bay Area. Our examination of that issue made clear to us that restrictive land use policies – single-family-only zoning in particular – played a significant role in maintaining and exacerbating patterns of racial residential segregation in the Bay Area. We were further led to the conclusion that loosening such restrictive land use policies would be necessary to reverse levels of racial residential segregation in the future.
The final report in our Bay Area segregation series examined the specific relationships between racial composition, racialized neighborhood characteristics, and the degree or extent of single-family-only zoning. Broad and intense interest in this work spurred us to expand our analysis to examine the characteristics of restrictively-zoned neighborhoods within the Bay Area beyond racial characteristics, and then to extend our analysis to other communities and regions of the state. This resulted in a separate report on the “Characteristics of Exclusionary Communities” in the San Francisco Bay Area, followed by a series of regional zoning reports using a similar methodology, beginning with the Los Angeles region, followed by the regions of Sacramento, San Diego, Monterey, and Fresno. To accompany each of these reports we produced static and interactive regional maps that display the degree of restrictive zoning in each particular jurisdiction in visually distinct patterns. We also created an online directory archiving all the parcel-level data we collected for each region, allowing researchers to access this for their own purposes.
Although we found broadly similar relationships between restrictive or exclusionary land use policies and neighborhood composition, characteristics, and life outcomes, we also found striking variations between regions. Rather than recapitulate these findings, we encourage you to peruse these reports to observe the similarities and differences between them. In this report, our focus is on the state of California as a whole, while still noting differences between jurisdictions and regions in the course of our presentation.
To begin, we will present our overall findings regarding the extent or degree of single-family-only zoning across the state. Secondly, we will share our findings regarding the racial compositional and demographic relationships with exclusionary zoning. Thirdly, we examine the economic characteristics, such as median household income, of different communities based upon the degree of restrictive zoning. Fourthly, we present our findings regarding other statistical relationships of note between these communities. Fifthly, we identify jurisdictions, based upon a few characteristics, that may be most in need of zoning reform. Finally, we close with some general observations about this project.
A Brief Note on Methodology
There are many challenges in studying municipal zoning. We noted these in previous reports, and follow the same methodology throughout this series. Rather than recapitulate those details here, we direct your attention to this webpage (also visible on the right hand menu) which describes our approach.
An Overview of Single-Family-Only Zoning in California
California is a large and diverse state with a population of over 39 million people across 58 counties and 482 municipalities (incorporated cities, towns, and villages). We were able to collect and parse zoning data for 473 municipalities and 46 unincorporated jurisdictions (county authorities zoned these unincorporated areas).2
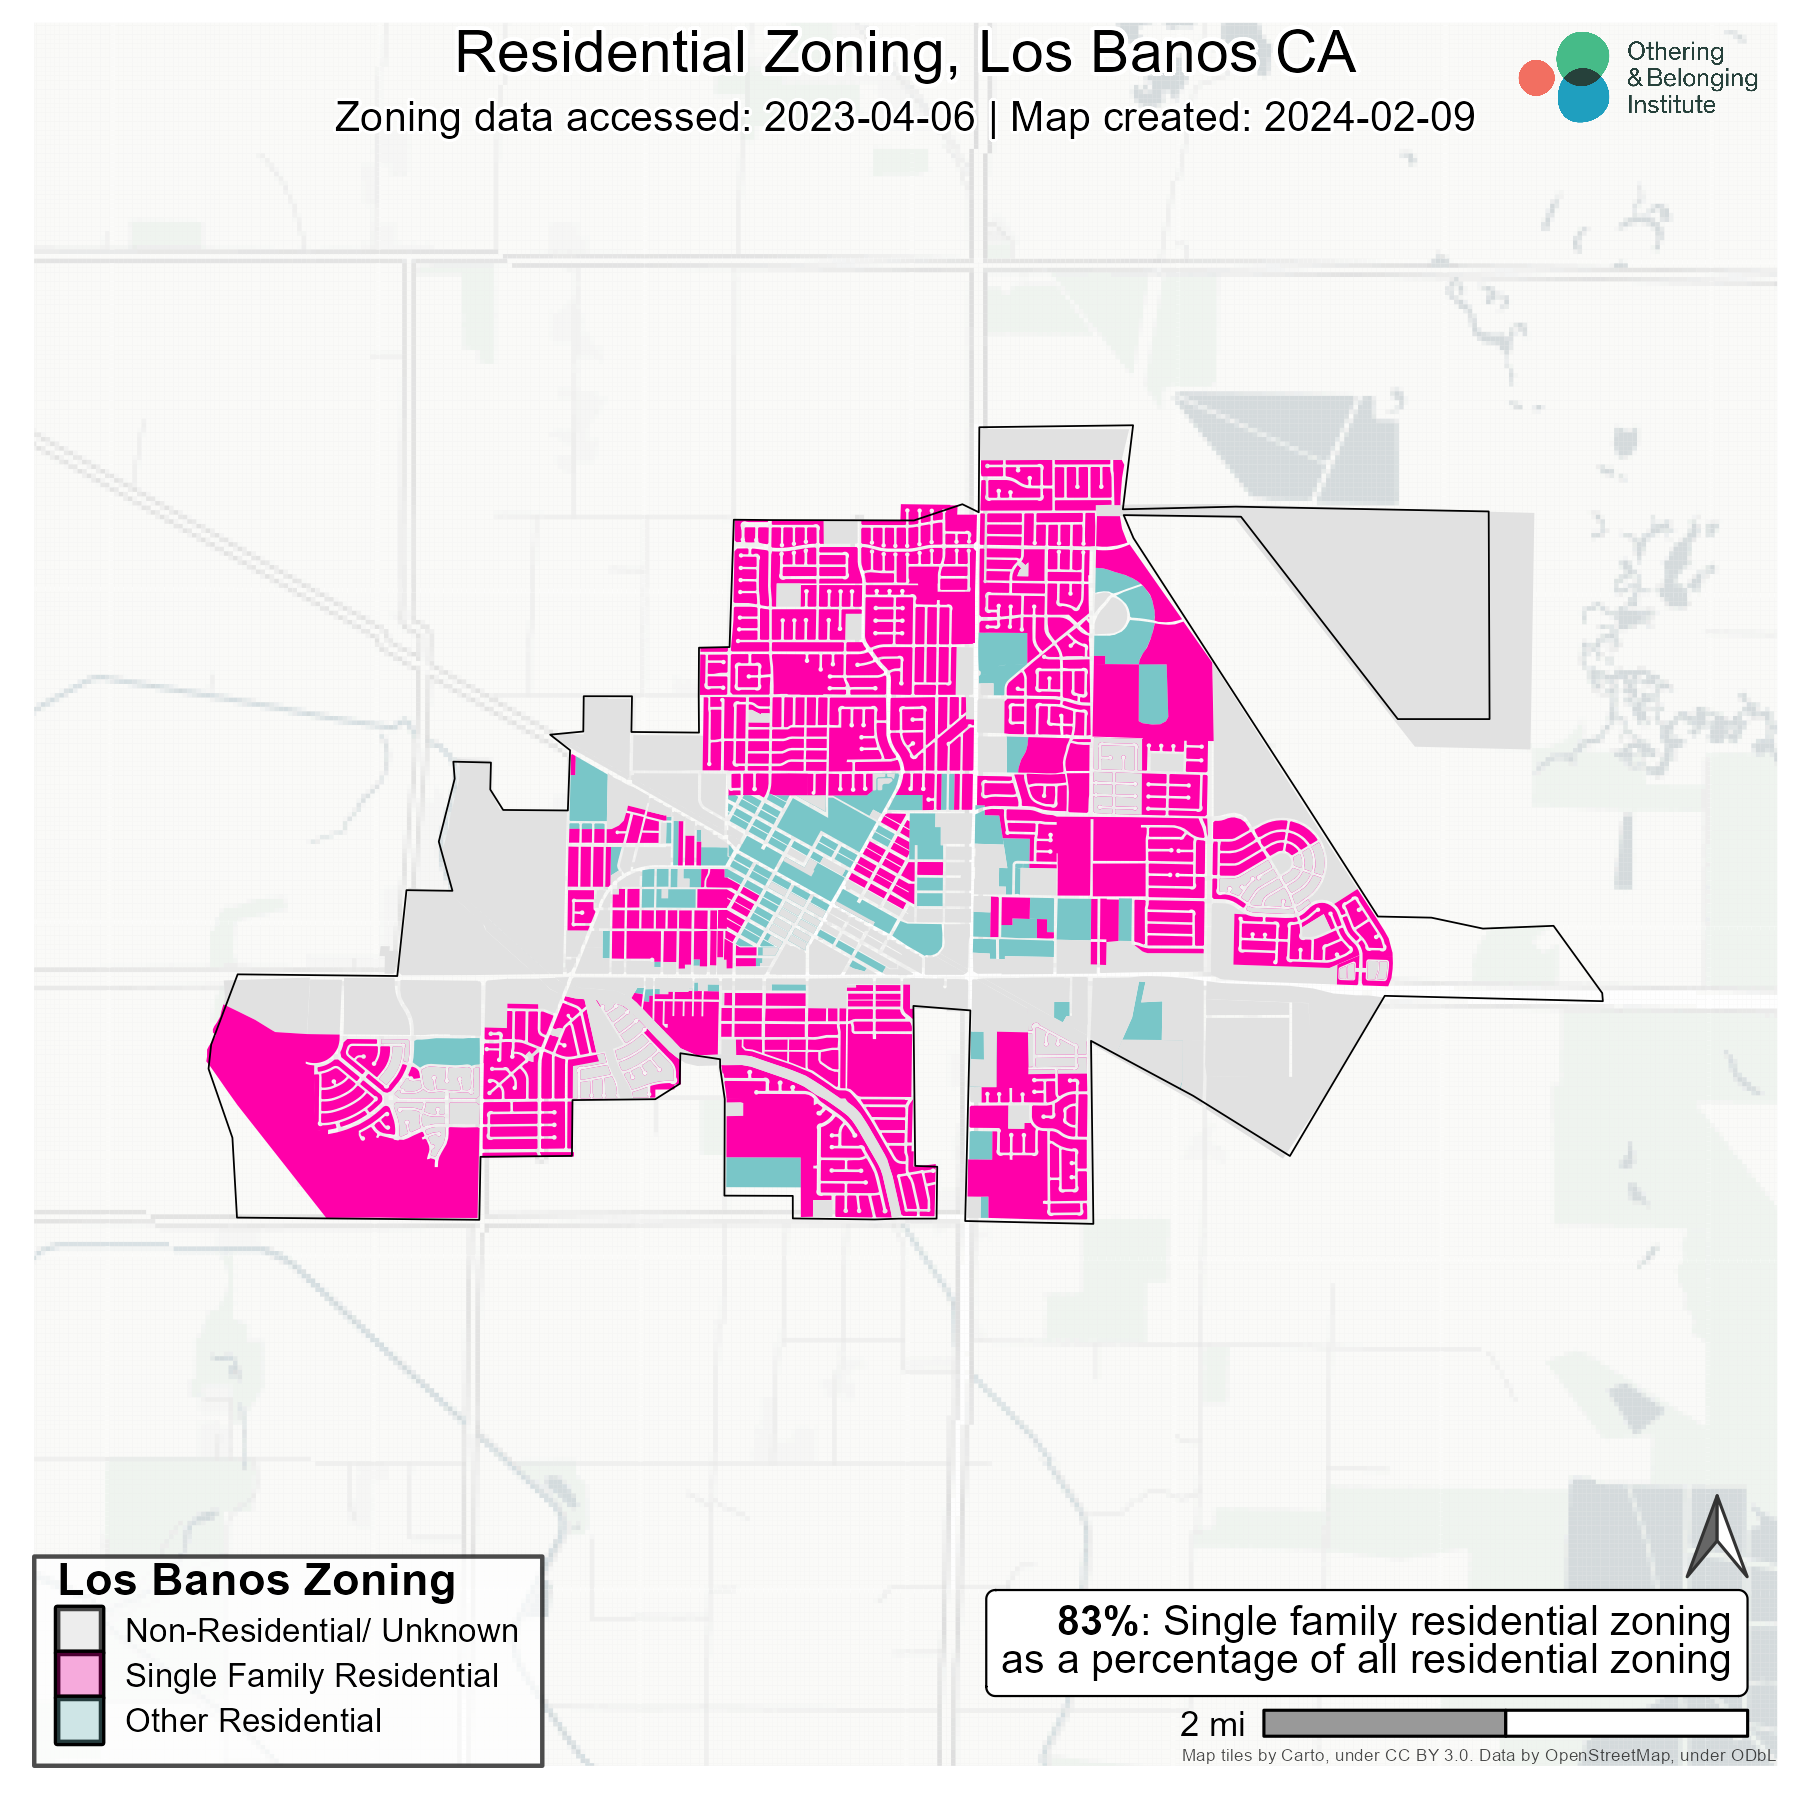
This yielded a data set of 519 jurisdictions with zoning authority and the capacity to impose restrictive zoning upon residential development. Figure 1, below, is our municipal zoning map for the city of Los Banos, located in Merced County, just to take one example from the hundreds of zoning maps we created. Maps for each all of these jurisdictions can be found here, or in the menu on the right side margin of this page.
Figure 1: Zoning map for the city of Los Banos, located in Merced County
Consistent with our regional reports, our main finding is that single-family-only zoning predominates residential areas, strictly limiting where multi-family and other denser housing can be developed and built. Specifically, across all jurisdictions in California, single-family-only zoning averages 77.82 percent of residential land in our analysis, with a median percentage of 83.93. When limiting our focus to incorporated areas only, single-family-only zoning averages 76.06 percent of residential land. For unincorporated areas, that figure is a much higher 95.95 percent, suggesting that county authorities with zoning power tend to be even more restrictive in exercising that authority than municipal leaders.
Figure 2, below, displays the volume of jurisdictions by the percentage of residential area that is zoned single-family-only, with the average displayed as a vertical red line.
Figure 2: Distribution of Single-Family Zoning as a Percentage of Residential Area in California
(Data for 519 jurisdictions; salmon-colored vertical line denotes statewide average (77.82 percent))

Our other main finding is that 95.81 percent of all residential land area is zoned single-family-only. As in our regional reports, a super majority of residential land is restricted for single-family homes, although that percentage is higher in more urbanized regions, where we would expect a greater need for denser housing options.3 While we understand the challenge with a land area statistic–especially in the United States’ third-largest state where unincorporated regions of larger areas can drown the variation in incorporated regions, and because of differences in policy-making systems that unincorporated and incorporated regions are subject to–this figure still stresses the magnitude and overwhelming presence of this policy subject.
In incorporated regions, 82 percent of residential land area is zoned for single-family only use. This translates to 41.22 percent of total area. In unincorporated regions, 96.74 percent of residential land area and 29.5 percent of total area is reserved for single-family only use.
Although there are 14 municipalities with 100 percent single-family-only residential zoning (effectively barring multi-family housing), 75 municipalities zone 95 percent or more of their residential area single-family-only. Table 1, which is linked here (and visible on the right-hand margin menu), has a listing of the most restrictive to the least restrictive incorporated jurisdictions in the state.
There is, as you can see from the table, remarkable variation across the state. Table 2, which is linked here (also visible in the right-hand menu), has an alphabetical listing of each of the counties in our dataset, with notes on the number of jurisdictions and percentage of single-family-only zoned areas in the jurisdictions of that county.
Consistent with our regional report, we find that Fresno has the smallest share of single-family-only zoning in residential areas when limiting to incorporated municipalities. On the other hand, Kern, Contra Costa, Marin, San Mateo, and Santa Clara feature the highest county-wise single-family zoning, respectively, among counties with 10 or more incorporated municipalities.
Single-Family Zoning and Race
One of our principal concerns is understanding the precise relationship between restrictive zoning and racial composition and demographics. Widening the lens to encompass the state provides a broader view of this relationship while affirming earlier findings. Specifically, we find that the percentage of non-white and white residents is strongly correlated with the percentage or extent of single-family-only zoning, as illustrated in Figure 3, below.
California is roughly 35 percent white, 39 percent Latino, 15 percent Asian, 5 percent Black, and 0.74 percent Native American.4 Yet, as we can see, the percentage of white residents is roughly 39 percent in jurisdictions with more than 87 percent single-family-only zoning and rises above 55 percent as the jurisdiction becomes more restrictive in its zoning practices. Conversely, the percentage of Latino residents drops precipitously as the percentage of single-family-only zoning rises.
Figure 3: Single-Family Zoning and Racial Composition (Horizontal lines show statewide racial percentage)

We note that Figure 3 (above) is most similar to Figure 3 in our Los Angeles zoning report. This is unsurprising because Los Angeles is the most populous region of the state, and contains the greatest number of jurisdictions.
Table 3, below displays the percentages in precise terms, of each racial group by significant segments of single-family-only zoning.
Table 3: Range of Single-Family-Only Zoning and Racial Composition
| % of Population | |||||||||
| Range of Average Single-Family Zoning % |
Cities in Bin | Average Single-Family Zoning (%) |
White | Asian | Black | Hispanic | NATAM | NHPI | Other |
| 0-4% | 15 | 0.62 | 39.11 | 7.18 | 3.41 | 44.76 | 0.76 | 0.23 | 4.55 |
| 4-8% | 2 | 5.11 | 29.12 | 0.82 | 1.32 | 60.13 | 5.65 | 0.17 | 2.8 |
| 8-12% | 3 | 10.25 | 25.38 | 8.05 | 4.5 | 57.1 | 0.18 | 0.33 | 4.45 |
| 12-16% | 1 | 12.71 | 5.4 | 9.12 | 1.42 | 82.56 | 0.05 | 0.24 | 1.22 |
| 16-20%5 | 1 | 18.91 | - | - | - | - | - | - | - |
| 20-24% | 1 | 21.09 | 15.86 | 26.34 | 6.92 | 44.69 | 0.31 | 1.23 | 4.65 |
| 24-28% | 1 | 24.62 | 1.89 | 0.72 | 0.76 | 95.68 | 0.18 | 0.13 | 0.64 |
| 28-32% | 6 | 30.35 | 22.09 | 9.26 | 4.17 | 60.77 | 0.54 | 0.3 | 2.87 |
| 32-36% | 0 | - | - | - | - | - | - | - | - |
| 36-40% | 3 | 38.47 | 17.19 | 16.63 | 13.46 | 48.31 | 0.21 | 0.15 | 4.05 |
| 40-44% | 8 | 42.22 | 45.38 | 16.49 | 4.41 | 26.29 | 0.25 | 0.5 | 6.69 |
| 44-48% | 4 | 45.55 | 16.83 | 10.87 | 8.56 | 60.24 | 0.43 | 0.36 | 2.71 |
| 48-52% | 12 | 50.45 | 57.23 | 11.45 | 2.34 | 21.18 | 2.07 | 0.18 | 5.55 |
| 52-56% | 5 | 53.56 | 47.17 | 5.99 | 2.91 | 38.82 | 0.43 | 0.21 | 4.48 |
| 56-60% | 10 | 58.08 | 34.29 | 19.96 | 1.95 | 38.89 | 0.21 | 0.23 | 4.47 |
| 60-64% | 15 | 62.51 | 34.74 | 10.67 | 4.63 | 44.51 | 0.73 | 0.33 | 4.41 |
| 64-68% | 16 | 65.78 | 37.32 | 10.24 | 3.95 | 42.96 | 0.86 | 0.2 | 4.48 |
| 68-72% | 27 | 69.75 | 32 | 13.95 | 2.61 | 46.8 | 0.27 | 0.25 | 4.11 |
| 72-76% | 35 | 73.84 | 38.78 | 11.03 | 4.02 | 40.47 | 0.51 | 0.4 | 4.79 |
| 76-80% | 35 | 78.13 | 36.77 | 15.22 | 4.52 | 38.18 | 0.39 | 0.38 | 4.55 |
| 80-84% | 59 | 81.89 | 35.88 | 13.03 | 3.17 | 42.72 | 0.36 | 0.41 | 4.43 |
| 84-88% | 65 | 86.03 | 36.7 | 11.69 | 3.12 | 43.35 | 0.49 | 0.26 | 4.39 |
| 88-92% | 61 | 90.08 | 42.69 | 15.36 | 3.79 | 32.31 | 0.37 | 0.3 | 5.18 |
| 92-96% | 48 | 94.01 | 46.59 | 9.53 | 4.02 | 33.95 | 0.51 | 0.25 | 5.15 |
| 96-100% | 40 | 98.8 | 54.82 | 17.43 | 2.12 | 19.74 | 0.28 | 0.15 | 5.46 |
Table 3 not only indicates significant differences in racial composition and demographics among these categories of jurisdictions based on their relative proportion of single-family-only zoning, but it also suggests the level of observed racial residential segregation. Specifically, it indicates that cities with a low to moderate or very high percentage of single-family-only zoning diverge more from the region as a whole in terms of their racial proportions, suggesting a higher degree of inter-municipal racial residential segregation in these communities. Starting from gray rows containing the 76-80 percent bins–close to the statewide average–the white share of the population grows higher than the California average of 35 percent, peaking at nearly 55 percent in cities featuring 96-100 percent single-family-only residential zoning. That this is true for 40 municipalities also reinforces our finding that zoning is used to maintain segregation, although often inter-district rather than intra-municipal.
Single-Family Zoning and Household Income
We find a direct relationship (a positive correlation) between median household income and the percentage of single-family-only zoning by jurisdiction. Household incomes increase as the percentage of single-family-only zoning rises. We interpret this pattern to support the supposition that this type of zoning has an economically exclusionary effect, making residential property more expensive so that lower-income people are unable to afford to live in such jurisdictions. Figure 4, below, illustrates this relationship
Figure 4: Median Household Income and Single Family Zoning

This chart shows a steep and dramatic increase in median household incomes as we move from areas with no single-family zoning to those that feature it exclusively. The blue line is the line of best fit.
Single-Family Zoning and Other Community Characteristics
In our regional reports, we highlighted the deleterious effects of single-family zoning on the community. Many community characteristics are shaped by the nature of land use permitted. Previous reports have highlighted the clear, and unfortunate, sorting of opportunity, educational attainment, wealth, exposure to pollutants by prevalence of single-family-only zoning. Areas featuring higher densities of restrictive zoning, on average, are racially whiter and economically wealthier as compared to areas featuring less restrictive residential zoning, especially those permitting multi-family housing. These neighborhoods and communities, on the other hand, are more racially non-white (mostly Asian and Hispanic, and to a lesser degree, Black), and contain greater exposure to pollutants at higher rates, slower wealth creation, and poorer educational outcomes. These patterns hold at the statewide level. In fact, the larger sample size (one region versus the entire state) produces stronger statistical conclusions than those listed in our regional reports.
Fourth Grade Reading and Math Proficiencies, SAT benchmarks, high school graduation rates, percentage of individuals holding bachelor's degrees, and percentage living in owner-occupied housing correlate positively with single-family zoning. Communities featuring high single-family zoning face a much lower “cumulative pollution burden” as measured by CalEnviroScreen indicating healthier communities. Specific environmental outcomes–exposure to PM2.5, risk of lead exposure–fare better in areas with high single-family zoning. These outcomes are displayed in Figures 5 and 6 below.
Figure 5: Single-Family Zoning versus Environmental Outcomes6

Figure 6: Single-Family Zoning versus Educational Outcomes

Figure 6 divides communities into three groups, based upon the range of single-family-only zoning maintained as a percentage of residential land area. As Figure 6 indicates, the most restrictively zoned communities have the strongest outcomes, as predicted based upon our theory of restrictive zoning as opportunity-hoarding. The first graph shows us that 4th Grade reading proficiency is 7 points higher in jurisdictions where single-family zoning is at least 88 percent versus those where single-family zoning is 66 percent and under (55 percent reading proficiency vs. 48 percent reading proficiency, respectively). The second graph similarly shows a 7 point gap for 4th Grade Math proficiency by jurisdictions on the opposite ends of the zoning spectrum (51 percent vs. 44 percent). And the gap is 6 points for SAT benchmarks (50 percent vs. 44 percent).
Figure 7 (below) displays outcomes also consistent with the theory of restrictive zoning as opportunity hoarding.
Figure 7: Single-Family Zoning versus Community Characteristics Obtained from ACS (2020)

Identifying Cities for Reform
As in our regional reports, we attempt to identify cities that may be strong candidates for zoning reform in the state. In our previous reports, we applied several simple selection criteria to identify jurisdictions that would be good candidates for zoning reform. In addition to those same factors, we are also adding an analysis of the city’s racial and economic demographics relative to the region.
The criteria we have previously used to select jurisdictions that would serve the region by reforming their zoning regulations included:
1) The percentage of single-family-only zoned residential areas
The greater the proportion of single-family-only residential zoning, the more likely it is that a jurisdiction is excessively restrictive and should permit greater density and a variety of residential uses. This indicator selects only jurisdictions with a high or extremely high level of single-family-only zoned areas.
2) The percentage of the jurisdiction that is designated as “high opportunity” on the state’s COG-based opportunity maps
The Tax Credit Allocation Committee’s official opportunity maps already guide the state’s allocation of federal subsidies for affordable housing, and for that reason are useful indicators for identifying jurisdictions with a high degree of opportunity.7 Jurisdictions with a greater share of high-opportunity neighborhoods are better targets for reform in relation to equity objectives. Here, we chose municipalities with 85 percent or higher neighborhoods designated high-opportunity areas.
3) Distance from regional economic centers (central business districts)
This indicator is a proxy for access to jobs. Upzoning areas that are remote or difficult to access makes far less sense than upzoning neighborhoods that are already accessible and proximate to jobs and businesses. Therefore, we excluded jurisdictions too remote from job centers as places to prioritize reform. We selected municipalities where the commute is 40 minutes or less from the nearest central business district. There are other, possibly more direct measures of job proximity, but this measure has the additional benefit of reflecting significant existing transit infrastructure. Central business districts are accustomed to accommodating large numbers of daytime workers. We apply this criteria both in terms of distance and travel time.
4) Poor performance with RHNA targets
The Regional Housing Needs Assessment (RHNA) requires that every jurisdiction in the state plan for housing at five different income levels: "very-low," "low," "moderate," "above-moderate," and "high."8 Jurisdictions are required to zone for local needs, but in practice, jurisdictions do not meet their RHNA requirements.9 Jurisdictions that perform especially poorly with respect to RHNA targets for low and very-low income housing are excellent candidates for zoning reform because government agencies have already determined that they should have a greater share of affordable housing developments. Table 4 below displays our results, in which we identified more than 40 cities across the state as strong candidates for reform.
- Table 4: Jurisdictional Candidates for Zoning Reform and Selection Indicators
-
Cities Single Family % % of Neighborhoods in
High Opportunity CategoryRHNA Low & Very Low
Income Completion10Minutes from CBD Miles from CBD11 Bradbury 100.00% 100% 0 31.3 17.3 La Habra Heights 100.00% 100% 0 31.5 15.2 Rolling Hills 100.00% 100% 0 39.7 21.1 Villa Park 100.00% 100% 0 15.5 6 Orinda 100.00% 100% 0 14.4 7.3 La Canada Flintridge 99.00% 100% 0 17.8 11.1 Walnut 99.00% 100% 0 32.5 19.6 Lafayette 98.00% 100% 0.02 17.9 10.3 Moorpark 96.00% 100% 0.05 34.3 18.3 Chino Hills 96.00% 100% 0 39.6 16.3 Clayton 95.00% 100% 0.03 37.6 20.9 Encinitas 95.00% 100% 0.07 33.8 23.7 Danville 95.00% 100% 0.03 32.4 16.6 Belvedere 94.00% 100% 0 31.3 7.1 Los Gatos 94.00% 100% 0.01 19 8.4 Diamond Bar 94.00% 100% 0 27.9 17.6 Rolling Hills Estates 94.00% 100% 0 33.3 20 La Mirada 93.00% 100% 0 22.5 13.1 Glendora 93.00% 100% 0 38.3 23.7 Loomis 92.00% 100% 0 29.8 22.5 Del Rey Oaks 91.00% 100% 0 20.9 11.1 Pacifica 91.00% 100% 0 23.6 11.9 Cupertino 91.00% 100% 0.03 19.2 9 Moraga 91.00% 100% 0 26.8 8.6 Rocklin 91.00% 100% 0 31.4 20.5 Cerritos 90.00% 100% 0 23.6 13.8 San Dimas 89.00% 100% 0 35.7 25.1 Tiburon 89.00% 100% 0.03 30.7 7.9 San Carlos 89.00% 100% 0.06 34.8 21 Millbrae 88.00% 100% 0 23.7 12.3 Belmont 88.00% 100% 0 33.2 19.3 Ojai 87.00% 100% 0 36.8 17.6 Livingston 87.00% 100% 0.01 19.8 14.4 Palo Alto 86.00% 100% 0.09 29 14.8 Walnut Creek 86.00% 100% 0.06 26.2 14.4 Arcadia 85.00% 100% 0 24.9 13.1 Agoura Hills 85.00% 100% 0 36.1 24.2 Fowler 84.00% 100% 0 15.8 10.2 Scotts Valley 84.00% 100% 0.05 10.8 5.7 Burlingame 83.00% 100% 0 22.3 13.5 Brea 81.00% 100% 0 19.6 12.2 Exeter 80.00% 100% 0.01 15.1 8.6 Temple City 80.00% 100% 0.03 19.1 11.2 Oakdale 80.00% 100% 0 25.9 11.9 Manhattan Beach 79.00% 100% 0 28.7 14.3
Conclusion
We hope this report contributes to the ongoing education of the public on the role of zoning in shaping life outcomes, racial equity, and economic inequality. We remain available to answer questions about this report or details about our data, maps, findings, or methodology.
Although this report wraps up our examination of single-family-only zoning, it does not conclude our study of zoning in California. As noted at the top of this report, this research is now connected to another project, the California Zoning Atlas. As part of this project, we are compiling detailed information about the zoning districts of every jurisdiction within the state. Please follow our progress on that project as well.
- 1The authors have many people and organizations to thank for supporting and making possible this work. We would like to thank, first and foremost, Joshua Cantong, Data Analyst at the Othering and Belonging Institute for their valuable insights and contributions. We would also like to thank Arthur Gailes, Karina French, Chih-Wei Hsu, Marina Blum, and Martine Johannessen for their valuable research contributions to this series. We would also like to extend gratitude to the Center for Regional Change at UC Davis, to Clancy McConnell, and to their team of students, namely Aleksandra Kalnozola, Anthony La, Miri Kim, and Tara Safavian for helping collect zoning data for the Fresno region.
- 2Details of the 9 municipalities and 1 unincorporated area not captured in our analysis are as follows. Spatial data, the basis for our analysis, was not available for 4 municipalities: Alturas (in Modoc County), Susanville (Lassen County), Loyalton (Sierra County), and Portola (Plumas County). South Lake Tahoe (El Dorado County), Industry and Vernon (Los Angeles County), and Isleton (Sacramento County) did not feature any residential zoning. Maricopa (Kern County) featured a mismatch between zoning code and spatial data. The zoning code for Kings County was not available.
- 3We should be clear to emphasize, as we have before, that single-family housing is not the same thing as single-family zoning. Multi-family housing or other forms of housing and development can exist in areas zoned exclusively for single-family homes for a variety of reasons, not least of which is that such structures may precede the most recent zoning code. Other reasons may include spot variances, where developers can sometimes get permission to build at variance from the neighborhood zone designation. We state this in our appendix, but to repeat: Zoning codes do not always reflect the built environment, and vice versa. Our maps and analyses are of zoning, not the built environment. While the actual built environment may be the most relevant piece of information for some purposes (such as researchers or policymakers who are primarily concerned with the production of housing), our research is focused on better understanding how zoning designations themselves shape or correlate with certain community characteristics and life outcomes.
- 4Hispanic or Latino, and Not Hispanic or Latino by Race," United States Census Bureau, accessed May 20, 2024, https://data.census.gov/table/DECENNIALCD1182020.P9?g=040XX00US06. This figure also include these Census designations: “American Indian and Alaska Native alone”, and “Hawaiian and Other Pacific Islander alone
- 5Demographic data for Plymouth (Amador County) could not be accessed.
- 6SAT benchmark data sourced from California Department of Education’s SAT Data Report 2020, https://www.cde.ca.gov/re/pr/satdata.asp
- 7This opportunity map uses the same methodology as the state’s TCAC Opportunity Map, but all tracts within Councils of Governments (COGs) are scored against each other. Tracts that do not fall within a COG are scored against tracts within their county. By comparison, the TCAC opportunity map uses TCAC regions as the reference geography. The TCAC/HCD map also scores rural areas separately because rural affordable housing developments compete in a separate funding pool, but such a distinction is not made here.
- 8“Regional Housing Needs Assessment,” Sacramento Area Council of Governments, https://www.sacog.org/regional-housing-needs-allocation-rhna.
- 9Heather Bromfield and Eli Moore, Unfair Shares: Racial Disparities and the Regional Housing Needs Allocation Process in the Bay Area, (Berkeley, CA: Haas Institute for a Fair and Inclusive Society, 2017), http://belonging.berkeley.edu/sites/default/files/haasinstitute_unfairshares_rhnabayarea_publish.pdf. Although we allocate some blame to municipalities, they are not entirely to blame for unmet RHNA targets. Cities can permit or rezone for housing, but generally private developers are responsible for what is ultimately built.
- 10Division of Housing Policy Development, “Annual Progress Report Permit Summary Table (K2 - AN542),” RHNA 5th Cycle Full Summary, (Sacramento, CA: California Department of Housing and Community Development, 2019), https://www.hcd.ca.gov/community-development/housing-element/docs/annual_progress_report_permit_summary.xlsx. For a grade ranking of cities by RHNA performance, see Nikie Johnson and Jeff Collins, “Report Card: California Cities, Counties Failing Again on Affordable Housing Goals,” Orange County Register, January 31, 2021, https://www.ocregister.com/2021/01/31/report-card-california-cities-counties-failing-again-on-affordable-housing-goals/.
- 11Central Business District Coordinates Dataset (2013), distributed by Daniel Hartley, https://www.danielaaronhartley.com/.