


This increased cost to municipalities included in the study is measured to be $2 billion annually. The paper considers multiple additional costs associated with lower credit ratings—increased interest costs, insurance wrappers, and rating fees.
Lower ratings typically result in higher interest rates – increasing the amount municipal borrowers must repay investors. Low-rated municipalities can purchase insurance to lower their rates, but history has shown that bond insurers are often more risky than the government bonds they ensure. The nexus of low ratings and needless bond insurance provides a mechanism by which the financial industry can extract wealth from local governments.
Read a web version of the report here.
Abstract
Introduction
WHEN LOCAL GOVERNMENTS OVERPAY for financial services, the extra costs must be borne elsewhere. Since cities cannot print money, they must either raise taxes or reduce services to offset extra money paid to bond investors and financial industry providers. One type of financial service is the assignment of credit ratings, which tell bond investors how much risk they incur by purchasing the local government’s obligations. Since US local government debt issues rarely default, the rating process should be straightforward and inexpensive. Instead, the credit rating process imposes substantial direct and indirect costs on issuers, resulting in higher taxes and degraded public services.
In this study, I measure the financial burden of the credit rating system on US municipal bond issuers and propose a less costly alternative rating approach. In addition to the fees rating agencies collect from municipal bond issuers, I also estimate costs municipal bond issuers incur because they are rated more harshly than corporate and structured finance issuers. These costs take the form of higher interest expenses and premiums on municipal bond insurance policies—which municipalities would not need if they were rated on par with corporate bond issuers. I also discuss the connection between low ratings and accelerated swap termination payments that some municipalities have or will incur—although I don’t include this affect in the total.
After measuring the cost of the current rating system, I outline and assess a model-based municipal rating system that generally assigns higher ratings. I find that, despite being more lenient, this system would still have been able to alert investors to the risks of bonds offered by defaulting cities such as Detroit, Michigan; Harrisburg, Pennsylvania; and Stockton, California.
A model-based rating system like the one proposed here would reduce municipal financing costs. It would also lead to lower rating fees by allowing greater automation of the credit ratings process.
This study begins by surveying evidence that municipal bond ratings are indeed more severe than those for other asset classes. With that basis, I then estimate the overall cost of the municipal rating system. Finally, I describe the model based alternative and provide some preliminary results from the proposed rating model.
Harsh Municipal Bond Ratings
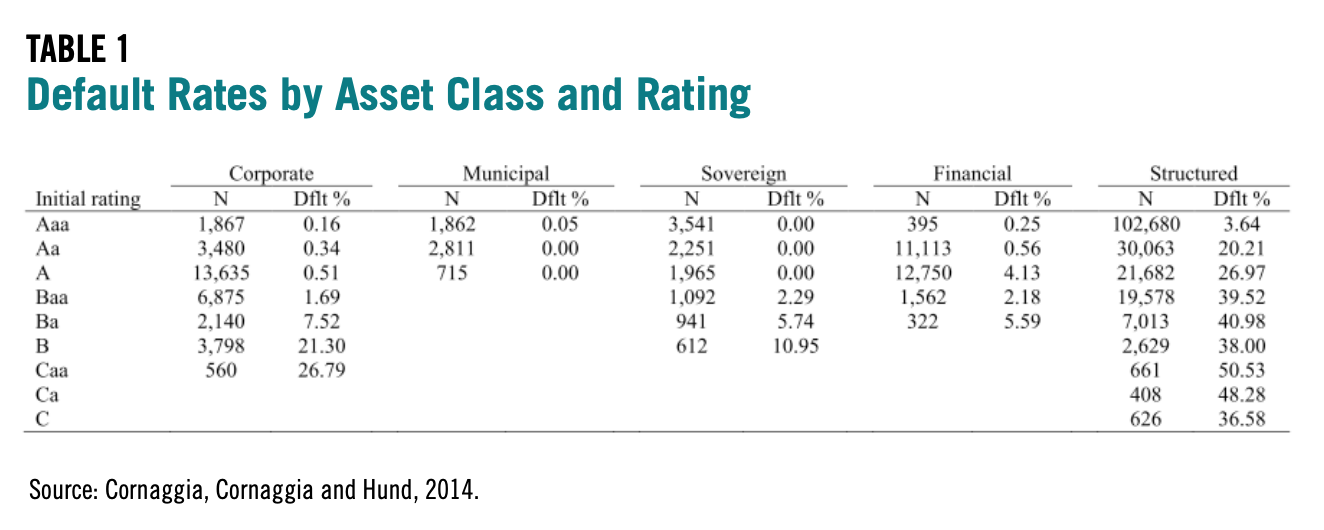
CORNAGGIA, CORNAGGIA, AND HUND1 evaluated default rates by major asset class by Moody’s rating. Their results are reproduced in Table 1.
High default percentages for Aaa and Aa bonds suggest more lenient rating standards. Overall, the authors find that government bond issuers (sovereign and municipal) are rated more harshly than corporate issuers—including financial corporations—which are rated more harshly than structured finance securities. They further observe that rating severity is inversely proportional to rating fee levels. Rating agencies charge structured finance issuers the most and government bond issuers the least, with corporates in between.
These findings are corroborated by Micah Hauptman and Barbara Roper in a March 2014 Securities and Exchange Commission (SEC) comment letter.2 The authors reviewed forms Nationally Recognized Statistical Ratings Organization (NRSRO) filed by Moody’s, Standard & Poor’s and Fitch, observing large differences in default and downgrade behavior across asset classes. The authors conclude:
Ratings agencies are likely to grant more favorable ratings to issuers who are likely to seek significant current and future business. This phenomenon is likely reinforced when there are few issuers in a certain asset class, which is common in the structured finance arena, because those issuers will choose whichever NRSRO rates their securities most favorably, and because NRSROs won’t risk losing any business from an issuer with such market power. (Page 25)
Since the municipal bond market is fragmented among tens of thousands of relatively small issuers, a local government has far less ability to affect rating agency behavior than Goldman Sachs, JP Morgan and other major financial industry players that create structured finance instruments.
Within the broad category of government bond issuers, US states have performed exceptionally well. In fact, the last time any state entered default status was 1933, when both Arkansas and Louisiana missed interest payments. Louisiana’s problem—the result of a local bank failure—was quickly rectified. Arkansas did not fully emerge from default until 1941, when the Reconstruction Finance Corporation—a federal agency—purchased previously non-performing Arkansas bonds at par (meaning that private bondholders experienced no loss of principal).3
Thus, US states have reliably serviced their bonds for as long as most anyone can remember. Yet most of their obligations do not receive the highest ratings from the major rating agencies. For example, rating histories published by the California State Treasurer4 show that all three major rating agencies have rated California below AAA/Aaa5 since the early 1990s.
Moody’s6 downgraded California from Aaa to Aa1 in February 1992. Since then, the state’s rating has fallen as low as Baa1, which is seven notches below Moody’s highest rating. Currently, Moody’s assigns California a rating of Aa3, three notches below Aaa. Two states—Illinois and New Jersey—currently have lower ratings than California: A3 and A1 respectively.
In 2008 Congressional testimony7 , Moody’s Senior Managing Director Laura Levenstein stated:
Investors in corporate or structured securities typically have looked to Moody’s ratings for an opinion on whether a security or an issuer will meet its payment obligations. Historically, this type of analysis has not been as helpful to municipal investors. If municipal bonds were rated using my global ratings system, the great majority of my ratings likely would fall between just two rating categories: Aaa and Aa. This would eliminate the primary value that municipal investors have historically sought from ratings—namely, the ability to differentiate among various municipal securities. I have been told by investors that eliminating that differentiation would make the market less transparent, more opaque, and presumably, less efficient both for investors and issuers (Page 122).
Levenstein asserts that Moody’s provided the harsher rating scale for municipal bonds because of investor demand. But I wonder whether Moody’s surveyed a good cross-section of municipal bond investors, which include large numbers of individuals—who rarely have any reason to contact a rating agency and who were probably unaware that rating agencies have separate standards for municipal bonds. Most likely, the universe of investors Levenstein and her colleagues consulted included a disproportionate number of bond insurers, who had a vested interest in perpetuating inconsistent rating methodologies—as discussed below.
If rating agencies were primarily concerned with providing greater differentiation among municipal bonds, they could have used a different set of symbols for these securities. They could have even assigned governments a fiscal score on a 0–100 scale.8 Joseph Pimbley notes that rating agencies already use different scales for short term debt and preferred stocks.9 Pimbley continues:
Had the CRAs truly wished to rate municipal bonds with different meanings for the ratings, they would have created rating scales with distinct symbols and explained them clearly. A good faith attempt to explain to investors, issuers, regulators and other stakeholders that municipal and corporate ratings are entirely dissimilar and incomparable would have required at the very least the imposition of distinct rating symbols (Pages 7–8).
Municipal Bond Insurance
LOWER BOND RATINGS tend to be accompanied by higher interest rates. Thus, relatively harsh municipal bond ratings raise state and local government debt service costs. Governments have often ameliorated these extra costs by purchasing bond insurance. When a municipal bond issuer purchases bond insurance, its bonds carry the insurer’s rating. State and local government borrowers—which receive ratings lower than that of a given municipal bond insurer—may be able to reduce borrowing costs by purchasing an insurance policy
However, the performance of municipal bond insurers during the financial crisis was quite poor, and very inconsistent with their high ratings.10 The bond insurance business began with the formation of Ambac in 1971. By 2008, Moody’s rated eight of the nine active bond insurers.11 These ratings are shown in Table 2.
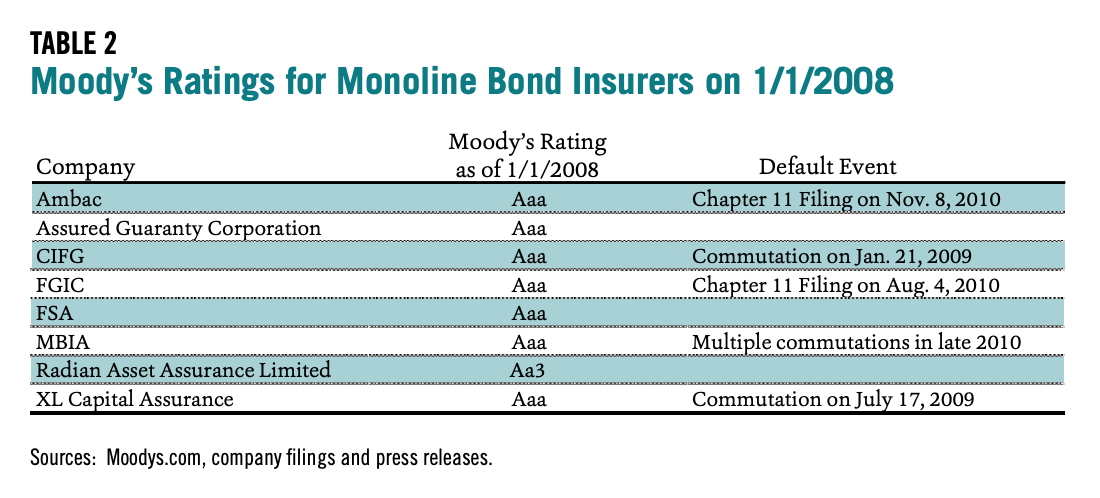
With the benefit of hindsight, it is clear that the ratings of states and bond insurers were highly inconsistent. Of course, rating agencies do not have the benefit of hindsight when publishing their assessments, so individual ratings cannot be guaranteed to be accurate. That said, the failure of a majority of Aaa entities within a given asset class should give cause for concern.
One fact that was obvious before the financial crisis was that bond insurers had a much shorter track record than US state and local governments. Lack of operating history for an organization or an industry should be seen as a source of credit risk. By the time the bond insurance industry began, US states already had three decades of pristine credit (a 1933 default by Arkansas was resolved in 1941), but many states were rated below Aaa. By contrast, a new bond insurer could obtain a rating agency’s highest rating shortly after opening for business. For example, CIFG—one of the failed insurers—formed in 2001 and received top ratings from all three agencies by 2002.12
Finally, criticism of Aaa bond insurer ratings pre-dates the financial crisis by several years. In her book, Confidence Game,13 Christine Richard documents the activist investor William Ackman’s efforts to convince rating agencies to downgrade bond insurer MBIA. Although Ackman clearly had a vested interest in the outcome—he was selling MBIA stock short—his research on the matter was quite thorough as can be seen from his 2002 report Is MBIA Triple-A.14
Given the relative performance of governments and bond insurers during the financial crisis, the economic benefit of insurance is subject to question. In particular, it is worth noting that bond insurance is not common in the corporate bond market. If corporations could reduce their borrowing costs by purchasing insurance, it would be rational for them to do so. So the absence of corporate bond insurance suggests the absence of an economic benefit. Seen from this vantage point, it appears that municipal bond insurers are taking advantage of rating scale discrepancies— effectively arbitraging between the relatively lenient standards for corporate bond issuers and the relatively harsh standards for municipal bond issuers.
In the next three sections, I estimate the cost of the credit rating system beginning with extra interest costs borrowers incur due to harsh ratings. After considering—but not quantifying—the impact of low ratings on interest rate swaps used by many issuers, I total up the insurance premiums paid by municipal bond issuers. Finally, I estimate the direct cost of the rating system which take the form of fees paid by issuers to the rating agencies.
Extra Interest Expenses
THE EXTRA INTEREST COST estimated is based on the interest rate spread across rating categories.
Estimating rating spreads can be challenging because bond yields are affected by numerous factors other than ratings. Examples of these other factors include trade time and size, issuer state, and maturity date.
Because the municipal bond market is very illiquid—most bonds do not trade on any given day—it is necessary to either compare bond trades that occur hours or days apart, or rely on estimated pricing to determine yield spreads. Further, prices of individual trades may be distorted by the relative market power and sophistication of transaction participants. For example, an individual buying $10,000 of a given issue may receive a lower yield than an institution buying $1,000,000 of the same issue at the same time.
Municipal bond interest is taxed differently across states. For example, California has a maximum personal income tax rate of 13.3 percent and exempts California municipal bond interest income from state income taxation. By contrast, Texas and Florida have no income tax, removing some of the benefit to owning municipal bonds. A top bracket taxpayer in those two states receives substantially less after-tax income from municipal bond interest than her counterpart in California. Investors in those states may be expected to demand greater yields to offset this tax impact.
Finally, longer term bonds usually have higher yields than shorter term bonds. Thus comparing the yield of a bond rated AAA maturing in 2025 to a bond rated AA maturing in 2020 can be misleading. The term effect may well overwhelm the rating effect.
Market data services such as Bloomberg and Municipal Market Data offset this last effect by constructing rating-specific yield curves, showing rates at different tenors (i.e., length of time to maturity). The points on the yield curve represent average yields of bonds with the same rating and same tenor. It should be noted that tenor is typically stated in a round number of years which means that the 5-year point on the yield curve may include bonds with as little as 4.5 years to maturity or as many as 5.5 years.
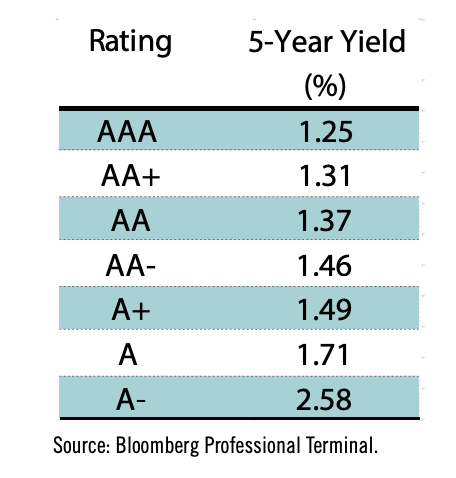
As of March 31, 2015, Bloomberg reported the following index yields for five year bonds at various ratings:
By subtracting the AAA yield from the others, I can estimate the risk premium (or spread) associated with lower ratings.
These spreads vary across tenors, and, in some cases, AA+ and AA bonds actually have lower yields than their AAA counterparts.15 It is reasonable to assume that these anomalies are the result of some of the effects described above. The five-year spreads appear to be more consistent than those for other tenors.
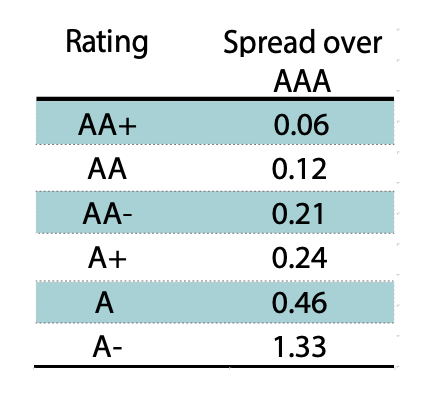
As ratings decline from AAA to A+ yields increase by an average of 6bp per notch. There are steeper yield increases once ratings fall below A+. For the purposes of this analysis, I will make the conservative assumption that each rating notch is associated with a 6bp change in interest expense.
Further, let’s assume that municipal bond ratings are two notches too conservative relative to other asset classes. (Later in the study I present an alternative rating methodology that can produce a generalized two-step improvement while still assigning at-risk cities speculative grade ratings.) For example, a municipal bond rated A- should really be rated A+ and one rated AA- should be upgraded to AA+. Such an adjustment cannot be made to municipal bonds carrying the highest AAA rating, and it is only possible for AA+ bonds to receive a one notch upgrade.
All this means that the interest penalty on bonds rated AA and lower is estimated to be 12bp: the ratings on these bonds could be increased by two notches at an interest cost savings of 6bp per notch. No interest savings are available for AAA bonds, which already have the highest rating and lowest funding cost. Since AA+ bonds can only be raised by one notch, the interest rate penalty on these bonds is estimated to be 6bp.
Now that I have the penalty rate, I need to determine the base against which to apply this rate. The appropriate base is some fraction of the overall amount of municipal bonds outstanding. For each dollar of affected municipal bonds outstanding and rated AA or below, borrowers are paying 0.12 cents in extra interest.
According to Federal Reserve estimates, the overall size of the US municipal bond market was $3.65 trillion at the end of 2014.16 Of this total, $2.91 trillion was issued by state and local governments, $0.52 trillion was classified as industrial revenue bonds and $0.22 trillion were issued by not-for-profit organizations including universities and hospitals.
Not all municipal bonds are rated, and estimates of the number of all rated bonds are difficult to find. Further, the breakdown of the rated universe by rating grade is also not readily available.
One way to roughly estimate the total number of rated bonds is to examine rating history files that each rating agency is required to file under SEC rules. These files are published in a format known as eXtensible Business Reporting Language (XBRL). There is one file for each rated issuer. S&P’s filings contain the size of each bond issue that it rated, thereby allowing users to roughly calculate the size of each rating cohort. Table 3 shows these sizes along with the estimated interest rate penalties associated with each rating. A relatively small volume of bonds rated below BB- are excluded; these are likely to be severely distressed or defaulted assets less prone to trade—based upon their ratings.
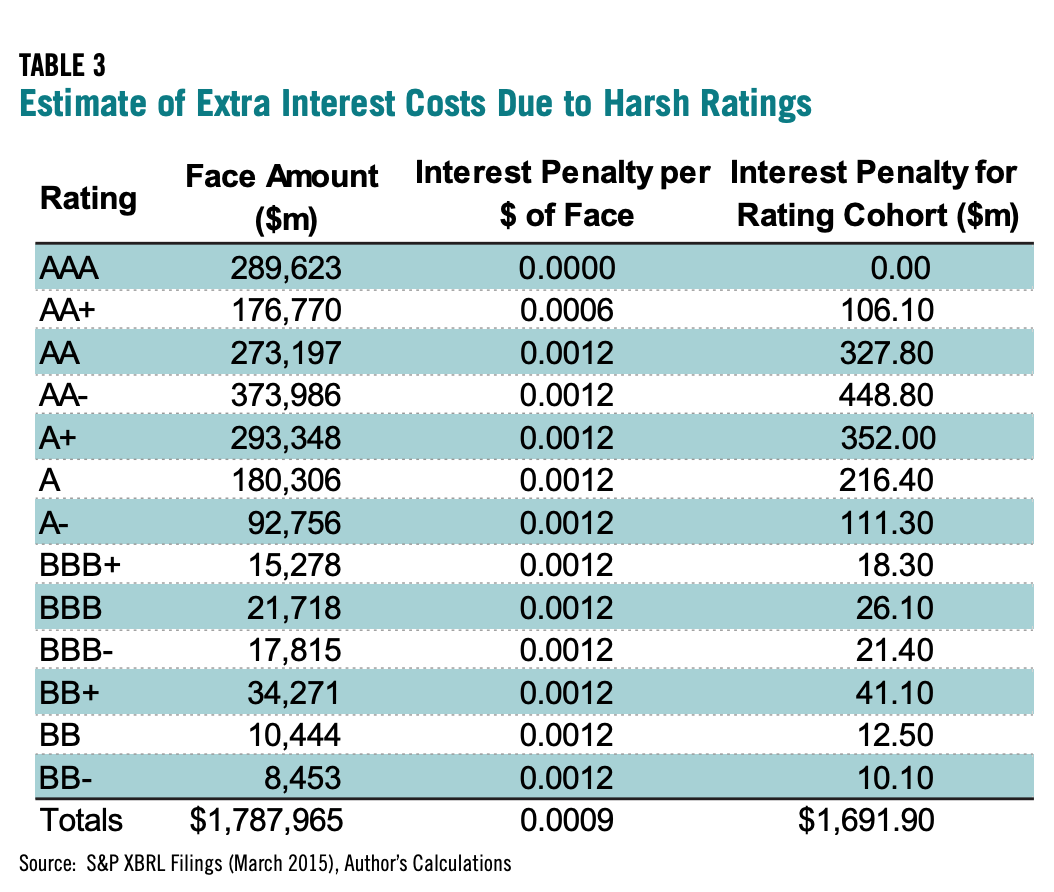
The total penalty is estimated at nearly $1.7 billion. It is worth emphasizing, however, that the rated amounts listed here are quite rough and should be refined in future work. These estimates are somewhat inflated because they reflect initial issue sizes and thus do not reflect any principal repayments. On the other hand, the estimates only include S&P data. Moody’s and Fitch rate a large number of bonds not covered by S&P. To the extent that the values above do not include bonds rated exclusively by Moody’s and Fitch, they understate the actual totals.
Municipal Bond Insurance Costs
DURING THE FINANCIAL CRISIS, most municipal bond insurers became insolvent or received multiplenotch downgrades. As a result, they ceased writing new policies. To the extent that bond insurers were rated lower than most municipalities, they could no longer offer government bond issuers the opportunity to achieve lower financing costs through a rating enhancement.
By late 2009, only one insurer was still active in the US municipal market: Assured Guaranty which had acquired Financial Security Assurance (FSA) earlier that year.17 Assured and FSA had higher ratings than other insurers and hoped that a merger would strengthen the combined entity’s case for retaining these relatively high ratings.
In October 2010, S&P downgraded the combined entity—Assured Guaranty Municipal (AGM) —from AAA to AA+. In November 2011, S&P imposed a further two notch downgrade to AA-, placing its assessment on a par with Moody’s, which rated AGM Aa3 at the time.18
The two agencies then diverged. In January 2013, Moody’s downgraded AGM by two notches to A2.19 In March 2014, S&P upgraded AGM one notch to AA,20 widening the gap between the two rating agencies to three notches. The S&P upgrade, together with a rating of AA+ from Kroll Bond Rating Agency is allowing AGM to expand its business.
According to AGM’s financial statements21 , the company insured $12.3 billion of US public finance securities in 2014, producing $127 million of premium income. AGM’s premiums thus represent just over 1 percent of the face value of the bonds it insured. (It is worth noting that this percentage reflects a one-time payment and is not comparable to the interest rate spreads discussed in the previous section.)
National Public Finance Guarantee Corporation (NPFG), a subsidiary of MBIA, began to issue new policies in late 2014, a few months after Standard & Poor’s upgraded the insurer from A to AA-.22 Moody’s also upgraded NPFG from Baa1 to A3, but that still left the firm’s rating below those of most US municipal bond issuers.23 By the end of the year NPFG had insured $400 million in new bonds24 with total premiums of $6.5 million.25
In 2012, a new insurer with a different organizational model entered the industry. The New York State Insurance Department licensed Build America Mutual Insurance Company (BAM) on July 23, 2012.26 On the same day, the firm received a Standard & Poor’s rating of AA.27 The new company, with no operating record, thus received a higher rating than thousands of municipal bond issuers, many of whom had been servicing debt obligations for several decades without missing any payments.
As its name implies, BAM is a mutual insurance company—which means that it is owned by its policyholders. A mutual insurance company does not have traditional stockholders, and its profits technically belong to the municipal bond issuers that buy policies. In fact, these municipalities are eligible to receive periodic dividends from the company.
This is an attractive model in theory because there is no redistribution of wealth from municipalities to third-party shareholders. But in practice, this distinction from traditional municipal bond insurance proves to be without a meaningful difference.
In 2014, BAM underwrote $7.8 billion of insurance and charged municipalities $31.7 million of premiums and “member surplus collections.”28 But it incurred $37.4 million in operating expenses, including $24.5 million in salaries.29 Consequently, BAM experienced an operating loss and was thus not in a position to make dividend payments.
Further, BAM does not retain a large portion of its premium revenue, but instead cedes it to a reinsurance company that would contribute to the settlement of any claims. BAM’s reinsurer is a subsidiary of White Mountains Insurance Group, a for-profit Bermuda-domiciled financial services holding company.30 In 2014, BAM ceded $11.8 million in premiums to this reinsurer.
Thus it is reasonable to treat BAM’s entire $31.7 million of revenue—representing roughly 0.4 percent of the face value of bonds it insured—as a cost to municipal issuers. Although BAM is a mutual company, it is likely that the firm’s reinsurer and management will continue to absorb all revenues—leaving nothing for its nominal owners (i.e. the insured governments).
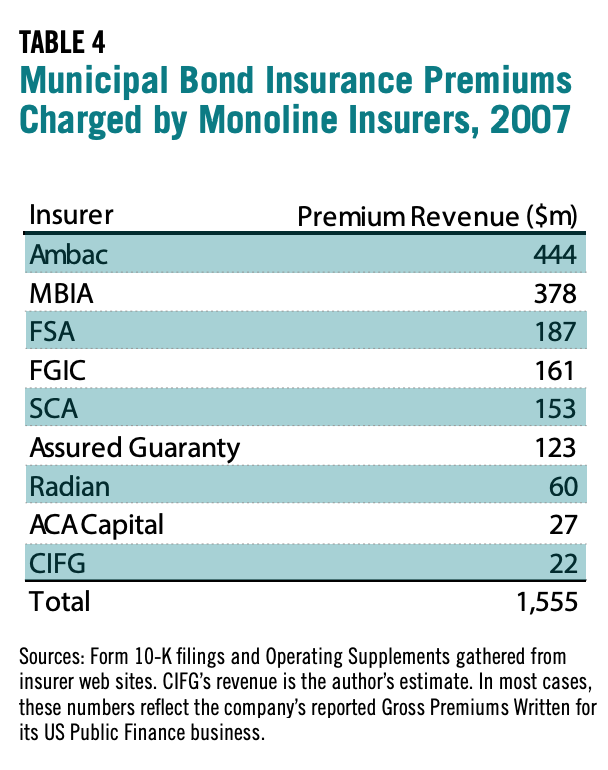
The three active insurers that wrote municipal bond insurance policies in 2014—AGM, NFPG and BAM —assessed a total of $167 million in premiums during that year. Although this amount reflects an increase from previous years, it is dwarfed by municipal bond insurance costs prior to the financial crisis, when more companies were active in the market and most had AAA ratings. Table 4 shows premiums charged by municipal bond insurers in 2007. The total exceeded $1.5 billion.
With insurers now receiving rating upgrades, it is likely that the use of municipal bond insurance will grow in the coming years. That said, it is hard to see how the business can return to the levels that prevailed prior to the recession unless insurers can once again obtain AAA ratings.
A relatively new entrant into the ratings space, Kroll Bond Rating Agency (KBRA), has assigned AA+ ratings to both AGM31 and NPFG32 – higher than S&P’s ratings and several notches above those assigned by Moody’s. It is possible that KBRA’s actions could result in competition among rating agencies to justify higher ratings for these firms. This phenomenon, known as ratings shopping, contributed to the inflated ratings of mortgage backed securities that triggered the financial crisis.
Monoline insurers have also restructured themselves in an effort to justify higher ratings. For example, MBIA formed NPFG to be a dedicated public finance insurer, with no exposure to structured finance securities.33 MBIA can thus make the case that NPFG is insulated from the CDOs and other unorthodox instruments that caused the company so much difficulty in 2007 and 2008.
Given these trends, annual municipal bond insurance revenues should rise well beyond their 2014 level in the years ahead—in absence of industry reform.
Rating Fees
THE TOTAL AMOUNT US MUNICIPAL BOND issuers pay for credit ratings is not reported, but can be roughly estimated. The two largest rating agencies—Moody’s Investors Service and Standard & Poor’s Rating Services—are owned by US-based public companies: Moody’s Corporation and McGraw Hill Financial, respectively. These corporations must file quarterly and annual reports under SEC rules, but they have broad discretion in how they report revenue by business segment. Since these companies engage in many activities other than rating US municipal bonds, their top line revenue figures are not useful for the purpose of determining how much these firms charge state and local governments and not-for-profit bond issuers.
McGraw Hill’s 2014 Form 10-K34 filing shows that the company earned a total of $5.05 billion in revenue of which $2.46 billion was attributable to S&P Ratings Services. The company does not appear to further segment this rating revenue between structured, corporate, and government categories.
Moody’s provides much more granular disclosure. Its 2014 Form 10-K35 shows $3.33 billion in revenue of which $2.25 billon was associated with credit rating activities. Moody’s further breaks down its rating revenue into four sectors: corporate finance, structured finance, financial institutions, and PPIF (public, project and infrastructure finance). This last segment, which accounted for $357.3 million in 2014 revenue, includes both US and foreign public-sector borrowers. Moody’s further breaks out PPIF revenue between US and non-US sources. In 2014, the company reported $226.2 million in US PPIF revenue, up from $215.4 million the previous year.
Assuming that S&P’s revenues are similar and that Fitch36 earns between a third and a half of its larger rivals, I estimate that US municipal bond issuers paid somewhat more than $500 million for credit rating services in 2014.
A large fraction of this $500 million takes the form of profit. According to Moody’s Form 10- K, the overall company had an operating margin of 43.2 percent. More relevant to this inquiry, Moody’s ratings business reported a 52.2 percent operating margin. Expenses and margins are not broken down by rating sector, and it is likely that the margin in the US Public Finance unit is lower than elsewhere within Moody’s Investors Service because fees for government credit ratings tend to be lower than those for privately issued bonds.37
S&P’s 2014 profit performance was much worse than Moody’s, but this is primarily the result of legal and regulatory settlements booked by the company in 2014. In all, McGraw Hill recorded $1.6 billion in charges associated with S&P’s settlements with the Department of Justice, states’ attorneys general, CalPERS and the US Securities & Exchange Commission. None of these settlements related to US municipal bond ratings. Margin information is not available for Fitch.
Assuming that the three agencies enjoyed an average profit margin of 40 percent, I can conclude that $200 million in municipal bond ratings revenue fell to the corporate bottom line—reflecting a substantial transfer of wealth from municipal stakeholders to private interests.
The micro impact of this transfer was captured in a 2011 Bloomberg story38 focusing on West Haven, Connecticut. The city paid S&P and Moody’s combined fees of $31,700 to rate a $45 million bond issue. Author Zeke Faux estimates that fee would have covered nine months’ salary for one teacher in a city that had recently laid off fourteen teachers.
Ratings fees charged to individual governments are generally not publicly reported.39 According to a November 2014 ratings fee disclosure published by S&P40 , that agency generally charges between $7500 and $495,000 per municipal bond offering based on sector, par amount, structure, and complexity of the transaction. With the increased availability of open government checkbooks and the opportunity to perform public records requests, researchers will likely gain more insight into ratings fees paid by individual governments.
Low Ratings and Accelerated Termination Events
AN ADDITIONAL COST OF THE CREDIT RATING SYSTEM borne by certain local governments is the expense of making termination payments on interest rate swaps when an accelerated termination event is triggered. Rather than attempt to estimate this cost, I will instead describe it with an example.
In November 2007, the City of Chicago issued $200 million in Variable Rate Demand Obligations. At the time, the city carried a Moody’s credit rating of Aa3—after having been upgraded one notch from A1 in 2006.41 Simultaneous with the bond issuance, the city entered into interest rate swap agreements with Loop Financial and Morgan Stanley.42 These two contracts were intended to replace Chicago’s variable rate obligations with predictable interest payments at a rate of 4 percent annually.
The November 2007 arrangement was the last of a number of such deals Chicago and Chicago Public Schools initiated. It is also the most questionable such deal since it was undertaken when the financial crisis was well underway.
The use of swaps and variable rate instruments to achieve lower fixed financing costs poses a variety of risks, but I will limit my focus to those associated with credit ratings. The swap agreements contain terms that protect the counterparty (i.e., the financial institution transacting with the city) in case the city becomes unable to meet its obligations. The November 2007 agreements with Loop Financial (whose interest was later transferred to Deutsche Bank) and Morgan Stanley required the city to make accelerated termination payments in the event that its Moody’s ratings fell below Baa3.
Since Chicago’s credit rating had been stable at Aa3 (in fact it had even been upgraded one notch in 2006), a downgrade into the speculative grade region below Baa3 must have seemed a very remote risk to city financial officials who approved the transaction.
Moody’s maintained Chicago’s credit rating at Aa3 until July 201343 , when it began a series of precipitous downgrades—leaving the city with a speculative Ba1 rating in May 2015. As late as April 2012, Moody’s used the following language when affirming its then-current Aa3 rating:
The affirmation of the Aa3 rating on Chicago’s general obligation debt is supported by the city’s long-standing role as the center of one of the nation’s largest and most diverse economies; a tax base that remains very sizeable despite several consecutive years of estimated full valuation declines; significant revenue raising ability afforded by the city’s status as an Illinois home rule community; and its closely managed use of variable rate debt and interest rate derivatives. These strengths are somewhat moderated by the city’s persistent economic challenges, including elevated unemployment levels and a large foreclosure backlog; narrow, though improving, General Fund reserves; relatively low levels of expenditure flexibility, as a high percentage of the city’s operating budget is dedicated to personnel costs for a heavily unionized workforce; and above average levels of slowly amortizing debt.
In the three years since April 2012, Chicago’s fundamentals appear to have remained the same or improved somewhat. The city is still the center of a large and diverse economy and it continues to benefit from a strong revenue base. Although official property valuations (EAVs) are lower, both Zillow44 and the Case-Shiller Index45 show substantial property price gains since bottoming in early 2012. The city’s unemployment rate has also fallen46 substantially. Gradual economic improvement has brought rising revenues. According to the city’s CAFR, general fund revenue grew from $2.8 billion in 2011, to $2.9 billion in 2012 and $3.0 billion in 2013. Unaudited figures in the city’s latest budget47 show further growth to $3.1 billion in 2014 and a projected $3.5 billion in 2015. Although expenditure flexibility continues to be limited, Chicago has cut its retiree health insurance costs by reducing premium support and shifting beneficiaries onto the health exchanges created by the Affordable Care Act.48 These cost saving measures are still being litigated, but had not been overturned as of this writing. Chicago’s pension funds are seriously underfunded, but that is not new. At the end of 2011, Chicago’s four pension funds had a composite funded ratio of 37.9 percent—based on market value of assets. At the end of 2013 (the latest date for which complete statistics were available at this writing), the funded ratio was little changed at 37.0 percent.49
Since Chicago’s credit landscape has not greatly changed since 2012, Moody’s downgrades appear to have some other cause. As reported by The Chicago Tribune50 , the downgrades were primarily the result of a new pension liability methodology Moody’s adopted in early 2013. The methodology change involved applying a lower discount rate to municipal pension obligations. Using a lower discount rate makes the present value of pension payments larger. The change had a pronounced impact on Chicago which has large pension obligations (as a percentage of revenues) relative to other cities.
Thus, the ratings downgrades were primarily attributable to Moody’s adoption of a more conservative pension methodology as opposed to any real change in Chicago’s credit position. This methodology “risk” was unforeseen in late 2007 when Chicago entered into the swap agreement now subject to accelerated termination.
The cost of an accelerated termination event can be quite large. In May 2015, Reuters reported that Moody’s most recent downgrade could have cost the city $2.2 billion—substantially more cash than the city has on hand.51 Fortunately, in Chicago’s case, a number of its swap counterparties chose to give the city an opportunity to refinance its variable rate obligations before demanding payment. The city may thus be able to avoid most of the potential cost, but has made $129 million in accelerated termination payments thus far. Further, a refinancing under the adverse circumstances Chicago faced in mid-2015 will likely result in the city incurring additional interest costs.
Finally, it is also worth noting that the Series 2007-E, F and G bonds were insured by MBIA, which carried a rating of Aaa at the time. To access the variable rate market—which contains a large number of money market mutual funds—debt issues have generally been obliged to carry AAA/ Aaa ratings. Thus, the structure that Chicago chose necessitated the involvement of an insurer like MBIA. However, at the time the deal closed, abundant evidence suggested that the insurer no longer merited a top rating. For example, the company’s third quarter 2007 earnings report issued on October 25, 2007 showed a significant quarterly loss.52 MBIA’s stock lost 40 percent of its value between the beginning of September and the beginning of November 2007.53 Had MBIA been more accurately rated, Chicago may not have used the variable rate / swap structure in the first place, thereby avoiding accelerated termination payments years later.
While low ratings for municipal issuers have and may continue to trigger swap termination clauses, the frequency and size of these termination events are not readily predicted. Further, the willingness of counterparties to offer forbearance when they have a right to collect accelerated termination payments is likely to be situationally dependent.
Overall Costs
PRIOR TO DESCRIBING ACCELERATED termination payments, I estimated the extra interest costs, municipal bond insurance costs, and rating agency fees paid by municipal bond issuers. My estimates for the three categories were $1.69 billion, $167 million and $500 million respectively, yielding a combined cost of roughly $2.35 billion annually.
In the discussion of rating fees, I identified high-rating agency margins as a significant factor. That said, my estimates imply that rating agencies themselves incur $300 million in expenses to assign and monitor municipal bond ratings. Because rating agencies consider numerous qualitative factors when issuing and changing ratings, they require large teams of analysts to operate their businesses.
If a quantitative rating model could achieve similar levels of accuracy to contemporary methodologies, substantial cost savings would be possible. The next section discusses the possibility of implementing such a model.
An Alternative Model
I PROPOSE A MODEL under which municipal bond issuers are rated in an automated fashion based on economic and accounting metrics. Below I sketch out a model that can be applied to US general purpose local governments, such as cities and counties. The proposed model provides higher ratings overall, but still would have assigned relatively poor ratings to defaulting cities such as Detroit, Harrisburg, Scranton, San Bernardino and Stockton. This model is not intended to be a final product, but rather a concrete example of what is possible. I encourage other researchers to offer refinements or alternatives to the approach outlined here.
The model relies on five indicators, including three accounting ratios and two economic indicators. The intuition behind the model is that bankruptcy and default are triggered by some combination of insufficient general fund balance, excessive indebtedness (and other long term obligations), and negative revenue trends. In previous research, I have found general fund balance to be the strongest predictor; consequently, it receives the highest weight in the model. The model considers both long term obligations on the balance sheet plus a measure of pension burdens to incorporate indebtedness (these measures can be consolidated once GASB 68 is implemented, since this new standard will require governments to report future pension costs as a liability). Revenue trend is captured by two economic indicators: change in housing prices and change in unemployment rate. The housing price component offers a leading indicator of property tax collections.
To support comparability across jurisdictions of varying sizes, the model uses accounting ratios rather than single values. In the case of general fund balance, the amount is divided by general fund expenditures. The quotient can be intuited as the amount of time the general fund balance would last (as a percentage of one year) if no new revenues were collected.
Indicator levels are translated into “rating points.” The maximum number of rating points a local government can receive is 100; the minimum possible score is 0. Point ranges are associated with letter ratings, so the assignment of a letter grade is a simple table lookup. An agency using this system can publish each entity’s point score in addition to its rating to provide users with greater granularity.
The conversion of an indicator value to a score requires some explanation. This description uses the general fund balance indicator as an example. Under the model points only accumulate within a relevant range. In the case of the general fund balance to expenditure ratio, that range is 2 percent to 32 percent. Any ratio level below 2 percent is associated with 0 points and any ratio
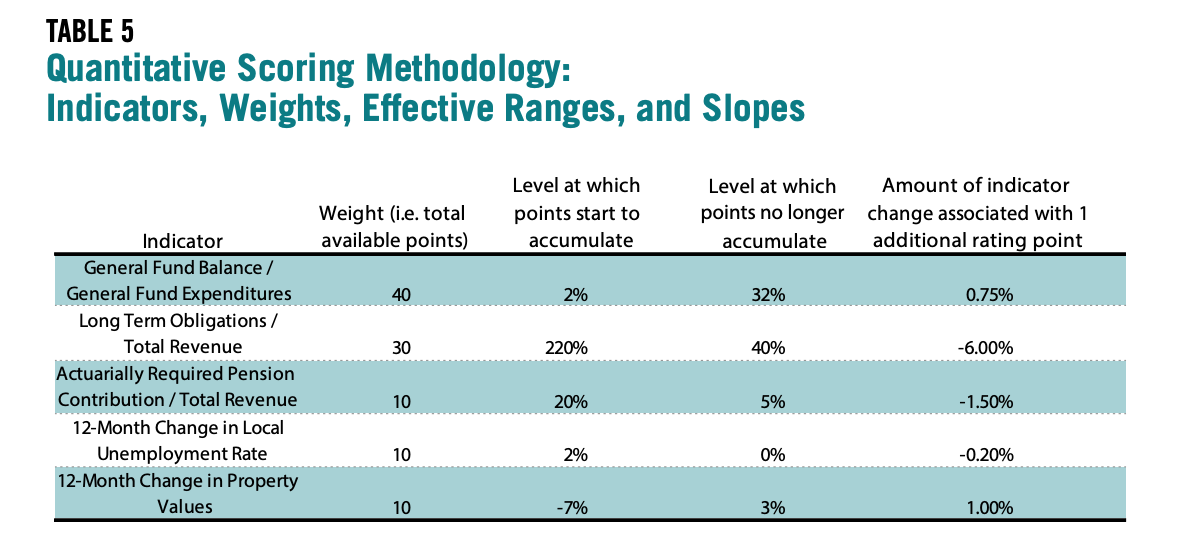
level above 32 percent is associated with 40 points—representing the 40 percent weight assigned to this indicator. As the ratio rises from 2 percent to 32 percent, points are assigned on a straight line basis. Each increase of 0.75 percent in the ratio is associated with an extra point. Thus a ratio of 2.75 percent translates to 1 point, 3.50 percent translates to 2 points, 4.25 percent translates to 3 points, etc.
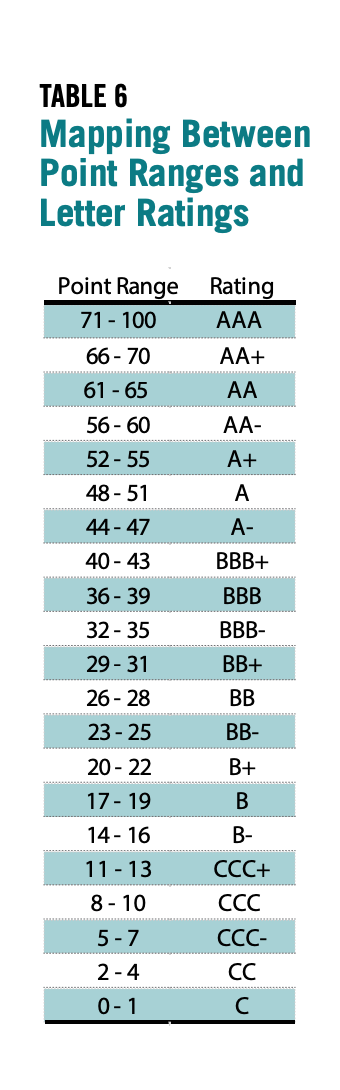
These caps and floors roughly capture the declining marginal importance of an indicator once it moves outside a relevant range. A city with a 101 percent general fund balance ratio is not meaningfully safer than a city with a 100 percent ratio. Both cities have plenty of liquid, discretionary assets available to meet their obligations.
Table 5 shows the indicators included in the rating model. Table 6 shows the total point ranges associated with particular letter ratings.
Empirical Findings
THIS RATING METHODOLOGY was applied to data for 300 cities and counties in California, Michigan, and Pennsylvania for the years 2007–2012. Most model inputs were obtained from Comprehensive Annual Financial Reports and Basic Financial Statements produced by these local governments. Unemployment data were obtained from the Bureau of Labor Statistics.54 Property value data were obtained from Zillow Research.55 Data for the 1,800 observations—300 municipalities over six years—were entered into the rating model outlined above. The model produced the rating distribution shown in Table 7.
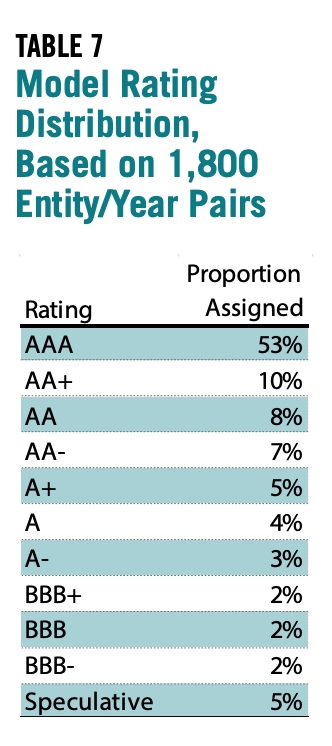
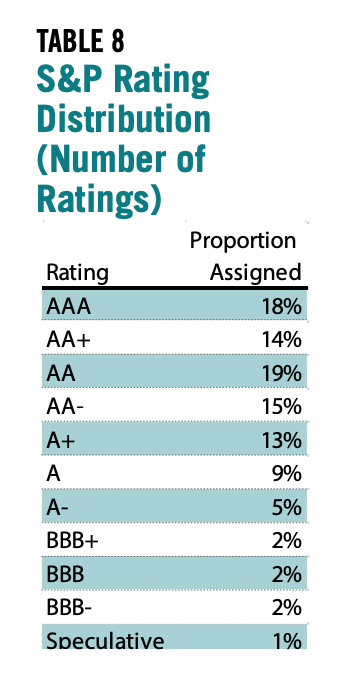
This compares to a recent S&P municipal rating distribution extracted from the agency’s XBRL filings shown in Table 8. Proportions refer to the number of ratings rather than the total par rated, and thus do not necessarily correspond to the rated par shown earlier in the interest cost calculation.The ratings distribution produced by the model is heavily skewed toward AAA, while the actual S&P rating distribution is more even. The top three categories in the S&P distribution cumulatively account for 51 percent of the ratings while the single highest category accounts for roughly the same proportion of the model distribution. The two distributions would be much more closely aligned if S&P ratings were uniformly shifted up by two notches—motivating the two notch assumption made earlier during the extra interest cost calculation.
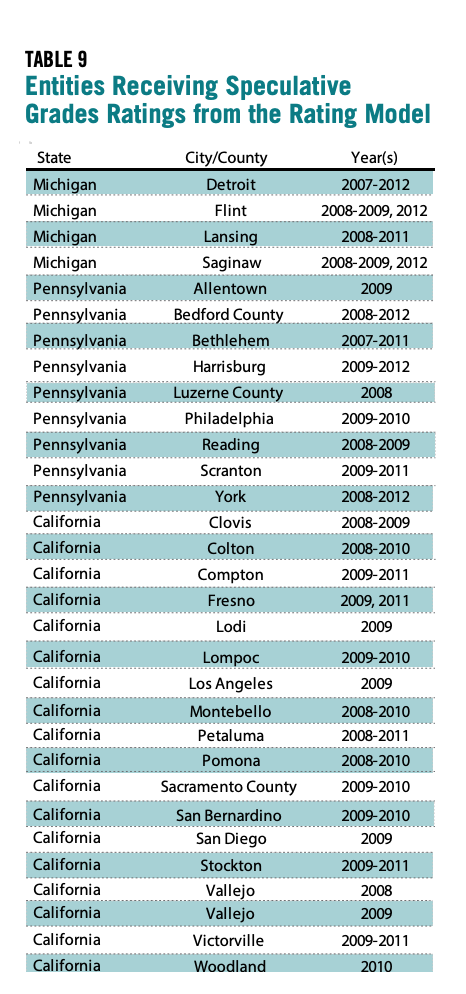
The model-generated speculative grade ratings (below BBB-) for several cities during one or more of the years in the analysis period. Table 9 provides a list of entity/year combinations in which a speculative grade rating was computed by the model: cities in the sample that defaulted since 2007 are Vallejo, San Bernardino, Stockton, Harrisburg, Scranton, and Detroit. All six appear on the speculative grade list. The model thus appears to effectively segregate defaulting municipalities from most of those that perform.
Detroit is rated below investment grade in all six of the years for which modeled ratings were calculated, suggesting that an index of accounting and economic values can provide substantial advance warning of a major default or bankruptcy—effectively performing the function now assigned to ratings analysts, but at lower cost.
I also considered one defaulting entity in another state: Jefferson County, Alabama. In this case, the model’s implementation encounters a complexity. The county declared bankruptcy in 2011, but was experiencing financial distress years earlier due to problems with its sewer system and the costs of its interest rate swaps.
The scoring system gives Jefferson County an A- rating in 2007 and a BBB rating in 2008. Its model-implied ratings then rise to A in 2009 and AAA in 2010. This counterintuitive result is largely explained by the Long Term Obligations / Total Revenue ratio which falls from 815 percent in 2008 to 15 percent in 2009 and 6 percent in 2010. As a result, the county received 0 points from this ratio in 2008, but 30 points each year thereafter.
The movement in this ratio was the result of a decision on the part of the County’s auditor to reclassify its bonded indebtedness as current liabilities. As stated in Jefferson County’s 2009 audited financial statements56 :
… the Commission has received Notices and Events of Default from the Trustee and certain banks for certain debt obligations and has been unable to meet its accelerated debt service obligations as they become due. While the terms of the outstanding warrants payable may ultimately be restructured with the creditors, under the current Events of Default and potential cross-defaults, the Trustees may declare the warrants due and payable on demand. Therefore, the outstanding warrants payable and related accounts have been classified as current liabilities in the accompanying financial statements. These conditions raise substantial doubt about the Commission’s ability to continue as a going concern without the restructuring of debt or other significant reorganization activities. (p. 5)
This suggests that, in implementing the model, it is necessary to review notes and auditor opinions when accounting values show large changes from year to year. In certain cases, model inputs may need to be adjusted to take into account considerations stated in these sections. In Jefferson County’s case, most of the entity’s current liabilities would have to be added back to long term obligations to effectively parameterize the model.
In addition, a model-based approach could include a scan for “going concern” language in each municipality’s audit and automatically assign non-investment grade ratings in such cases. Although government financial auditors do not consistently use “going concern” language for severely distressed municipalities, the Government Accounting Standards Board is considering the possibility of promulgating a standard in this area57
Conclusion
THE METHODOLOGY OUTLINED ABOVE is intended to show what is possible and invite further discussion. I recognize that other researchers and practitioners, working with different data sets and analytical approaches, will select different indicators and choose different weights, ranges, or mappings. More ambitious changes to the modeling methodology are possible. For example, all the indicators need not be economic or accounting values. Automated textual analysis of a government’s web site, legislative proceedings, and news coverage may yield qualitative indicators that could be coded and then included in a rating index.
More important than the methodology chosen is my general assertion that model-based ratings—calibrated to assign a greater proportion of AAA municipal bond ratings yet sensitive enough to detect at-risk entities—can provide a viable alternative to the contemporary municipal bond rating system. A publicly available model that is easy to implement would be virtually cost-free. If ratings consumers accepted such a system, it could produce savings for government bond issuers— and thus taxpayers—of roughly $2 billion per year.
- 1Jess Cornaggia, Kimberley J. Cornaggia and John E. Hund. Credit ratings across asset classes. Working Paper on Social Science Research Network, June 14, 2014. http://papers.ssrn.com/sol3/ papers.cfm?abstract_id=1909091
- 2Consumer Federation of America comment letter regarding Request for Re-Proposal Relating to Nationally Recognized Statistical Rating Organizations. Micah Hauptman and Barbara Roper. March 3, 2014. https://www.sec.gov/comments/s7-18-11/s71811-78.pdf
- 3The Arkansas and Louisiana defaults are discussed in Jerome S. Fons, Thomas Randazzo and Marc D, Joffe, An Analysis of Historical Municipal Bond Defaults, Kroll Bond Rating Agency, November 14, 2011 (available with registration at https://www.krollbondratings.com/show_report/44)..
- 4California State Treasurer, Public Finance Division, History of California’s General Obligation Bond Ratings. http://www.treasurer.ca.gov/ratings/history.asp.
- 5S&P and Fitch use a ratings scale that ranges from AAA to D; Moody’s ratings range from Aaa to C. The highest ratings on the S&P/Fitch scale are: AAA, AA+, AA, AA-, A+, A, A-, BBB+, BBB and BBB-. The highest ratings on the Moody’s scale are Aaa, Aa1, Aa2, Aa3, A1, A2, A3, Baa1, Baa2 and Baa3.
- 6Most of the narrative below focuses on Moody’s ratings, since it is the oldest rating agency and has very comprehensive coverage. During the early 21st Century, rating agency behavior toward municipal and bond insurance issuers was similar.
- 7Municipal Bond Turmoil: Impact on Cities, Towns, and States. Hearing before the Committee on Financial Services, U.S. House of Representatives, 110th Congress, Second Session, March 12, 2008, Serial Number 110–99. Laura Levenstein’s testimony is available as a separate PDF file at http://archives.financialservices.house.gov/hearing110/levenstein031208….
- 8Such a scale is used for corporate borrowers by Rapid Ratings International, a non-NRSRO rating firm. http://www.rapidratings.com/company/
- 9Declaration of Joseph Pimbley In Support Of Plaintiffs’ Anti-Slapp (C.C.P. §425.16) Prong Two Showing, Ambac Bond Insurance Cases, Superior Court of California Case Number CJC-08-004555.
- 10Moldogaziev, Tima (March 2013). “The Collapse of the Municipal Bond Insurance Market: How Did We Get Here and Is There Life for the Monoline Industry beyond the Great Recession?” Journal of Public Budgeting, Accounting, and Financial Management. Volume 25 Number 1. Pages 199-233.
- 11Another insurer, ACA was downgraded from A to CCC by Standard & Poor’s on December 14, 2007. It was not rated by Moody’s.
- 12The 2002 rating analyses are available on the Internet Archive at https://web.archive.org/web/20021012090251/http://www.cifg.com/fin_info…. CIFC was wholly owned by a French bank that had a long operating history, but this bank was not legally responsible for CIFG’s obligations.
- 13Christine S. Richard, Confidence Game, New York: John Wiley and Sons, 2010.
- 14Gotham Partners Management, Is MBIA Triple-A? A Detailed Analysis of SPVs, CDOs, and Accounting and Reserving Policies at MBIA Inc., December 9, 2002. http://www.briem.com/files/Ackman_MBIA_12092002.pdf.
- 15One possible issue is that Bloomberg’s AAA yield curve is contributed by a third party, Municipal Market Analytics, whereas the other curves are calculated by Bloomberg staff. Another source, FMS Bonds, show much larger spreads between AAA, AA and A rated municipal bonds (http://www.fmsbonds.com/Market_Yields/index.asp).
- 16Federal Reserve (March 12, 2015). Z1 Release. http://www.federalreserve.gov/releases/z1/current/z1.pdf
- 17Dan Seymour (October 15, 2009). Assured/FSA: Last One Standing. The Bond Buyer. http://www.bondbuyer.com/issues/118_199/assuredfsa-1002586-1.html.
- 18Robert Slavin (December 1, 2011). S&P Drops Assured Guaranty Two Notches to AA-Minus. The Bond Buyer. http://www.bondbuyer.com/news/assured-guaranty-downgrade-standardpoors-…
- 19Moody’s Investors Service (January 17, 2013). Moody’s downgrades Assured Guaranty; lead insurer to A2. https://www.moodys.com/research/Moodysdowngrades-Assured-Guaranty-leadi…
- 20Assured Guaranty (March 18, 2014). Press Release: S&P Upgrades Assured Guaranty’s Operating Subsidiaries to AA Stable. http://assuredguaranty.newshq.businesswire.com/press-release/other/sp-u….
- 21Assured Guaranty Mutual Corporation. Financial Supplement: December 31, 2014. http://assuredguaranty.com/uploads/PDFs/AGM_4Q14_Supplement.pdf.
- 22MBIA, Inc. (March 18, 2014). Press Release: S&P Upgrades National Public Finance Guarantee Corp. and MBIA Inc. http://www.marketwatch.com/story/spupgrades-national-public-finance-gua….
- 23National Public Financial Guarantee (May 22, 2014). Moody’s Upgrades National Public Finance Guarantee Corp. http://www.nationalpfg.com/pdf/RatingAgencyReports/Moodys_Upgrades_Nati….
- 24Amount obtained from a review of National Public Financial Guarantee insured portfolio at http://www.nationalpfg.com/insuredportfolio.
- 25National Public Financial Guarantee, Statutory-Basis Financial Statements. December 31, 2014. http://www.nationalpfg.com/pdf/Financials/2014_National_Audited_Stateme….
- 26New York State Department of Financial Services (July 23, 2012). Press Release: Governor Cuomo Announces Licensing of New Bond Insurer to Serve Small and Mid-Sized Municipal Projects. http://www.dfs.ny.gov/about/press/pr1207231.htm.
- 27Standard & Poor’s Rating Services (July 23, 2012). Build America Mutual Assurance Co. Rated ‘AA’; Outlook Stable https://www.standardandpoors.com/en_US/web/guest/article/-/view/type/ HTML/id/991346.
- 28Build America Mutual. Quarterly Operating Supplement (December 31, 2014). http://buildamerica.com/wp-content/plugins/statementUploader/uploads/BA…. According to BAM’s web site, “member surplus contributions” are a portion of the policy cost that “which fund the growth of BAM’s claims-paying resources”.
- 29Annual Statement of the Build America Insurance Company of New York, for the Year Ended December 31, 2014. http://buildamerica.com/wp-content/plugins/statementUploader/uploads/BA…
- 30White Mountains (July 23, 2012). Press Release: White Mountains Funds a New Municipal Bond Insurance Platform, Build America Mutual and HG Re. http://investor.whitemountains.com/news-releases/news-release-details/w…
- 31Kroll Bond Rating Agency (November 13, 2014). Press Release: Kroll Bond Rating Agency Assigns AA+, Stable Outlook, to Assured Guaranty Municipal Corp. (AGM). https://www.krollbondratings.com/announcements/952.
- 32Kroll Bond Rating Agency (May 12, 2014). Press Release: Kroll Bond Rating Agency Assigns AA+, Stable Outlook, to National Public Finance Guarantee Corporation. https://www.krollbondratings.com/announcements/609.
- 33Elinor Comlay (February 18, 2009). MBIA shifts bond insurance business to new company. Reuters. http://www.reuters.com/article/2009/02/18/usmbia-sb-idUSTRE51H2TE200902….
- 34McGraw Hill Financial, Inc. Form 10-K for the Fiscal Year Ended December 31, 2014. http://edgar.sec.gov/Archives/edgar/data/64040/000006404015000004/mhfi-…
- 35Moody’s Corporation Form 10-K for the Fiscal Year Ended December 31, 2014. http://edgar.sec.gov/Archives/edgar/data/1059556/000119312515063352/d84…
- 36Fitch Ratings is jointly owned by a privately held US corporation, Hearst, and a French-based public company, Fimalac. Its results thus do not need to be included in a Form 10-K. According to Fimalac’s web site (http://www.fimalac. com/FitchratingsGB.html), Fitch had revenues of $982 million and earnings of $332 million in 2013.
- 37Cornaggia, Cornaggia & Hund (2014). Credit Ratings across Asset Classes. SSRN: http://papers.ssrn.com/sol3/papers.cfm?abstract_id=1909091
- 38Zeke Faux (November 15, 2011). Rating Fees Rising Faster Than Inflation as Governments Cut. BloombergBusiness. http://www.bloomberg.com/news/articles/2011-11-15/credit-rating-fees-ri…
- 39In 2016, the California State Treasurer began reporting rating fees as part of its new DebtWatch system. See http://debtwatch.treasurer.ca.gov/. Also, a group of public finance researchers obtained and analyzed rating agency fees for Texas municipalities. See Todd Ely, Christine R. Martell and Sharon Kioko (March 2013). Determinants of the Credit Fee in the Municipal Bond Market. Public Budgeting and Finance. Volume 33. Number 1. Pages 25-48.
- 40 Standard & Poor’s Ratings Services U.S. Ratings Fees Disclosure (November 13, 2014). http://www.standardandpoors.com/servlet/BlobServer?blobheadername3=MDT-…
- 41The city’s underlying ratings at the end of each year can be found in its Comprehensive Annual Financial Reports available at http://www.cityofchicago.org/city/en/depts/obm/supp_info/cafr.html.
- 42Chicago’s swap positions are listed at http://www.cityofchicago.org/content/dam/city/depts/fin/supp_info/Bonds….
- 43Moody’s Investor Service (July 17, 2013). Rating Action: Moody’s downgrades Chicago to A3 from Aa3, affecting $8.2 billion of GO and sales tax debt; outlook negative. https://www.moodys.com/research/Moodysdowngrades-Chicago-to-A3-from-Aa3….
- 44Zillow Research. http://www.zillow.com/chicago-il/home-values/.
- 45S&P Case Shiller Chicago Home Price Index. http://us.spindices.com/indices/real-estate/sp-case-shiller-il-chicagoh…
- 46Bureau of Labor Statistics Unemployment Rates available via Google Public Data: https://www.google.com/publicdata/exploreds=z1ebjpgk2654c1_&ctype=l&str…
- 47Chicago 2015 Budget Book. http://www.cityofchicago.org/content/dam/city/depts/obm/supp_info/2015B….
- 48Spielman, Fran (September 12, 2014). Emanuel socks city retirees with 40 percent health insurance hike. Chicago Sun-Times. http://chicago.suntimes.com/chicago-politics/7/71/158836/emanuel-socks-….
- 49Authors calculations from city pension plan actuarial reports.
- 50Gillers, Heather (May 26, 2015). New emphasis on pension debt at Moody’s helped Chicago fall to junk status. The Chicago Tribune. http://www.chicagotribune.com/news/local/politics/ct-chicago-ratings-mo….
- 51Pierog, Karen (May 21, 2015). Banks give Chicago breathing room to convert bonds. Reuters. http://mobile.reuters.com/article/newIssuesNews/idUSL1N0YC10Z20150521?i…
- 52MBIA Inc. (October 2007). Press Release: MBIA Inc. Reports 39 Percent Decrease in Nine Months Net Income Per Share; Operating Income Per Share Down 2 Percent for the Quarter. http://investor.mbia.com/file.aspx?IID=103405&FID=5064271.
- 53MBIA historic stock prices available at Yahoo Finance, http://finance.yahoo.com/q/hp?s=MBI&a=06&b=2&c=2007&d=10&e=2&f=2007&g=d.
- 54http://download.bls.gov/pub/time.series/la/.
- 55http://www.zillow.com/research/data/.
- 56Jefferson County Commission Audited Financial Statements, September 30, 2009. http://jeffconline.jccal.org/Sites/Jefferson_County/AppData/DocLib/Main…. The quote mentions “warrants” which are bond-like instruments often issued in southern states.
- 57Government Accounting Standards Board (April 24, 2015). GASB adds pre-agenda research on going concern, debt; removes project on financial projections. http://www.gasb.org/cs/ContentServer?c=GASBContent_C&pagename=GASB%2FGA….

