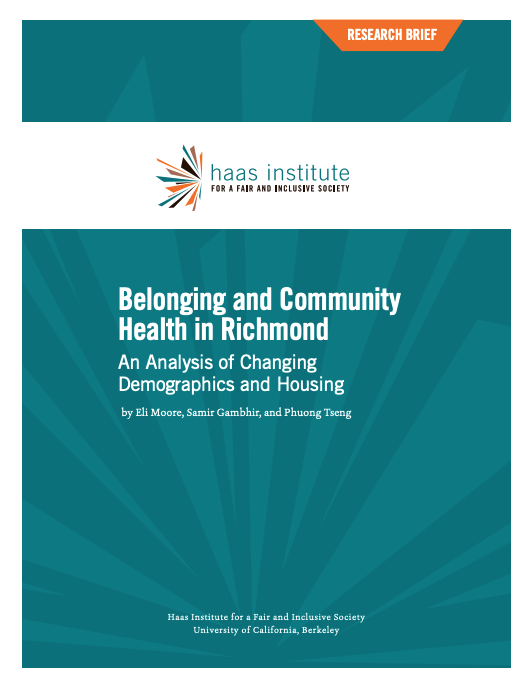
Belonging and Community Health in Richmond: An Analysis of Changing Demographics and Housing
Released February 20, 2015, this research report assesses the extent of gentrification in Richmond by analyzing changes in the demographics and housing market between the years 2000 and 2013. Gentrification trends in gentrification in Richmond are analyzed at the neighborhood level by adapting the methodology of previous analyses of Portland and the cities of San Francisco and Oakland. People and housing conditions are analyzed across three domains – Vulnerable population, Demographic Change, and Housing Market Conditions - to estimate the state of gentrification in a given city. The analysis is done at the level of the census Block Group, a set of boundaries created by the US Census that in Richmond have an average population of 1,428 residents. The report was written by Eli Moore, Samir Gambhir, and Phuong Tseng.
Download the press release here.
Download Belonging and Community Health in Richmond.
KEY FINDINGS
- The African American population in Richmond fell by 12,500 people between 2000 and 2013, while Latinos and Asian Americans increased, and the white population remained stable.
- Gentrification is in its early and middle stages in some areas across the center of the city and in North Richmond and near Hilltop.
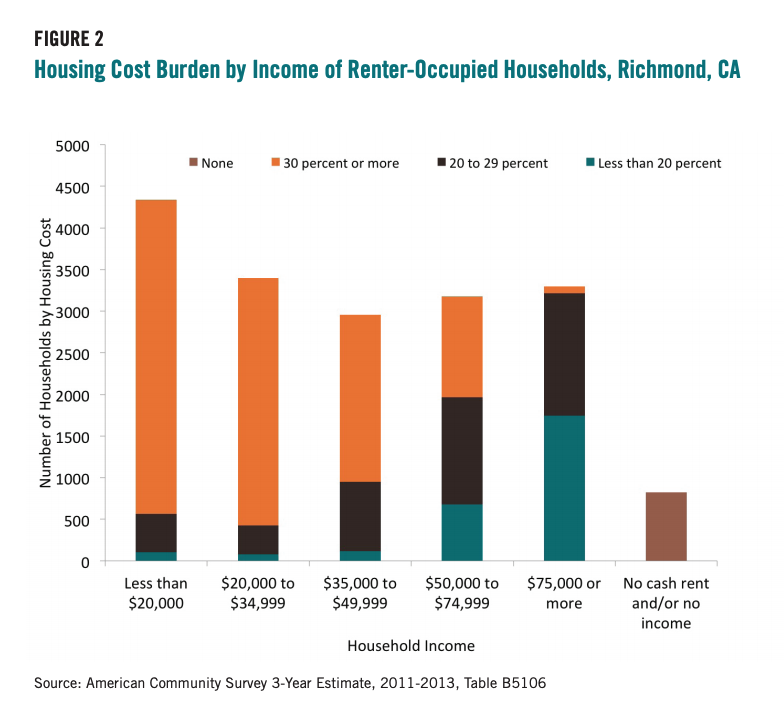
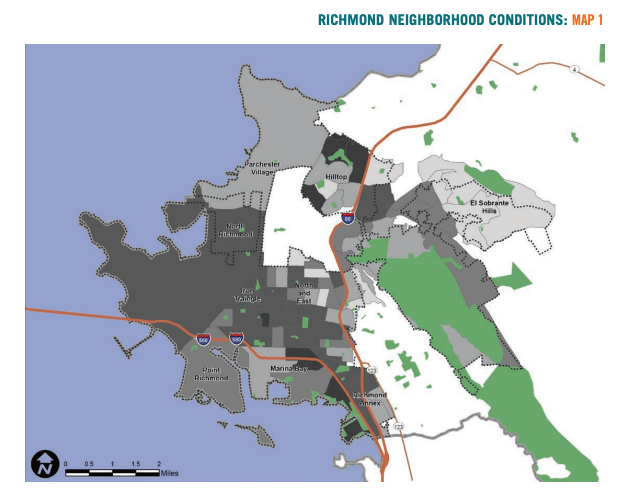
- Some 6,740 renter households - 37% of the total renters - earn less than $35,000 annually and spend more than 30% of their income on housing. In North Richmond and most of the central and south Richmond areas, there are areas with more than 80% renters. KEY FINDINGS
- Richmond is growing in its desirability within the regional real estate market, yet it continues to house many lowincome residents who have long called the city home.
- Displacement is a possibility, but can be halted.
- Policies matter. For Richmond to grow in an equitable way, it is critical that local policymakers and community groups act swiftly to implement local antidisplacement protections and policies to enable residents to stay and benefit from neighborhood change.
INTRODUCTION
‘IS DEVELOPMENT IN RICHMOND going to displace historic communities?’ is a question now frequently heard in this city of just more than 100,000 on the eastern edge of the San Francisco Bay. In Oakland, Richmond’s big sister city 10 miles to the south, and San Francisco, the patterns of gentrification are already well established. Oakland’s African American population fell by over 27%, losing 38,000 people, from the year 2000 to 2013. In San Francisco, African Americans decreased by 23%, or 13,600 people, during the same period, after already having lost 20,000 the decade before.1 The three cities have the largest African American communities in the region, and share some similar history. But Richmond is also distinct, further from the economic center of the region, with more modest housing stock, and still wrestling with a reputation for industrial pollution, struggling schools, and issues with crime.
Life in Richmond is improving on multiple fronts, with greater opportunity and better community health in the city being created. Homicides and violent crime are at historic lows, parks are being renewed with community-driven visions and new investments are being made to remove barriers for workers who have been excluded from the job market. These, along with many other efforts come together to literally change the life chances of Richmond residents. Health shows the cumulative effect of the living conditions in a place. In the words of public health leader Tony Iton, “Tell me your zip code and I’ll tell you your life expectancy.” Richmond is a changing place, and while there is plenty still that remains to be done, people are taking notice.
City and neighborhood changes that improve community health – less violence, better schools, better air quality – also make the place more appealing in the real estate market. In fact, the realtors’ mantra of ‘location, location, location’ similarly recognizes the importance of place, but toward a different end: buying and selling property. Some reports indicate real estate investors make up an increasing proportion of Richmond home buyers. In 2006 and 2007, absentee owners comprised just over 10% of people buying homes in Richmond, but by 2012 they made up more than 40% of buyers.2
Many of the community health efforts in Richmond are guided by values of equity and inclusion, with the goal of eliminating health disparities by improving the lives of marginalized community members. If these community members are also vulnerable to displacement from increased real estate values, then they may end up being excluded again from the benefits of a more economically vibrant and healthy place. This raises the question of how to make place-based improvement to community health in a way that has lasting benefits to community members. To help policymakers and community members explore this profound question, the Haas Institute set out to analyze current patterns of people and housing, and the degree of gentrification, in Richmond.
This research assesses the extent of gentrification in Richmond by analyzing changes in the demographics and housing market between the years 2000 and 2013. Gentrification trends in gentrification in Richmond are analyzed at the neighborhood level by adapting the methodology of previous analyses of Portland3 and the cities of San Francisco and Oakland.4 People and housing conditions are analyzed across three domains – Vulnerable population, Demographic Change, and Housing Market Conditions - to estimate the state of gentrification in a given city. The analysis is done at the level of the census Block Group, a set of boundaries created by the US Census that in Richmond have an average population of 1,428 residents. For a full explanation of the research methods, see the Appendix at the end of this report.
RICHMOND IN THE REGION
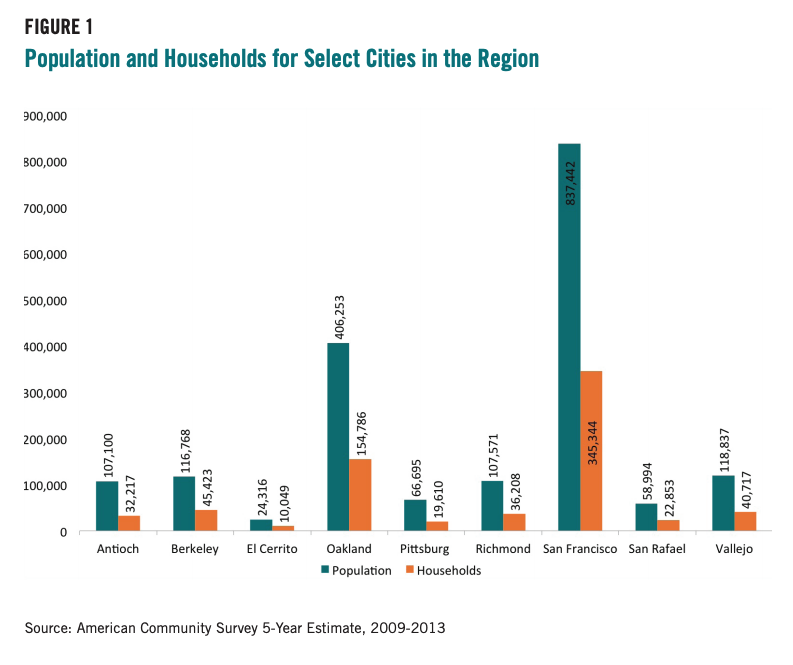
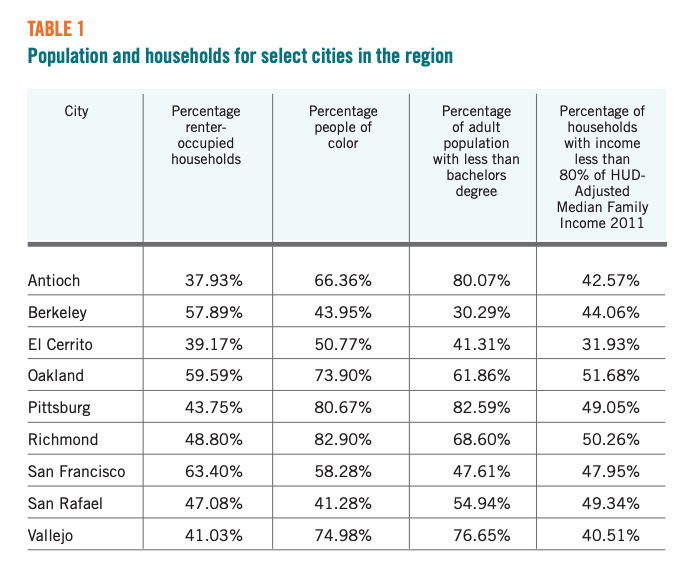
Here we analyze Richmond as a whole and several other cities in the region to see how their housing and demographic conditions compare. Though gentrification processes appear as local phenomena, they are often part of a regional process which impacts the local housing market. Thus it is important to study Richmond’s position within a region by comparing its threshold values with those of other cities which may impact Richmond’s housing market. Comparing threshold values for vulnerable population and demographic change for each listed city also sheds light on the region as a whole. The cities selected were those with a similar size population, proximity to Richmond, and/or significant role in the regional housing market.
Here we analyze Richmond as a whole and several other cities in the region to see how their housing and demographic conditions compare. Though gentrification processes appear as local phenomena, they are often part of a regional process which impacts the local housing market. Thus it is important to study Richmond’s position within a region by comparing its threshold values with those of other cities which may impact Richmond’s housing market. Comparing threshold values for vulnerable population and demographic change for each listed city also sheds light on the region as a whole. The cities selected were those with a similar size population, proximity to Richmond, and/or significant role in the regional housing market.
The percentage of a household’s income going to housing costs is another important indicator of vulnerability to displacement. Households are considered “housing cost burdened” when they spend more than 30% of income on housing. The high housing costs in the Bay Area mean that this is not unusual, even for higher income households. However, for low income households, a slight increase in housing costs can mean a trade-off with other necessities like food or healthcare. This is especially true for renters, who do not have economic resilience that comes with ownership and have less control over their housing costs. In Richmond, there are 3,770 households that earn less than $20,000 annually and spend more than 30% of their income on housing (Figure 2). Another 3,000 households spend 30% of income on housing and earn between $20,000 and $34,999.
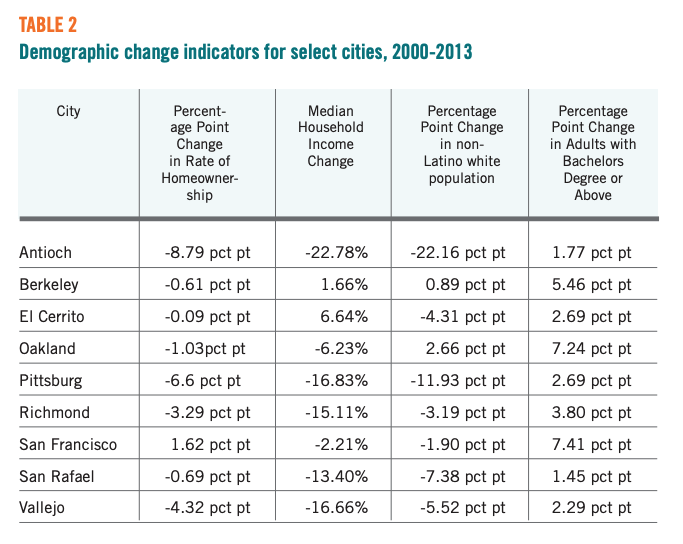
An analysis of demographic change in Richmond shows that homeownership has fallen in all of the selected cities besides San Francisco. The decrease in homeownership in Richmond is only exceeded by Vallejo and Antioch (See Table 2). Median household income in Richmond fell 15%, twice the rate of Oakland and far more severely than El Cerrito and Berkeley, which saw an increase in median income. The percentage of the population that is white has decreased 3 percentage points, a moderate decrease not as pronounced as in most other cities. A similar pattern is seen with the percentage of adults with a Bachelors degree or above, which has risen 3 percentage points in Richmond and between 1 and 7 points in other cities.
This stable percentage of populations of people of color masks dramatic changes in the African American, Asian and Pacific Islander, and Latino populations in Richmond. The number of African Americans in Richmond decreased from 35,300 in the year 2000, to 22,800 in 2013, a drop of 35%. During the same period, the Latino population grew from 26,300 to 42,600, an increase of 62%. The Asian and Pacific Islander population grew from 12,500 to 15,800, a 26% rise.
RICHMOND NEIGHBORHOOD CONDITIONS
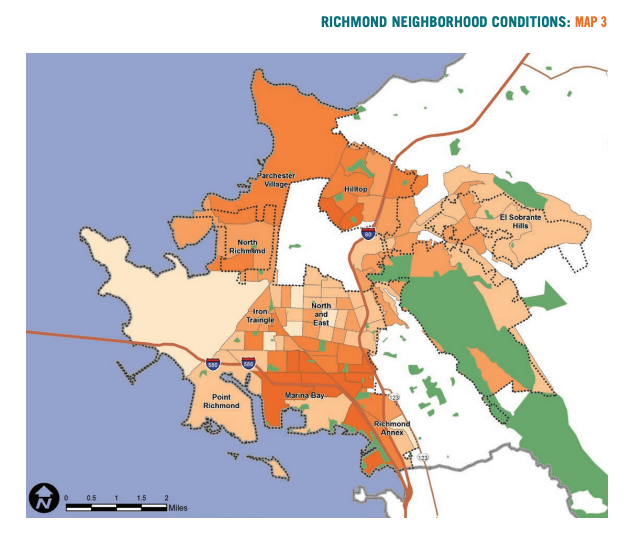
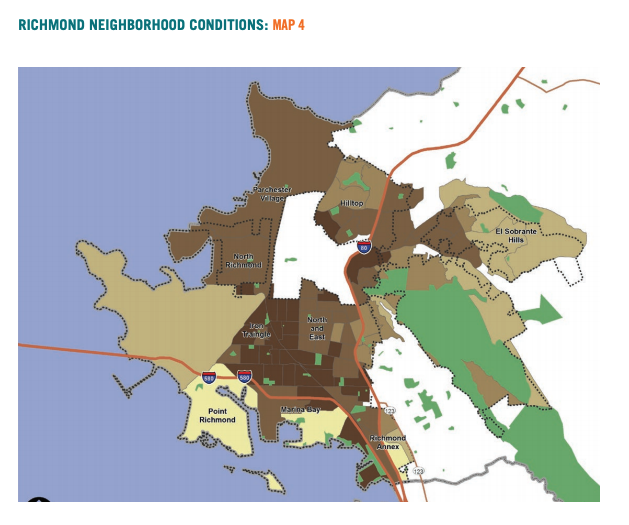
Although Richmond is a relatively small city, the variation between neighborhoods within the city is striking. In this section we use a series of 10 maps to analyze the data for each indicator: demographics, demographic change, and housing market conditions.
Renter Households
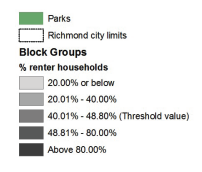
Parchester Village, Marina Bay Hilltop and El Sobrante Hills have Block Groups with only 40% or lower percentages of renter-occupied households. North Richmond, most of the central and south Richmond areas, and other areas have a higher concentration of renters than the city as a whole, with some areas above 80% renters.
Communities of Color Population
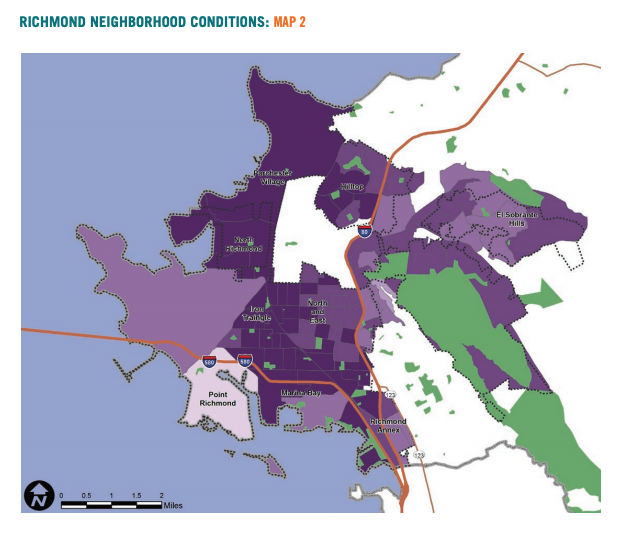
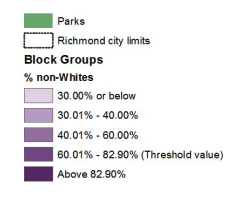
The category “communities of color” aggregates together many racial and ethnic groups in a way that we recognize can be problematic, but the indicator does allow a glimpse at dynamics between white community members and residents who are parts of groups affected by racial exclusion. Most of the Block Groups in Hilltop, Parchester Village, North Richmond, and the Iron Triangle have non-White population percentages that are higher than the average value for the city. Point Richmond, parts of Marina Bay, and El Sobrante Hills have percentages at or below 40% white.
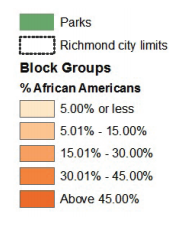
African American Population
The percentage African American is broken out of the non-white population because of the well-documented history of African American communities being highly impacted by gentrification. In the city as a whole, the percentage that is African American is 24%. The percentage is higher in areas of Hilltop, Parchester Village, North Richmond, Iron Triangle, and South Richmond.
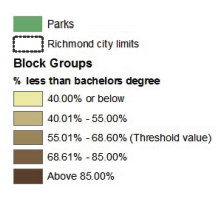
Adult Education Attainment
Adults with more than a bachelors degree in Richmond are highly concentrated in a few neighborhoods. In the Iron Triangle, fewer than one out of seven adults has a bachelor’s degree or higher. In Parchester, North Richmond, North and East, and parts of El Sobrante, the rates of adults without a bachelors degree are higher than the city average of 68.6%.
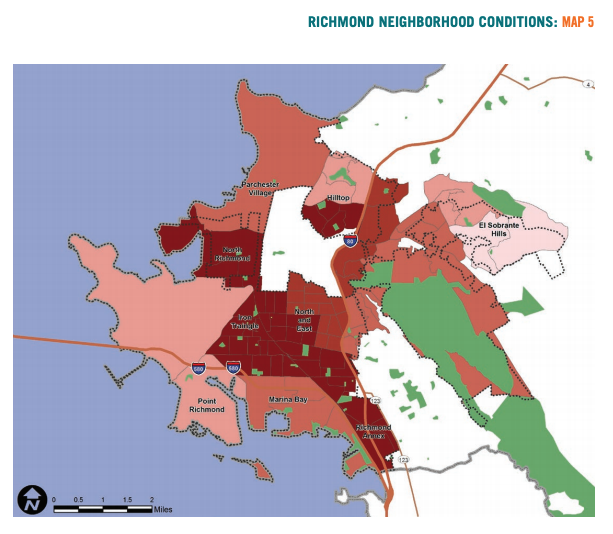
Low Income Households
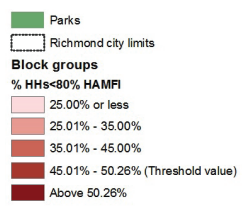
Nearly all Block Groups in North Richmond, Iron Triangle and the Richmond Annex have percentages of low income households that are above 50%, higher than the city average. This is also true of nearly half of the Block Groups in the Hilltop and North and East neighborhoods. El Sobrante Hills, Point Richmond, and parts of Hilltop have 25% or lower rates of low income households.
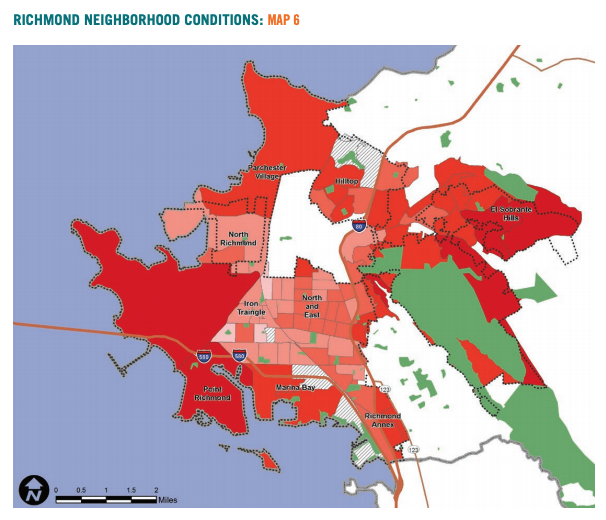
Median Housing Value
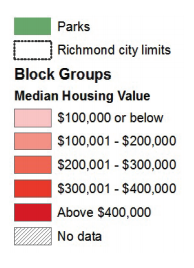
Median housing value within Richmond varies widely from less than $100,000 to above $400,000. North Richmond, Iron Triangle, South Richmond and parts of North and East have Block Groups with median housing values at less than $100,000 or $200,000. El Sobrante Hills, Point Richmond, and parts of Richmond Annex have median values at $400,000 and above.
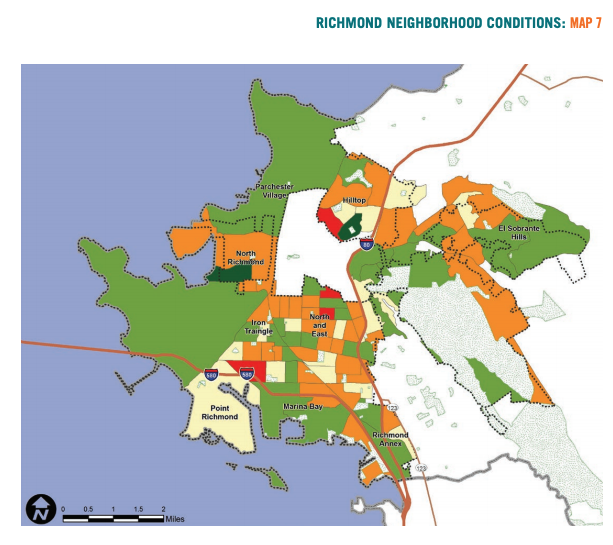
Demographic change in Richmond varies widely by neighborhood, and even among Block Groups within neighborhoods. The following four maps show the change in homeownership, household income, non-white population, and educational attainment at the Block Group level.
Change in Homeownership
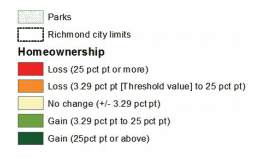
The spatial pattern of homeownership rates within the city is rather random. One Block Group each in the Hilltop and North Richmond neighborhoods show the highest percentage gain. Right next to the Hilltop Block Group with the highest gain is an area with the most dramatic loss in homeownership. A couple of Block Groups in North and East and South Richmond also lost more than 25 percentage points in their homeownership rate.
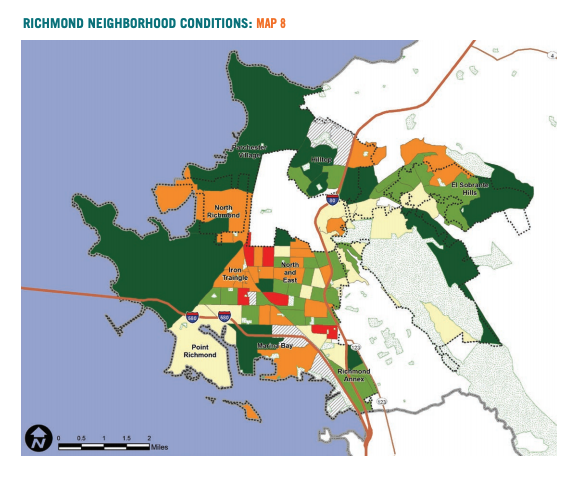
Housing Value Appreciation
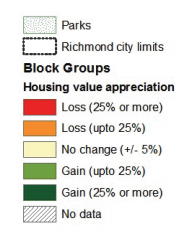
Housing values within Richmond neighborhoods have appreciated by more than 25% in some areas while falling by more than 25% in others. Parchester Village and areas of Hilltop, Marina Bay, and El Sobrante Hills have housing values that have risen by more than 25%. Areas of North Richmond, Iron Triangle, Belding Woods and North and East have housing values that lost up to, and in some cases more than, 25%.
Change in Median Household Income
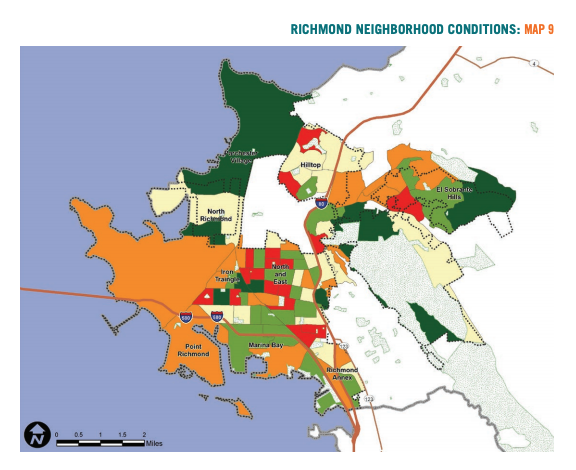
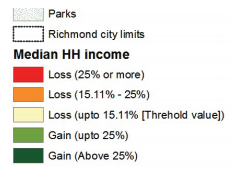
Changes in the household income at the Block Group level also show a varied pattern. Parchester Village and parts of North Richmond and El Sobrante Hills display high gains in median income from 2000 to 2013. Some of the Block Groups in and around Hilltop, in the Iron Triangle, and North and East show steep declines in household income.
Change in White Population
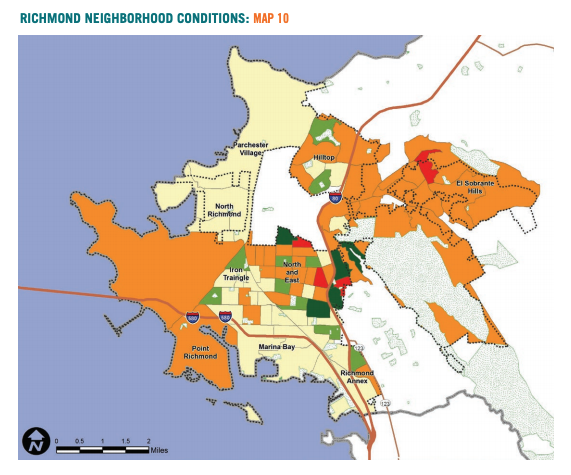
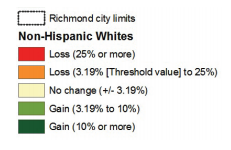
Most areas in the city have had no change in the percentage white population, or have had a slight loss in the percentage of white populations during the time period. Gains of 10% or more in the white population percentage are seen in areas along Interstate 80. However, this corridor also has areas that have lost 25% or more.
STAGES OF GENTRIFICATION IN RICHMOND NEIGHBORHOODS
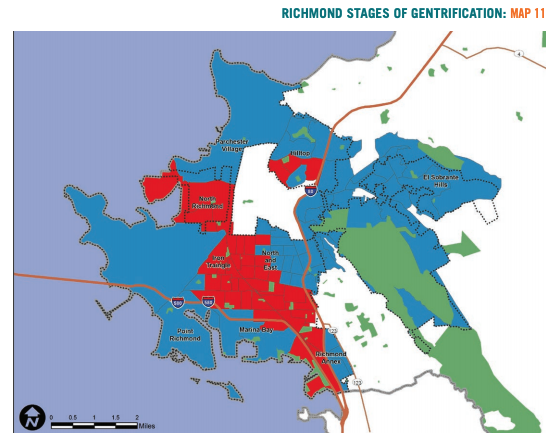
To compose a singular assessment of gentrification in Richmond neighborhoods, this analysis combines the previous datasets into an overall measurement for each Block Group. The first component of this measurement is the analysis of whether there is vulnerable population. A Block Group has vulnerable population if three out of the following four rates are higher than the city average: renter-occupied households, people of color, residents with less than bachelor degree education, and households earning less than 80% median family income.
Vulnerable Populations
All Block Groups within North Richmond and Iron Triangle neighborhoods have populations which can be considered vulnerable. Additionally, portions of Hilltop, North and East, and Richmond Annex display presence of vulnerable population.
Demographic Change
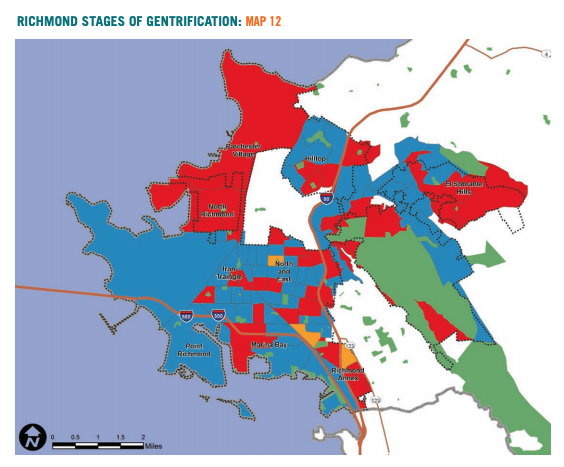
The second component of the assessment measures whether there has been gentrification-related demographic change. For an area to qualify as having gentrification-related demographic change, at least three of the following four conditions must be intensifying faster than the city average: the rate of homeowner-occupied households, median household income, percentage white population, and percentage of adults with a bachelor degree or above.
Richmond neighborhoods vary, with some areas showing gentrification-related demographic change while others do not. All of Parchester Village and North Richmond, and portions of El Sobrante Hills and Richmond Annex display gentrification-relation demographic change (See Map 2 red areas). Some areas of the North and East, Iron Triangle, and Marina Bay neighborhoods also show this change.
Some areas show an increased percentage of White residents and residents with higher than a bachelors degree, without an increase in homeownership or household income. There are three Block Groups that exhibit this trend (displayed in orange).
Housing Market Conditions
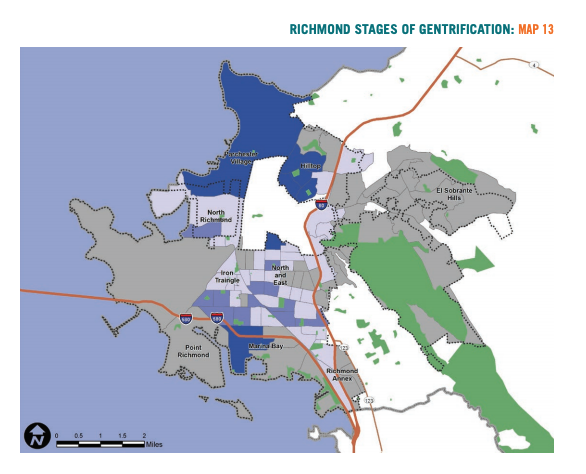
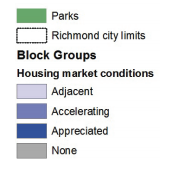
The third component of the assessment is an analysis of housing market conditions. Housing market conditions fall into four categories: Appreciated, Accelerating, Adjacent, and none (no change).
“Appreciated” refers to Block Groups where there were low or moderate housing values in the year 2000, followed by high values in 2013. “Accelerating” refers to areas in which there were low or moderate housing values in the year 2000, followed by high appreciation, but not reaching a high value in 2013. “Adjacent” refers to areas with low or moderate value in 2013, low or moderate appreciation since 2000, and are next to areas that have had high appreciation and/ or high value in 2013.
Areas with Appreciated housing conditions include Parchester Village, Hilltop, and Marina Bay. Accelerated housing conditions are found in parts of Iron Triangle and South Richmond, North and East, and North Richmond. Housing conditions categorized as Adjacent are along the I-80 corridor, North and East, Iron Triangle, and North Richmond.
Gentrification Analysis
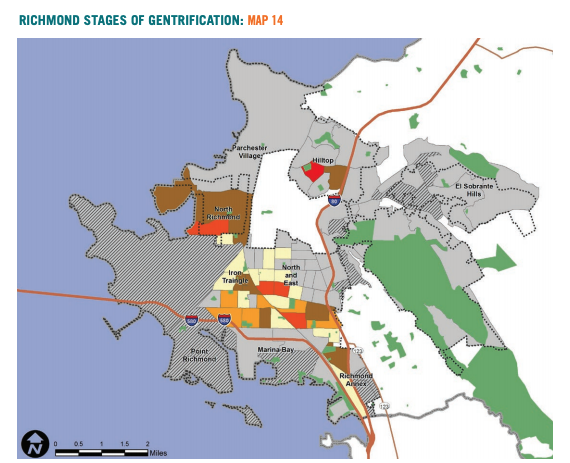
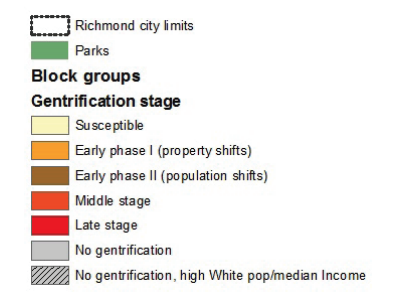
Combining the data on vulnerable populations, demographic change, and housing market conditions to assess an overall trend reveals the stage of gentrification that each neighborhood is in. Richmond Block Groups are categorized into six neighborhood types: Susceptible, Early Phase 1 or 2, Middle Stage, Late Stage, and Ongoing Gentrification.
Susceptible Neighborhoods are those with the presence of vulnerable populations, with low or moderate median housing values, and that touch a boundary of another neighborhood which either has a high median housing value or a high appreciation of housing value between 2000-2013. There are several Block Groups that fall into the category of Susceptible to gentrification in parts of the Iron Triangle, Belding Woods, and North and East neighborhoods.
Neighborhoods in Early Phase 1 are those with the presence of vulnerable population, with low or moderate median housing value, and high appreciation of housing value between 2000-2013. Areas in Early Phase 1 of gentrification are concentrated in parts of the Iron Triangle, South Richmond, and the Pullman and Park Plaza neighborhoods.
Early Phase 2 Neighborhoods are those with the presence of vulnerable populations, with demographic change between 2000-2013, with low or moderate median housing values, and touch a boundary of another neighborhood which either has a high median housing value or a high appreciation of housing value between 2000-2013. Areas in this stage include parts of the North Richmond, Hilltop, Iron Triangle, Park Plaza, and Richmond Annex neighborhoods.
Neighborhoods in the Middle Stage have vulnerable population, demographic change between 2000-2013, low or moderate median housing value, and high appreciation of housing value between 2000-2013. The areas in this stage include parts of the North Richmond, Belding Woods, Iron Triangle, North and East, and Pullman neighborhoods.
Late Stage neighborhoods are those with the presence of vulnerable population, demographic change between 2000-2013, low or moderate housing value in 2000, high median housing value in 2013, and high appreciation of housing value between 2000-2013. The data suggest that one Block Group in the Hilltop neighborhood is in the Late Stage of the gentrification process.
Neighborhoods categorized as None show no signs of gentrification. These areas are broken into two groups: one which already has a high percentage White population (>50% and high median income (>$75,000) in year 2000, and another that does not. This latter type applies to areas like Parchester Village, where there is 80% non-white population and there has been significant demographic change and appreciated housing values, but there is not a vulnerable population due to the fact that the area has only 20-40% renter-occupied homes and 50% low income households. The other category for areas that already had higher percentages white and higher median income applies to areas like Point Richmond. There are no areas in the city that fell into the category of Ongoing Gentrification.
This is significant because the last stage of gentrification involves displacement of vulnerable populations. This means that Richmond policymakers and community members have an opportunity to prevent neighborhoods from moving into that stage by implementing anti-displacement protections now. Swift action is necessary in order to prevent significant displacement of Richmond’s existing population.
CONCLUSION
The overall pattern in Richmond is a mixed one of gentrification that is in its early and middle stages in some areas across the center of the city and in North Richmond and near Hilltop, while other areas of the city show no signs of gentrification. The fact that the number of African Americans in Richmond fell by 12,500 between 2000 and 2013, a drop of 35%, is alarming and deserves further analysis. For those concerned with the displacement that accompanies gentrification, this research suggests the city may still be early enough in the process to prevent it from intensifying.
Some of the economic and housing trends at the city level show troubling signs. Median household income in Richmond fell 15%, twice the rate of Oakland and far more severe than El Cerrito and Berkeley, suggesting that the city is still reeling from the financial crash. The decrease in homeownership in Richmond is only exceeded by Vallejo and Antioch, both cities well known as among the hardest hit by the foreclosure crisis. The result is large portions of the city made up of low income renters. Some 6,740 renter households (37% of the total renters) earn less than $35,000 annually and spend more than 30% of their income on housing. In North Richmond and most of the central and south Richmond areas, there are areas with more than 80% renters. These facts raise concern that if regional trends of accelerating housing prices and persistent inequality hit Richmond, a substantial part of the city could be vulnerable.
In order for Richmond to grow in an equitable way, it is critical that local policymakers and community groups act swiftly to implement local anti-displacement protections and policies to enable residents to stay and benefit from neighborhood change. As a phenomena tied to regional and even global economic structures, gentrification can only partly be addressed at the city level. Effective responses must be nuanced and targeted. There are several useful reports and policy guides for developing anti-displacement policy.5
Several principles and frameworks are important for understanding and responding to potential displacement. First, place matters. Community health and opportunity are very much shaped by place. Identity and sense of self are often deeply tied to a place. Displacement can mean fragmenting and losing touch with these life anchors. Secondly, people matter. One of the reasons place matters is that human relationships are embedded in a place. Social networks embedded in place are a primary source of resilience. Resilience is the ability to cope with, stay well, and grow in the face of adversity. People look to their nearby friends and family, neighbors and community resources when faced with challenges - whether they be facing foreclosure, dealing with physical illness, or loss of a job.
But another relevant truth is that sometimes changing places is an essential way to access greater opportunity or connect with a more supportive social network. The Great Migration of African Americans from the southern US in the first half of the twentieth century was an example of how changing places was a way to realize greater opportunity, safety and inclusion. Yet it also entailed the breaking up of relationships within and among families and communities. The migration from Mexico to the US reflects a similar combination of enhanced opportunity combined with ruptured relationships and networks. Some have pointed out that “the human truth is that all people move, and all people have rights”, using the metaphor of the butterfly to describe the essence of migration.6 People, like butterflies, pick up and move across space and touch down in a new place.
What distinguishes displacement from other forms of movement or migration is the lack of power that people have to stay in their place. As David Bacon argues, “Migration should be a voluntary process in which people can decide for themselves if and when to move, and under what circumstances.” But for this decision to be voluntary, many other conditions must be met. In the words of Rivera Salgado, “The right to not migrate is not meaningful if it is not also the right to go to school, the right to make a living from farming, or the right to health care and decent housing.”7
Put positively, we might say that the right to not be displaced is the right to belong. To belong relies on housing, education and other necessities to be available in a place. But clearly, the provision of these necessities relies on the institutions, norms, and policies that govern them. Thus the definition of belonging as described by john a. powell is that “belonging means that your well-being is considered and your ability to help design and give meaning to structures and institutions is realized.” The ability of community members to design the structures and institutions that shape their well-being is integral to belonging. This may be the most important principle for answering this paper’s initial question of whether development will displace historic communities. The data show that parts of Richmond are in the early stages of gentrification, which means displacement is a possibility. If Richmond is to pursue a vision in which everyone belongs, the communities at risk of displacement must be fully involved in structuring the city’s development.8
- 1Census 2000 Table P008 and American Community Survey 3-Year Estimate 2011-2013 Table B03002
- 2Boyer, Mark Andrew (10/26/2013) Investors Pounce on Richmond Real Estate Market. Richmond Confidential. http://richmondconfidential.org/2013/10/26/investors-pounce-on-richmond…
- 3Gentrification and Displacement Study: Implementing an Equitable Inclusive Development Strategy in the Context of Gentrification by Lisa A. Bates. http://pdxscholar.library.pdx.edu/usp_fac/83/
- 4Development Without Displacement: Resisting Gentrification in the Bay Area by Causa Justa Just Cause. http://cjjc.org/publications/reports/item/1421-development-without-disp…
- 5See the two reports cited above by Lisa Bates and by Causa Justa Just Cause, as well as Strategies to Prevent Displacement of Residents and Businesses in Pittsburgh’s Hill District, online at http://www.pdx.edu/usp/sites/www.pdx.edu.usp/files/A_LivingCully_Printe…, and Not in Cully: AntiDisplacement Strategies for the Cully Neighborhood, online at http://www.hdcg.org/anti-displacement.
- 6Various (2015) Migration is Beautiful, Artists’ Statement on Immigration Reform. http://migration.lib.uiowa.edu/
- 7Bacon, David (2013) The Right to Stay Home, pg. 284
- 8powell, john (2012) “Poverty and Race Through a Belongingness Lens” in Policy Matters, Volume 1, Issue 5.
