UPDATE, October 11, 2021: We have updated and expanded our research on residential segregation using 2020 Census data. Click here to read more about this work.
In 2018, we launched a project investigating the extent, harm and solutions to racial residential segregation in the San Francisco Bay Area. Including the research phase, this project took more than two years to complete. Although our research plan was carefully thought out in advance, our investigation nonetheless took us in unexpected directions. For example, when we launched the first brief in the series, displaying original segregation maps of the Bay Area, we did not anticipate that we would end up creating an interactive mapping tool for the third brief that contained this information, but much more besides. Moreover, although we planned to investigate the role of exclusionary zoning in perpetuating segregation, we did not fully appreciate the voluminous feedback and response to our zoning analysis, which prompted a follow-up brief that expanded our analysis beyond racial residential segregation.
In the first and second briefs in the series, we identified places that were the most segregated and racially isolated in the Bay Area. In the first brief, we did this by separately analyzing all nine counties, and identifying the most segregated neighborhoods in each county. In the second brief, we did this by focusing on five racial groups, and examining the cities that had the highest concentration of each racial group by county, and then also identifying certain areas that had seen the most racial demographic change over time, such as areas that experienced significant gentrification and displacement.
But at no point in our series did we clearly identify the cities in the Bay Area that were the most segregated or most integrated. Our maps looked at census tracts (neighborhoods), counties, and occasionally, metropolitan statistical areas (MSAs). Until we conducted our zoning research, cities were not a generally a unit of analysis in our series.
We offer this addendum to our series to address our omission.
As explained in Part 3 of our segregation series, there are several measures of segregation. We apply the Divergence Index (explained there) to identify the most segregated (and integrated) cities. There is one caveat, however. For each city, there are two forms of segregation to consider: segregation of the residents from the larger region (inter-municipal segregation) and the segregation of people between neighborhoods within the city (intra-municipal segregation).
Intra-municipal segregation is more apparent in large cities with racially identifiable areas, like Oakland. But smaller, more racially homogeneous cities, like Lafayette, segregated their residents from people of different races through municipal boundaries and exclusionary policies, resulting in inter-municipal segregation. Therefore, we have developed separate lists for each, but our main focus is on inter-municipal segregation. It is this form of segregation which predominates and results in extreme racial isolation in a diverse region.
The Most Racially Segregated Cities in the Bay Area Measured by "Inter-Municipal" Segregation
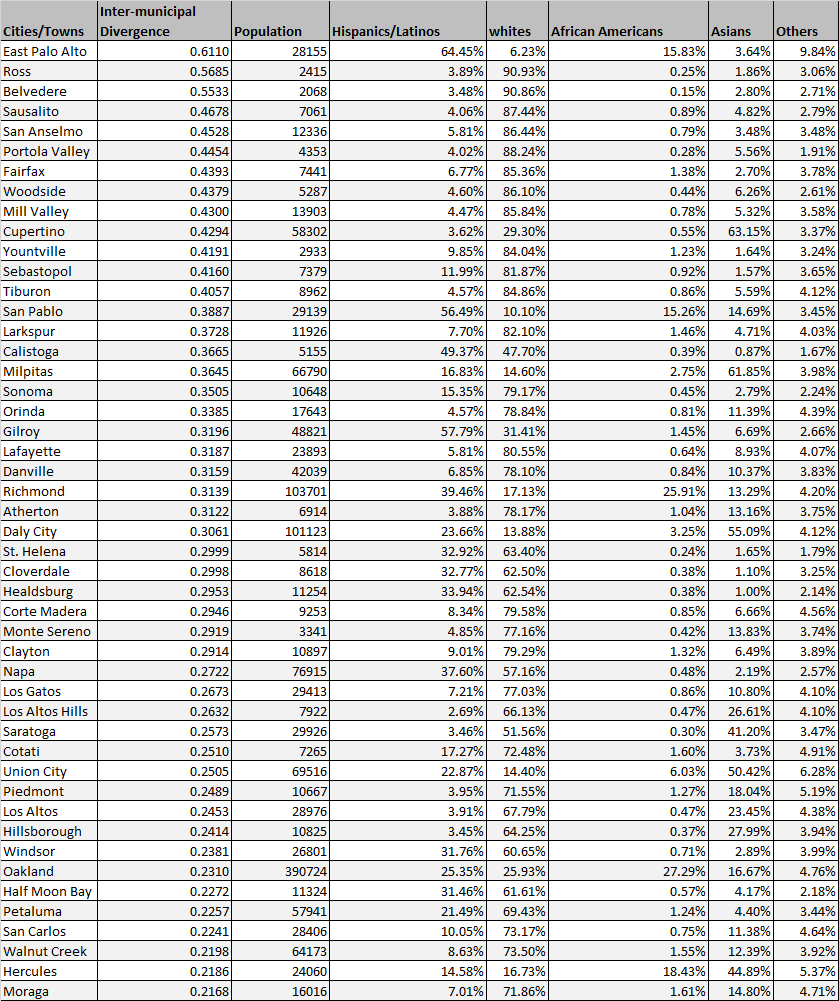
There are 101 incorporated municipalities in the Bay Area, and so it is a simple matter to rank all of them with their divergence score. Looking at inter-municipal segregation first, which compares the demographics of the cities against that of the Bay Area, we find clear patterns.
An inordinate number of the most segregated cities in the Bay Area are smaller cities that are more than 85 percent white in Marin County (Ross, Belvedere, Sausalito, San Anselmo, Fairfax, and Mill Valley are each in the top 10). Two of the top 10 are similarly small-sized, heavily white cities in San Mateo County (Portola Valley and Woodside).
But the most segregated city in the Bay Area is East Palo Alto (with a “between” divergence score of .61). This is not surprising: East Palo Alto was a historically Black community created from redlining and racial exclusion that limited where Black families could live in the region. Although East Palo Alto remains 16 percent Black (a much larger proportion than the Bay Area as a whole), East Palo Alto is now heavily Latinx (64.4 percent), as it has been one of the more affordable areas in the region.
Rounding out the top 10 most segregated cities in the Bay Area is Cupertino, the largest city in the top 10 (with a population of more than 58,000 people and the location of the corporate headquarters of Apple). Cupertino is also the only city in the top 10 most segregated cities that is predominantly Asian (63 percent). Clearly, segregation comes in many forms. But the most segregated white and/or Asian cities tend to be those with a higher-than-average percentage of single-family-only zoning.
The Most Racially Segregated Cities in the Bay Area Measured by "Intra-Municipal" Segregation
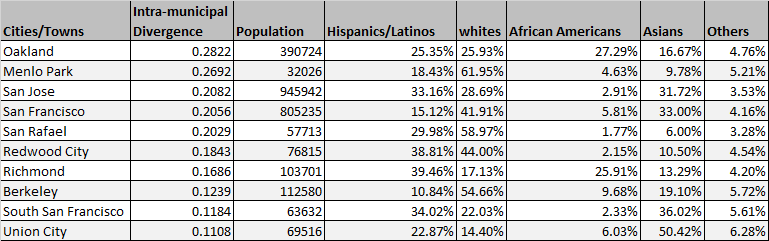
When we look at neighborhood segregation, however, the complexion changes considerably. As noted above, these cities are generally large and diverse, but have readily racially identifiable neighborhoods. Oakland, not surprisingly, is at the top of the list, followed closely by Menlo Park. These two cities occupy their own top tier of most segregated cities with closely similar neighborhood divergence scores. The next tier and bunched up at similar scores is San Jose, San Francisco and San Rafael, which have moderate to high levels of neighborhood segregation. Behind them is a tranche of cities squarely in the moderate range: Redwood City, Richmond and Berkeley. Rounding out the top 10 is then cities which are low to moderately segregated at the neighborhood level: South San Francisco and Union City. Just beyond the top 10, and not far behind in terms of segregation score, are Dublin and Concord.
The Most Integrated Cities in the Bay Area
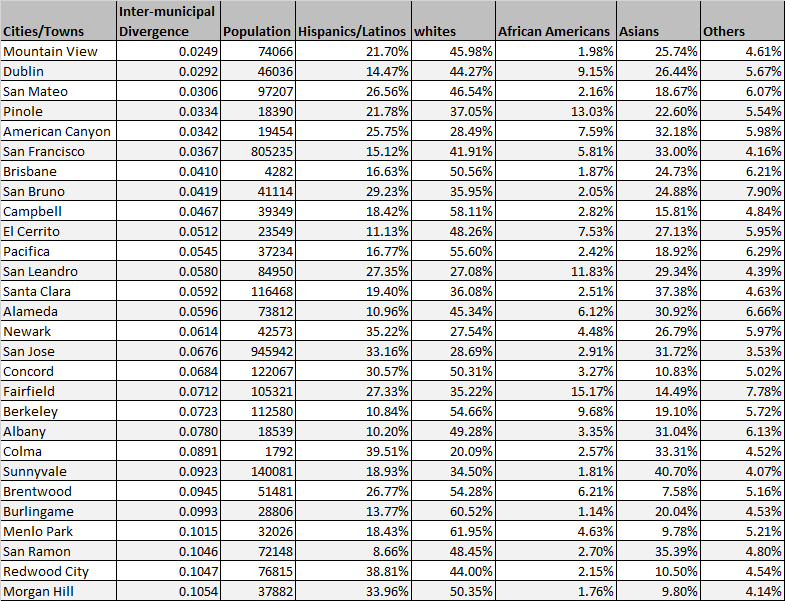
Given the patterns described, it should not be surprising that the most integrated cities tend to be larger on average. Smaller cities are much more likely to be exclusionary city-wide, while such exclusion tends to occur only at the neighborhood level. With one exception, all of the cities in the top 10 most integrated cities have more than 18,000 residents, and most are considerably larger.
The most integrated city in the Bay Area, according to the divergence score, is the affluent city of Mountain View, which is 46 percent white, 2 percent Black, 22 percent Latinx, and 26 percent Asian, figures that approximate the racial composition of the Bay Area as a whole.
The rest of the cities in the top 10 are dispersed in a partial ring around the Bay Area: Campbell in Santa Clara, Brisbane, San Bruno, and San Mateo City (each in San Mateo County), the city of San Francisco, Dublin in Alameda County, Pinole and El Cerrito in Contra Costa County, and American Canyon in Napa County. It is difficult to identify a thread that connects these cities, but none of them have a white population above 58 percent or below 35 percent, even though the particular constellation of communities of color may be quite different.
Summary
Despite its reputation as a progressive and inclusive region, the Bay Area is – like the rest of the country – highly segregated. The most segregated cities in the Bay Area are those that are either historically places where people of color were permitted to live, when locked out of other places, or are highly exclusionary and heavily white mid-sized to smaller suburbs, exurbs or rural cities and towns in places like Marin and San Mateo counties. In contrast, the most integrated places, with the exception of San Francisco, are a ring of slightly larger suburbs that trace an arc across the Bay from San Mateo and Santa Clara through East Bay counties such as Contra Costa, Alameda and Napa.
Click to download an excel sheet with the rankings of all Bay Area cities by level of segregation.